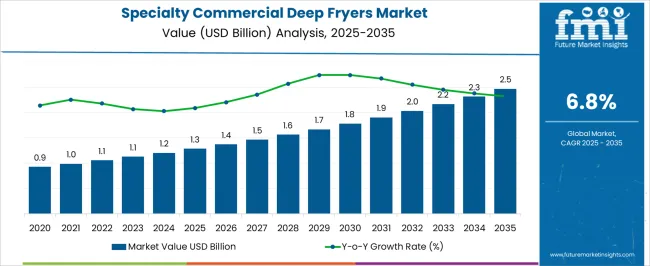
The Specialty Commercial Deep Fryers Market is estimated to be valued at USD 1.3 billion in 2025 and is projected to reach USD 2.5 billion by 2035, registering a compound annual growth rate (CAGR) of 6.8% over the forecast period.
| Metric | Value |
|---|---|
| Specialty Commercial Deep Fryers Market Estimated Value in (2025 E) | USD 1.3 billion |
| Specialty Commercial Deep Fryers Market Forecast Value in (2035 F) | USD 2.5 billion |
| Forecast CAGR (2025 to 2035) | 6.8% |
The specialty commercial deep fryers market is witnessing consistent growth driven by rising demand for efficient, high volume cooking solutions across foodservice establishments. Growing consumer preference for fried foods combined with the expansion of quick service and fast casual restaurant chains has significantly influenced equipment adoption.
Energy efficiency, operational safety, and automation features are increasingly prioritized by foodservice operators to manage costs and maintain consistency in output. Advances in heat distribution technologies and fryer design are supporting improved oil utilization and faster cooking cycles, further boosting demand.
Regulatory emphasis on workplace safety and energy conservation is also shaping purchasing decisions in the market. The outlook remains positive as restaurants continue to adopt high performance fryers that enhance productivity, reduce oil consumption, and align with evolving sustainability standards in the commercial foodservice industry.
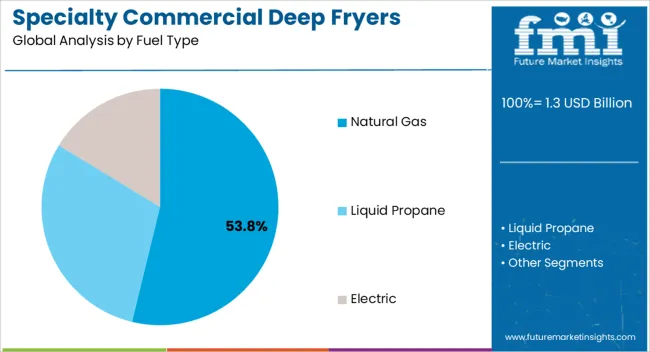
The natural gas segment is projected to account for 53.80% of total market revenue by 2025, making it the leading fuel type. Its dominance is attributed to the cost efficiency of natural gas compared to electricity and its ability to deliver consistent heating performance in high volume cooking operations.
Quick heating, reliable temperature control, and reduced operational costs have reinforced its adoption in large scale foodservice outlets. Additionally, widespread availability of natural gas infrastructure has facilitated easier integration into commercial kitchens.
The segment’s growth continues to be supported by the preference for durable, cost effective, and high efficiency solutions in busy restaurant environments.
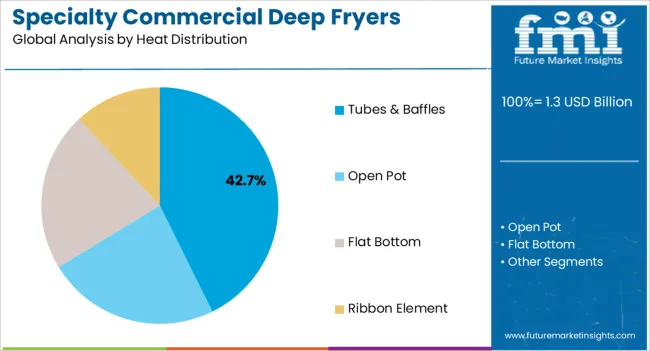
The tubes and baffles segment is expected to contribute 42.70% of overall revenue by 2025 within the heat distribution category, positioning it as the most prominent configuration. This design is favored for its superior heat transfer efficiency, uniform oil heating, and ability to maintain temperature stability during continuous frying cycles.
The configuration minimizes cold spots and enhances cooking consistency, which is critical for maintaining product quality in commercial kitchens. Lower oil degradation and improved energy efficiency further support its adoption.
As foodservice operators seek reliable solutions that balance performance and operating costs, tubes and baffles have emerged as the dominant heat distribution system.
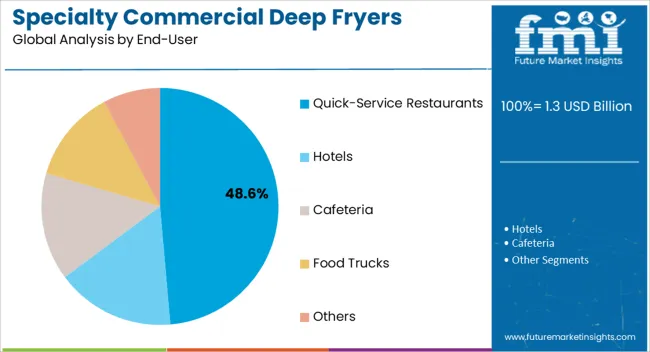
The quick service restaurants segment is projected to represent 48.60% of total revenue by 2025 under the end user category, making it the largest contributor. Growth is driven by the global expansion of fast food chains and the rising demand for fried menu items offered at affordable price points.
Quick service restaurants require high capacity fryers capable of delivering consistent output within limited preparation times, which has reinforced adoption. The emphasis on speed, efficiency, and standardized cooking across multiple outlets has further strengthened reliance on advanced fryer technologies.
With the quick service sector continuing to lead foodservice expansion worldwide, this segment remains the largest driver of growth within the specialty commercial deep fryers market.
The global demand for specialty commercial deep fryers is projected to increase at a CAGR of 3.8% during the forecast period between 2020 and 2025, reaching a total of USD 2,154.7 million in 2035. According to Future Market Insights, a market research and competitive intelligence provider, the Specialty Commercial Deep Fryers market was valued at USD 1,055.8 million in 2025.
The growing popularity of ethnic foods, especially Asian and Latin American cuisines, is one of the major trends expected to augment the growth of the specialty commercial deep fryers market. These cuisines have gained immense popularity globally due to their unique flavors, textures, and cooking techniques, which often involve deep-frying.
Also, specialty commercial deep fryers, such as woks and tempura fryers, are specifically designed to handle these types of dishes, making them more attractive to restaurant owners and chefs. For instance, woks are a versatile cooking tool commonly used in Chinese cuisine for stir-frying, deep-frying, and steaming. Specialty commercial wok fryers have a deep and wide bowl-shaped design, allowing chefs to cook multiple ingredients quickly and efficiently.
Similarly, tempura is a popular Japanese dish that involves deep-frying battered seafood and vegetables. To prepare this dish correctly, chefs require a specialized tempura fryer that has a precise temperature control mechanism and a large frying basket to prevent overcrowding. As the demand for ethnic foods continues to rise, restaurant owners and chefs are increasingly investing in specialty commercial deep fryers that can handle these dishes efficiently. This trend is expected to boost the growth of the specialty commercial deep fryers market, particularly for woks and tempura fryers.
Moreover, as consumers become more adventurous with their food choices, the demand for ethnic cuisines is expected to continue to rise, further fueling the demand for specialty commercial deep fryers. Additionally, with the rise of food delivery services and the growing number of restaurants offering delivery options, the demand for commercial deep fryers is expected to increase to meet the demand for fried food items.
Increasing Demand for Specialty Foods to Fuel the Market Growth
Specialty foods are becoming increasingly popular as consumers seek unique and high-quality food experiences. Ethnic cuisines, gourmet fried foods, and healthy snacks are some of the specialty food categories that are witnessing strong demand in the market.
To cater to this demand, restaurants and foodservice establishments are investing in specialized equipment such as Specialty Commercial Deep Fryers. These fryers are designed to meet the unique requirements of specialty foods, such as lower oil absorption, quicker cooking time, and temperature control, making them an essential tool for foodservice establishments looking to serve specialty foods.
In addition, the increasing popularity of street food and food trucks is also driving the demand for specialty commercial deep fryers, as these establishments require fryers that are portable, compact, and efficient. Thus, the increasing demand for specialty foods is expected to bolster the growth of the Specialty Commercial Deep Fryers Market during the forecast period.
Growing Number of Quick-Service Restaurants to Accelerate the Market Growth
Quick-service restaurants (QSRs) are a growing segment of the foodservice industry, driven by changing consumer preferences and busy lifestyles. QSRs require specialized commercial deep fryers that can meet their high-volume cooking needs while maintaining quality, consistency, and efficiency. Specialty commercial deep fryers with features such as multiple baskets, programmable controls, and oil filtration systems are specifically designed to meet the unique requirements of QSRs.
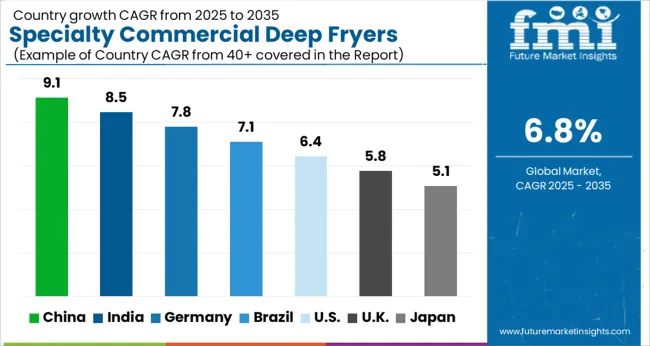
In addition, the growing trend of online food ordering and delivery is also driving the demand for specialty commercial deep fryers, as QSRs seek to meet the demand for fried food items from customers who order food online. The increasing number of QSRs, especially in emerging markets such as China and India, is therefore expected to foster the growth of the Specialty Commercial Deep Fryers Market in the forthcoming years.
High Costs Associated with the Fryers to Restrain the Market
Specialty commercial deep fryers can be expensive to purchase and maintain, which could limit their adoption by smaller foodservice establishments that have limited budgets. These fryers are designed to meet specific needs and requirements of foodservice establishments, and hence, come with a higher price tag.
Additionally, the maintenance and repair costs associated with these fryers are also high. This could make it difficult for smaller establishments to invest in these fryers, as they may not have the necessary funds to make such a large purchase. As a result, these establishments may opt for cheaper alternatives that may not be as efficient or effective.
Furthermore, there are several alternatives to deep frying, such as grilling, baking, and air frying, which can produce similar results with less oil and fat. The availability of these substitutes is another major factor that could hinder the demand for specialty commercial deep fryers. For instance, air fryers use hot air to cook food, which can produce crispy results without the need for oil. This makes them a popular choice among health-conscious consumers who want to reduce their intake of fat and calories.
Similarly, grilling and baking are also popular cooking methods that can produce similar results to deep frying. As a result, foodservice establishments may opt for these alternatives instead of investing in specialty commercial deep fryers, which could limit the growth of the market.
Increasing Number of Fast-Food Chains in North America to Fuel the Market Growth
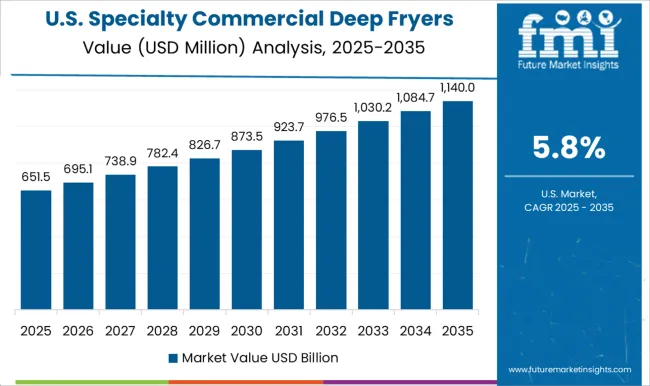
The specialty commercial deep fryers market in North America is expected to accumulate the highest market share of 33.0% in 2025. Fried food products such as chicken, French fries, and onion rings remain popular in North America, which is driving the demand for specialty commercial deep fryers in the region. In addition, the increasing number of fast-food chains and quick-service restaurants in the region is creating a significant demand for specialty commercial deep fryers in North America.
Additionally, the development of new technologies, such as smart fryers that use artificial intelligence to monitor and control the frying process, is improving the efficiency and safety of deep fryers. Also, with rising energy costs, manufacturers are developing fryers that use less oil, reducing energy consumption and operating costs. These factors are anticipated to boost the regional market growth in the near future.
Moreover, the adoption of automation and digitization in the foodservice industry is creating new growth opportunities for the regional market. Moreover, increasing demand for convenience and time-saving cooking equipment is another factor that is likely to escalate the regional market growth.
Increasing Concerns for Food Quality & Safety in the Region to Fuel the Market Growth
The specialty commercial deep fryers market in Asia Pacific is expected to accumulate the highest market share of 25.0% in 2025. As disposable income increases in Asia Pacific, people are more likely to dine out and indulge in fried food products, which is driving the demand for specialty commercial deep fryers in the region. In addition, the popularity of food trucks is on the rise in Asia Pacific, which is creating new growth opportunities for the regional market.
Furthermore, with growing concerns about food quality and safety, foodservice establishments are investing in high-quality cooking equipment, such as specialty commercial deep fryers, to ensure that they can deliver safe and delicious food to their customers.
The hospitality industry, which includes hotels, resorts, and catering companies, is expanding in the Asia Pacific, which is driving regional market prospects. These establishments require high-capacity fryers to meet the demands of their customers, and specialty commercial deep fryers offer a convenient and efficient solution.
Electric Segment to beat Competition in Untiring Market
On the basis of fuel type, the market is dominated by Electric segment, which is expected to hold a CAGR of 6.6% over the analysis period. The electric fryers are easy to operate, maintain, and clean, making them an attractive option for foodservice establishments of all sizes. The electric segment is also expected to witness growth due to the increasing availability of compact and portable electric fryers, which are ideal for small restaurants, food trucks, and home kitchens.
Furthermore, the governments in several countries are implementing regulations to reduce greenhouse gas emissions and promote energy efficiency. This has led to the development of more energy-efficient electric fryers, which are expected to drive the growth of the electric segment.
Additionally, with increasing awareness about healthy eating habits, there is a growing demand for low-fat and oil-free cooking options. Electric fryers that use air frying technology to cook food without oil are becoming increasingly popular among health-conscious consumers.
Quick-Service Restaurants Segment to Drive the Specialty Commercial Deep Fryers Market
Based on end-user, the quick-service restaurant segment is expected to expand at a 6.5% CAGR over the analysis period. Consumers in North America are increasingly turning towards quick and convenient food options, which has led to the growth of the QSRs segment. Specialty commercial deep fryers play a crucial role in QSRs as they enable fast and efficient cooking, helping these establishments meet the growing demand for quick-service food.
Moreover, the online food ordering and delivery market in North America is witnessing significant growth, creating new opportunities for QSRs. Specialty commercial deep fryers enable QSRs to prepare large volumes of fried food products quickly and efficiently, which is essential for meeting the demands of online food ordering and delivery customers.
QSRs are under constant pressure to reduce operational costs and increase efficiency. Specialty commercial deep fryers offer a cost-effective and energy-efficient solution for frying food products, which is driving their adoption in QSRs. Additionally, the QSRs market in North America is expanding, with new players entering the market and existing players expanding their operations. This is driving the demand for high-capacity cooking equipment, such as specialty commercial deep fryers, in the QSRs segment.
Specialty Commercial Deep Fryers Market startup players are adopting various marketing strategies such as new product launches, geographical expansion, merger and acquisitions, partnerships and collaboration to identify the interest of potential patients and create a larger customer base. For instance,
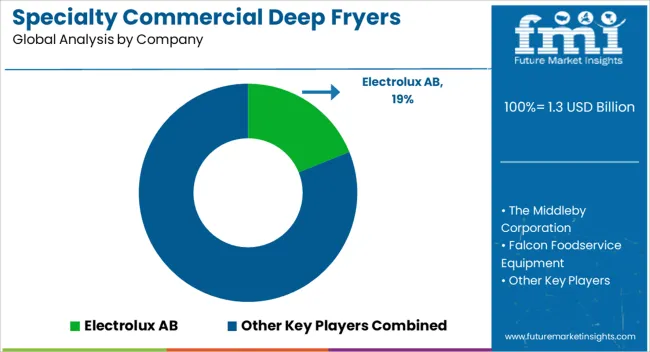
Prominent players in the specialty commercial deep fryers market are Electrolux AB, The Middleby Corporation, Falcon Foodservice Equipment, Illinois Tool Works Inc., Guangdong Rongsheng Electric Holding Co. Ltd., Standex International Corporation, Avantco Equipment, De’Longhi S.p.A., WinCo Foods, Inc., National Presto Industries, Hatco Corporation, and Frymaster, among others.
Recent Developments:
The global specialty commercial deep fryers market is estimated to be valued at USD 1.3 billion in 2025.
The market size for the specialty commercial deep fryers market is projected to reach USD 2.5 billion by 2035.
The specialty commercial deep fryers market is expected to grow at a 6.8% CAGR between 2025 and 2035.
The key product types in specialty commercial deep fryers market are natural gas, liquid propane and electric.
In terms of heat distribution, tubes & baffles segment to command 42.7% share in the specialty commercial deep fryers market in 2025.


Our Research Products

The "Full Research Suite" delivers actionable market intel, deep dives on markets or technologies, so clients act faster, cut risk, and unlock growth.

The Leaderboard benchmarks and ranks top vendors, classifying them as Established Leaders, Leading Challengers, or Disruptors & Challengers.

Locates where complements amplify value and substitutes erode it, forecasting net impact by horizon

We deliver granular, decision-grade intel: market sizing, 5-year forecasts, pricing, adoption, usage, revenue, and operational KPIs—plus competitor tracking, regulation, and value chains—across 60 countries broadly.

Spot the shifts before they hit your P&L. We track inflection points, adoption curves, pricing moves, and ecosystem plays to show where demand is heading, why it is changing, and what to do next across high-growth markets and disruptive tech

Real-time reads of user behavior. We track shifting priorities, perceptions of today’s and next-gen services, and provider experience, then pace how fast tech moves from trial to adoption, blending buyer, consumer, and channel inputs with social signals (#WhySwitch, #UX).

Partner with our analyst team to build a custom report designed around your business priorities. From analysing market trends to assessing competitors or crafting bespoke datasets, we tailor insights to your needs.
Supplier Intelligence
Discovery & Profiling
Capacity & Footprint
Performance & Risk
Compliance & Governance
Commercial Readiness
Who Supplies Whom
Scorecards & Shortlists
Playbooks & Docs
Category Intelligence
Definition & Scope
Demand & Use Cases
Cost Drivers
Market Structure
Supply Chain Map
Trade & Policy
Operating Norms
Deliverables
Buyer Intelligence
Account Basics
Spend & Scope
Procurement Model
Vendor Requirements
Terms & Policies
Entry Strategy
Pain Points & Triggers
Outputs
Pricing Analysis
Benchmarks
Trends
Should-Cost
Indexation
Landed Cost
Commercial Terms
Deliverables
Brand Analysis
Positioning & Value Prop
Share & Presence
Customer Evidence
Go-to-Market
Digital & Reputation
Compliance & Trust
KPIs & Gaps
Outputs
Full Research Suite comprises of:
Market outlook & trends analysis
Interviews & case studies
Strategic recommendations
Vendor profiles & capabilities analysis
5-year forecasts
8 regions and 60+ country-level data splits
Market segment data splits
12 months of continuous data updates
DELIVERED AS:
PDF EXCEL ONLINE
Specialty Film Market Size and Share Forecast Outlook 2025 to 2035
Specialty Silica Market Size and Share Forecast Outlook 2025 to 2035
Specialty Food Ingredients Market Size and Share Forecast Outlook 2025 to 2035
Specialty Polymers Market Size and Share Forecast Outlook 2025 to 2035
Specialty Tapes Market Size and Share Forecast Outlook 2025 to 2035
Specialty Fertilizers Market Size and Share Forecast Outlook 2025 to 2035
Specialty Coatings Market Size and Share Forecast Outlook 2025 to 2035
Specialty Transformer Market Size and Share Forecast Outlook 2025 to 2035
Specialty Chemicals Market Size and Share Forecast Outlook 2025 to 2035
Specialty Nitriles Market Size and Share Forecast Outlook 2025 to 2035
Specialty Fuel Additives Market Size and Share Forecast Outlook 2025 to 2035
Specialty Cultures Market Analysis - Size, Share and Forecast Outlook 2025 to 2035
Specialty Shortenings Market Size and Share Forecast Outlook 2025 to 2035
Specialty Labels Packaging Market Size and Share Forecast Outlook 2025 to 2035
Specialty Carbon Black Market Size and Share Forecast Outlook 2025 to 2035
Specialty Lighting Market Size and Share Forecast Outlook 2025 to 2035
Specialty Amino Acids Market Size and Share Forecast Outlook 2025 to 2035
Specialty Pulp & Paper Chemicals Market Size, Share & Forecast 2025 to 2035
Specialty Yeast Market Analysis - Size, Growth, and Forecast 2025 to 2035
Specialty Oils Market Size, Growth, and Forecast 2025 to 2035

Thank you!
You will receive an email from our Business Development Manager. Please be sure to check your SPAM/JUNK folder too.
Chat With
MaRIA