Soybean Meal Market Size and Share Forecast Outlook 2025 to 2035

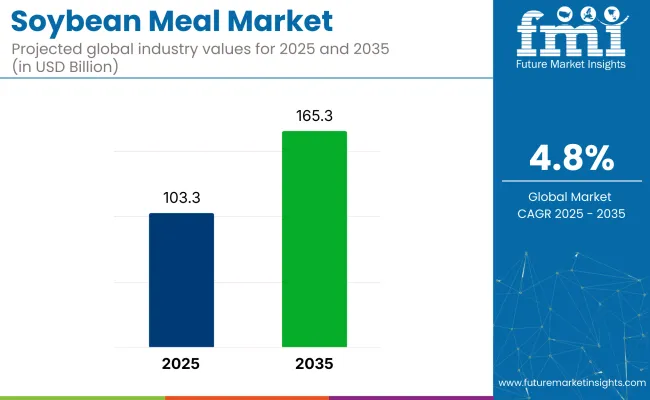
The global soybean meal market is projected to grow from USD 103.3 billion in 2025 to USD 165.3 billion by 2035, registering a CAGR of 4.8%. The market expansion is being driven by the increasing demand for protein-rich animal feed and the rising popularity of plant-based diets.
Quick Stats soybean meal market

  • Market Value (2025): USD 103.3 billion
  • Forecast Value (2035): USD 165.3 billion
  • Forecast CAGR: 4.8%
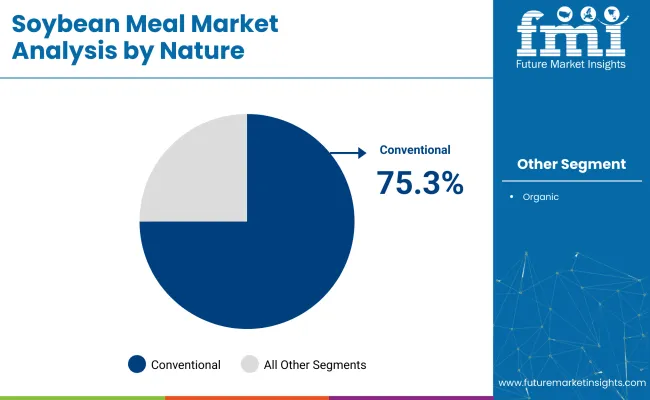
  • Nature Leader in 2025: Conventional (75.3% market share)
  • Top Application Segment: Feed (48% share)
  • Key Growth Region: East Asia (Japan is the fastest-growing market with a 5.5% CAGR)
Metric Value
Industry Size (2025E) USD 103.3 billion
Industry Value (2035F) USD 165.3 billion
CAGR (2025 to 2035) 4.8%

The growing livestock and poultry industries, coupled with a shift towards sustainable and plant-based proteins, are encouraging wider adoption of soybean meal. Advanced extraction techniques and the increasing use of non-GMO and organic soybean meal products are further boosting market growth.

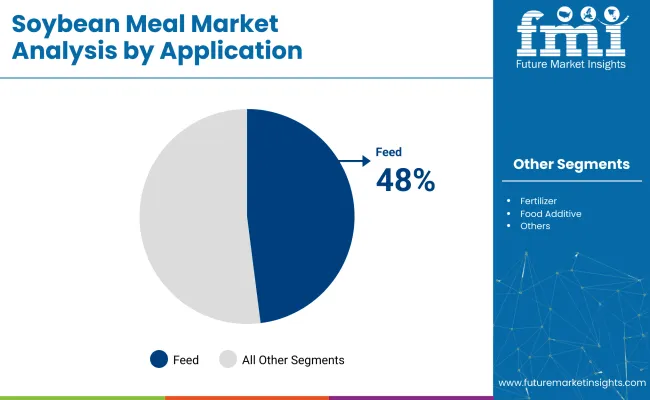
The market holds significant shares in several parent markets. Within the agricultural products market, soybean meal is a major component of global agricultural trade, although its market share varies by region. In the animal feed market, soybean meal is particularly dominant, holding around 48% of the market, primarily for use in dairy, poultry, and swine feeds.

In the food and beverage market, it accounts for a smaller share, approximately 6-7%, due to its use in plant-based food products and supplements. Additionally, in the biofuels market, soybean meal plays a vital role in biodiesel production, contributing about 5% to this sector. These percentages highlight soybean meal’s widespread use across various industries.

Government regulations impacting the market focus on sustainable agriculture, food safety, and environmental concerns. The European Union’s Common Agricultural Policy (CAP) and the USA Renewable Fuel Standard (RFS) mandate the use of biofuels, encouraging the use of soybean meal in biodiesel production.

The Indian Government's initiatives for organic farming and the promotion of plant-based food products are also contributing to the increased adoption of soybean meal. These regulations are driving the growth of advanced soybean extraction methods and encouraging the development of non-GMO and sustainable soy products, enhancing both market growth and product innovation.

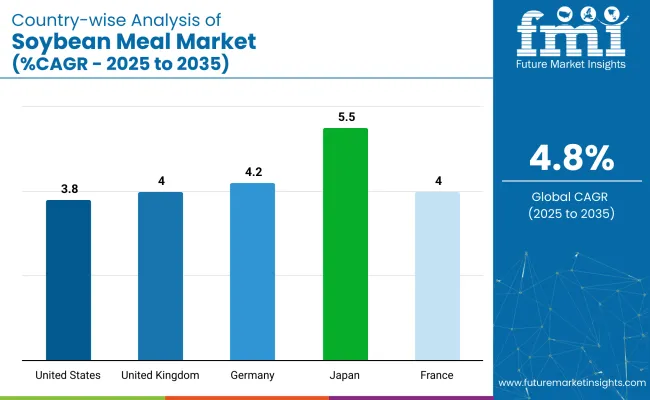
Japan is projected to be the fastest-growing soybean meal market, expanding at a CAGR of 5.5% from 2025 to 2035. Feed will lead the application segment with a 48% share, while conventional soybean meal will dominate the nature segment with 75.3% share. Defatted soybean meal is expected to command 45% of the product type segment. The USA and Germany markets are also projected to grow steadily at CAGRs of 3.8% and 4.2%, respectively.

Soybean Meal Market Analysis by Top Investment Segments

The soybean meal market is segmented by product type, application, nature, and region. By product type, the market is divided into full-fat soybean meal, defatted soybean meal, and high-protein types. In terms of application, the market is classified into feed (aquaculture, livestock, and pet food), fertilizer, food additive, and others(biofuels, industrial chemicals, animal supplements, organic fertilizers).

Based on nature, the market is bifurcated into organic and conventional. Regionally, the market is segmented into North America, Latin America, Europe, East Asia, South Asia, Oceania, and the Middle East & Africa.

Defatted Soybean Meal to Lead the Product Type Segment with 45% Market Share

Defatted soybean meal is projected to lead the product type segment, capturing 45% of the market share by 2025. These units are primarily used in animal feed due to their high protein content and low-fat concentration.

  • Defatted soybean meal is widely preferred in animal feed due to its higher protein content, which makes it a cost-effective and efficient source of nutrition.
  • The growing demand for high-protein animal feed and plant-based food products will continue to drive the growth of this segment.

Feed to Lead the Application Segment with 48% Market Share

Feed is expected to dominate the application segment, capturing 48% of the global market share by 2025, driven by its widespread use in livestock, poultry, and aquaculture feed.
  • Soybean meal is a key ingredient in animal feed, especially for livestock, poultry, and aquaculture.
  • The rise in global meat consumption, along with the growing pet food market, will further boost the demand for soybean meal in this application segment.

Conventionalto Lead the Nature Segment with 75.3% Market Share

Conventionalis expected to lead the nature segment, holding 75.3% of the market share by 2025, driven by increasing demand for sustainable and natural food and feed ingredients.
  • The increasing consumer preference for organic products, coupled with rising awareness about sustainable farming practices, is expected to drive growth in this segment.
  • Organic soybean meal is gaining traction in both animal feed and plant-based food industries.

Top Soybean Meal Market Dynamics

The global soybean meal market is experiencing steady growth, driven by the increasing demand for protein-rich feed and plant-based food solutions. Soybean meal plays a crucial role in animal nutrition, especially in livestock, poultry, and aquaculture industries.

Recent Trends in the Soybean Meal Market

  • The rising popularity of plant-based diets and vegan food products is driving the demand for soybean meal as a key protein source in food applications.
  • Technological advancements in extraction methods are improving the efficiency and quality of soybean meal, leading to better product offerings.

Challenges in the Soybean Meal Market

  • Variability in soybean crop production, influenced by weather conditions and climate change, can lead to price fluctuations and supply shortages.
  • The emergence of alternative protein sources, such as insect-based or synthetic proteins, is creating competition for soybean meal in animal feed and food applications.

Top Countries Manufacturing, Processing, Regulating, and Generating Demand for Soybean Meal

Japan's momentum is anchored in high-efficiency livestock farming, sustainable food production, and alignment with environmental targets. Germany and France maintain consistent demand driven by EU agricultural mandates and sustainability goals under the Green Deal. In contrast, developed economies such as the USA (3.8% CAGR), UK (4%), and Japan (5.5%) are expanding at a steady 0.91-1.00x of the global growth rate.

Japan leads the market with the highest growth, driven by increasing demand for plant-based protein in food and animal feed sectors. Germany follows, supported by EU sustainability and food security regulations, focusing on non-GMO and organic products. France experiences similar growth, driven by national agricultural sustainability goals and biofuel production.

The USA shows steady growth, primarily due to improvements in feed formulations and plant-based food production. The UK grows with a focus on sustainable farming and plant-based food solutions, supported by government-led initiatives for food security and sustainability.

The report covers an in-depth analysis of 40+ countries; five top-performing OECD countries are highlighted below. 

In-depth Analysis of Soybean Meal Demand in Japan

The Japan soybean meal revenue is projected to grow at a CAGR of 5.5% from 2025 to 2035. Growth is driven by the increasing demand for plant-based protein in food and animal feed sectors. As a technology-driven OECD economy, Japan prioritizes high-efficiency, sustainable farming practices integrated into its agricultural systems.

  • High demand for plant-based feed in aquaculture, livestock, and poultry sectors
  • Preference for non-GMO, organic soybean meal for animal feed and food products

Growth Outlook for Soybean Meal in Germany

The sales of soybean meal in Germany are poised to expand at a 4.2% CAGR during the forecast period, slightly below the global average but strongly regulation-led. EU carbon-neutral goals, sustainable agriculture standards, and food security regulations are pushing the adoption of plant-based feed ingredients like soybean meal.

  • Strong EU sustainability and food security mandates for livestock feed
  • High adoption of organic and non-GMO soybean meal

Analyzing Soybean Meal Demand Dynamics in France

The French soybean meal market is projected to grow at a 4% CAGR during the forecast period, mirroring Germany’s policy-backed adoption trajectory. Demand is driven by national agricultural sustainability targets, plant-based food product growth, and biofuel production. Agriculture sectors such as livestock, poultry, and aquaculture are major consumers.

  • High demand for organic and non-GMO soybean meal in livestock and poultry feed
  • Focus on sustainability in agriculture and biofuel production

Demand Trajectory for Soybean Meal in the USA

The USA soybean meal market is projected to grow at a 3.8% CAGR from 2025 to 2035, translating to 0.93x the global rate. Unlike emerging markets focused on new installations, USA demand is tied to improving feed formulations, increasing plant-based food production, and meeting sustainable farming standards.

  • Strong demand for plant-based food and animal feed
  • Increasing use of non-GMO and organic soybean meal

Soybean Meal Trends in the UK

The UK soybean meal revenue is projected to grow at a 4% CAGR from 2025 to 2035, representing steady growth, at 0.91 times the global pace. Growth is supported by workplace regulations in industries like food processing, livestock, and plant-based food production. Post-Brexit regulatory divergence has slightly slowed capital investment.

  • Focus on sustainable farming and plant-based food production
  • Increased demand for non-GMO and organic soybean meal in agriculture

Leading Soybean Meal Suppliers and Manufacturers

The soybean meal market is moderately consolidated, with leading players like UFAC-UK, The United Soybean Board (USB), Satavie, SoyKitty, and Afrizon Pte Ltd. dominating the industry. These companies provide high-quality soybean meal catering to sectors such as animal feed, plant-based food, and biofuel production. UFAC-UK focuses on high-protein soybean meal, while The United Soybean Board (USB) specializes in sustainable soybean farming and meal production solutions.

Satavie is known for its innovative plant-based meal formulations, and SoyKitty offers specialized meal products for pet food. Afrizon Pte Ltd. focuses on sustainable sourcing practices. Other key players like Mamta Hygiene Products Pvt Ltd, Guru Soya Foods Pvt. Ltd., Delta Equities LLC, Prorich Agro Private Limited, and The Delong Co., Inc. contribute by providing specialized, high-performance soybean meal solutions for a wide range of industrial and agricultural applications.

Recent Soybean Meal Industry News

  • In July 2025, UFAC introduced Envirolac, a palm-free fat supplement formulated for high-yield dairy farms. Made from locally sourced oils, it improves cow health and fertility, validated by field trials and academic research.

Soybean Meal Market Report Scope

Report Attributes Details
Market Size (2025) USD 103.3 billion
Projected Market Size (2035) USD 165.3 billion
CAGR (2025 to 2035) 4.8%
Base Year for Estimation 2024
Historical Period 2020 to 2024
Projections Period 2025 to 2035
Report Parameter USD billion for value/volume in metric tons
Product Type Analyzed Full-fat Soybean Meal, Defatted Soybean Meal, and High-protein Types
Application Analyzed Feed (Aquaculture, Livestock, Pet Food), Fertilizer, Food Additive, and Others ( Biofuels, Industrial Chemicals, Animal Supplements, Organic Fertilizers ) .
Nature Analyzed Organic and Conventional
Region Covered North America, Latin America, Western Europe, South Asia, East Asia, Oceania, and Middle East & Africa
Countries Covered United States, United Kingdom, Germany, France, Japan, China, India, Brazil, South Korea, Australia
Key Players Influencing the Market UFAC-UK, The United Soybean Board (USB), Satavie, SoyKitty, Afrizon Pte Ltd., Mamta Hygiene Products Pvt Ltd, Guru Soya Foods Pvt. Ltd., Delta Equities LLC, Prorich Agro Private Limited, The Delong Co., Inc.
Additional Attributes Dollar sales by product type, share by nature, regional demand growth, policy influence, sustainability trends, competitive benchmarking

Key Segments

By Product Type:

  • Full-fat Soybean Meal
  • Defatted Soybean Meal
  • High-protein Types

By Nature:

  • Organic
  • Conventional

By Application:

  • Feed
    • Aquaculture
    • Livestock
    • Pet Food
  • Fertilizer
  • Food Additive
  • Others

By Region:

  • North America
  • Latin America
  • Europe
  • East Asia
  • South Asia
  • Middle East and Africa

Table of Content

  1. Executive Summary
    • Global Market Outlook
    • Demand-side Trends
    • Supply-side Trends
    • Technology Roadmap Analysis
    • Analysis and Recommendations
  2. Market Overview
    • Market Coverage / Taxonomy
    • Market Definition / Scope / Limitations
  3. Market Background
    • Market Dynamics
      • Drivers
      • Restraints
      • Opportunity
      • Trends
    • Scenario Forecast
      • Demand in Optimistic Scenario
      • Demand in Likely Scenario
      • Demand in Conservative Scenario
    • Opportunity Map Analysis
    • Product Life Cycle Analysis
    • Supply Chain Analysis
      • Supply Side Participants and their Roles
        • Producers
        • Mid-Level Participants (Traders/ Agents/ Brokers)
        • Wholesalers and Distributors
      • Value Added and Value Created at Node in the Supply Chain
      • List of Raw Material Suppliers
      • List of Existing and Potential Buyer’s
    • Investment Feasibility Matrix
    • Value Chain Analysis
      • Profit Margin Analysis
      • Wholesalers and Distributors
      • Retailers
    • PESTLE and Porter’s Analysis
    • Regulatory Landscape
      • By Key Regions
      • By Key Countries
    • Regional Parent Market Outlook
    • Production and Consumption Statistics
    • Import and Export Statistics
  4. Global Market Analysis 2020-2024 and Forecast, 2025-2035
    • Historical Market Size Value (USD Billion) & Volume (Metric Tons) Analysis, 2020-2024
    • Current and Future Market Size Value (USD Billion) & Volume (Metric Tons) Projections, 2025-2035
      • Y-o-Y Growth Trend Analysis
      • Absolute $ Opportunity Analysis
  5. Global Market Pricing Analysis 2020-2024 and Forecast 2025-2035
  6. Global Market Analysis 2020-2024 and Forecast 2025-2035, By Product Type
    • Introduction / Key Findings
    • Historical Market Size Value (USD Billion) & Volume (Metric Tons) Analysis By Product Type, 2020-2024
    • Current and Future Market Size Value (USD Billion) & Volume (Metric Tons) Analysis and Forecast By Product Type, 2025-2035
      • Full-fat Soybean Meal
      • Defatted Soybean Meal
      • High-protein Types
    • Y-o-Y Growth Trend Analysis By Product Type, 2020-2024
    • Absolute $ Opportunity Analysis By Product Type, 2025-2035
  7. Global Market Analysis 2020-2024 and Forecast 2025-2035, By Application
    • Introduction / Key Findings
    • Historical Market Size Value (USD Billion) & Volume (Metric Tons) Analysis By Application, 2020-2024
    • Current and Future Market Size Value (USD Billion) & Volume (Metric Tons) Analysis and Forecast By Application, 2025-2035
      • Feed
        • Aquaculture
        • Livestock
        • Pet Food
      • Fertilizer
      • Food Additive
      • Others (Biofuels, Industrial Chemicals, Animal Supplements, Organic Fertilizers).
    • Y-o-Y Growth Trend Analysis By Application, 2020-2024
    • Absolute $ Opportunity Analysis By Application, 2025-2035
  8. Global Market Analysis 2020-2024 and Forecast 2025-2035, By Nature
    • Introduction / Key Findings
    • Historical Market Size Value (USD Billion) & Volume (Metric Tons) Analysis By Nature, 2020-2024
    • Current and Future Market Size Value (USD Billion) & Volume (Metric Tons) Analysis and Forecast By Nature, 2025-2035
      • Organic
      • Conventional
    • Y-o-Y Growth Trend Analysis By Nature, 2020-2024
    • Absolute $ Opportunity Analysis By Nature, 2025-2035
  9. Global Market Analysis 2020-2024 and Forecast 2025-2035, By Region
    • Introduction
    • Historical Market Size Value (USD Billion) & Volume (Metric Tons) Analysis By Region, 2020-2024
    • Current Market Size Value (USD Billion) & Volume (Metric Tons) Analysis and Forecast By Region, 2025-2035
      • North America
      • Latin America
      • Western Europe
      • Eastern Europe
      • East Asia
      • South Asia & Pacific
      • Middle East and Africa
    • Market Attractiveness Analysis By Region
  10. North America Market Analysis 2020-2024 and Forecast 2025-2035, By Country
    • Historical Market Size Value (USD Billion) & Volume (Metric Tons) Trend Analysis By Market Taxonomy, 2020-2024
    • Market Size Value (USD Billion) & Volume (Metric Tons) Forecast By Market Taxonomy, 2025-2035
      • By Country
        • USA
        • Canada
        • Mexico
      • By Product Type
      • By Application
      • By Nature
    • Market Attractiveness Analysis
      • By Country
      • By Product Type
      • By Application
      • By Nature
    • Key Takeaways
  11. Latin America Market Analysis 2020-2024 and Forecast 2025-2035, By Country
    • Historical Market Size Value (USD Billion) & Volume (Metric Tons) Trend Analysis By Market Taxonomy, 2020-2024
    • Market Size Value (USD Billion) & Volume (Metric Tons) Forecast By Market Taxonomy, 2025-2035
      • By Country
        • Brazil
        • Argentina
        • Rest of LATAM
      • By Product Type
      • By Application
      • By Nature
    • Market Attractiveness Analysis
      • By Country
      • By Product Type
      • By Application
      • By Nature
    • Key Takeaways
  12. Western Europe Market Analysis 2020-2024 and Forecast 2025-2035, By Country
    • Historical Market Size Value (USD Billion) & Volume (Metric Tons) Trend Analysis By Market Taxonomy, 2020-2024
    • Market Size Value (USD Billion) & Volume (Metric Tons) Forecast By Market Taxonomy, 2025-2035
      • By Country
        • Germany
        • Italy
        • France
        • UK
        • Spain
        • BENELUX
        • Nordic
        • Rest of W.Europe
      • By Product Type
      • By Application
      • By Nature
    • Market Attractiveness Analysis
      • By Country
      • By Product Type
      • By Application
      • By Nature
    • Key Takeaways
  13. Eastern Europe Market Analysis 2020-2024 and Forecast 2025-2035, By Country
    • Historical Market Size Value (USD Billion) & Volume (Metric Tons) Trend Analysis By Market Taxonomy, 2020-2024
    • Market Size Value (USD Billion) & Volume (Metric Tons) Forecast By Market Taxonomy, 2025-2035
      • By Country
        • Russia
        • Hungary
        • Poland
        • Balkan & Baltics
        • Rest of E. Europe
      • By Product Type
      • By Application
      • By Nature
    • Market Attractiveness Analysis
      • By Country
      • By Product Type
      • By Application
      • By Nature
    • Key Takeaways
  14. East Asia Market Analysis 2020-2024 and Forecast 2025-2035, By Country
    • Historical Market Size Value (USD Billion) & Volume (Metric Tons) Trend Analysis By Market Taxonomy, 2020-2024
    • Market Size Value (USD Billion) & Volume (Metric Tons) Forecast By Market Taxonomy, 2025-2035
      • By Country
        • China
        • Japan
        • South Korea
      • By Product Type
      • By Application
      • By Nature
    • Market Attractiveness Analysis
      • By Country
      • By Product Type
      • By Application
      • By Nature
    • Key Takeaways
  15. South Asia & Pacific Market Analysis 2020-2024 and Forecast 2025-2035, By Country
    • Historical Market Size Value (USD Billion) & Volume (Metric Tons) Trend Analysis By Market Taxonomy, 2020-2024
    • Market Size Value (USD Billion) & Volume (Metric Tons) Forecast By Market Taxonomy, 2025-2035
      • By Country
        • India
        • Australia & New Zealand
        • ASEAN
        • Rest of SAP
      • By Product Type
      • By Application
      • By Nature
    • Market Attractiveness Analysis
      • By Country
      • By Product Type
      • By Application
      • By Nature
    • Key Takeaways
  16. Middle East and Africa Market Analysis 2020-2024 and Forecast 2025-2035, By Country
    • Historical Market Size Value (USD Billion) & Volume (Metric Tons) Trend Analysis By Market Taxonomy, 2020-2024
    • Market Size Value (USD Billion) & Volume (Metric Tons) Forecast By Market Taxonomy, 2025-2035
      • By Country
        • GCC Countries
        • Northern Africa
        • South Africa
        • Turkiye
        • Rest of MEA
      • By Product Type
      • By Application
      • By Nature
    • Market Attractiveness Analysis
      • By Country
      • By Product Type
      • By Application
      • By Nature
    • Key Takeaways
  17. Key Countries Market Analysis
    • USA
      • Pricing Analysis
      • Market Share Analysis, 2024
        • By Product Type
        • By Application
        • By Nature
    • Canada
      • Pricing Analysis
      • Market Share Analysis, 2024
        • By Product Type
        • By Application
        • By Nature
    • Brazil
      • Pricing Analysis
      • Market Share Analysis, 2024
        • By Product Type
        • By Application
        • By Nature
    • Mexico
      • Pricing Analysis
      • Market Share Analysis, 2024
        • By Product Type
        • By Application
        • By Nature
    • Argentina
      • Pricing Analysis
      • Market Share Analysis, 2024
        • By Product Type
        • By Application
        • By Nature
  18. Market Structure Analysis
    • Competition Dashboard
    • Competition Benchmarking
    • Market Share Analysis of Top Players
      • By Regional
      • By Product Type
      • By Application
      • By Nature
  19. Competition Analysis
    • Competition Deep Dive
      • UFAC-UK
        • Overview
        • Product Portfolio
        • Profitability by Market Segments (Product/Age /Sales Channel/Region)
        • Sales Footprint
        • Strategy Overview
          • Marketing Strategy
          • Product Strategy
          • Channel Strategy
      • The Value (USD Billion) & Volume (Metric Tons)ed Soybean Board (USB)
        • Overview
        • Product Portfolio
        • Profitability by Market Segments (Product/Age /Sales Channel/Region)
        • Sales Footprint
        • Strategy Overview
          • Marketing Strategy
          • Product Strategy
          • Channel Strategy
      • Satavie
        • Overview
        • Product Portfolio
        • Profitability by Market Segments (Product/Age /Sales Channel/Region)
        • Sales Footprint
        • Strategy Overview
          • Marketing Strategy
          • Product Strategy
          • Channel Strategy
      • SoyKitty
        • Overview
        • Product Portfolio
        • Profitability by Market Segments (Product/Age /Sales Channel/Region)
        • Sales Footprint
        • Strategy Overview
          • Marketing Strategy
          • Product Strategy
          • Channel Strategy
      • Afrizon Pte Ltd.
        • Overview
        • Product Portfolio
        • Profitability by Market Segments (Product/Age /Sales Channel/Region)
        • Sales Footprint
        • Strategy Overview
          • Marketing Strategy
          • Product Strategy
          • Channel Strategy
      • Mamta Hygiene Products Pvt Ltd
        • Overview
        • Product Portfolio
        • Profitability by Market Segments (Product/Age /Sales Channel/Region)
        • Sales Footprint
        • Strategy Overview
          • Marketing Strategy
          • Product Strategy
          • Channel Strategy
      • Guru Soya Foods Pvt. Ltd.
        • Overview
        • Product Portfolio
        • Profitability by Market Segments (Product/Age /Sales Channel/Region)
        • Sales Footprint
        • Strategy Overview
          • Marketing Strategy
          • Product Strategy
          • Channel Strategy
      • Delta Equities LLC
        • Overview
        • Product Portfolio
        • Profitability by Market Segments (Product/Age /Sales Channel/Region)
        • Sales Footprint
        • Strategy Overview
          • Marketing Strategy
          • Product Strategy
          • Channel Strategy
      • Prorich Agro Private Limited
        • Overview
        • Product Portfolio
        • Profitability by Market Segments (Product/Age /Sales Channel/Region)
        • Sales Footprint
        • Strategy Overview
          • Marketing Strategy
          • Product Strategy
          • Channel Strategy
      • The Delong Co., Inc.
        • Overview
        • Product Portfolio
        • Profitability by Market Segments (Product/Age /Sales Channel/Region)
        • Sales Footprint
        • Strategy Overview
          • Marketing Strategy
          • Product Strategy
          • Channel Strategy
      • Other Players (On Additional Requests)
        • Overview
        • Product Portfolio
        • Profitability by Market Segments (Product/Age /Sales Channel/Region)
        • Sales Footprint
        • Strategy Overview
          • Marketing Strategy
          • Product Strategy
          • Channel Strategy
  20. Assumptions & Acronyms Used
  21. Research Methodology

List of Tables

  • Table 1: Global Market Value (USD Billion) Forecast By Region, 2020-2035
  • Table 2: Global Market Volume (Metric Tons) Forecast By Region, 2020-2035
  • Table 3: Global Market Value (USD Billion) Forecast By Product Type, 2020-2035
  • Table 4: Global Market Volume (Metric Tons) Forecast By Product Type, 2020-2035
  • Table 5: Global Market Value (USD Billion) Forecast By Application, 2020-2035
  • Table 6: Global Market Volume (Metric Tons) Forecast By Application, 2020-2035
  • Table 7: Global Market Value (USD Billion) Forecast By Nature, 2020-2035
  • Table 8: Global Market Volume (Metric Tons) Forecast By Nature, 2020-2035
  • Table 9: North America Market Value (USD Billion) Forecast By Country, 2020-2035
  • Table 10: North America Market Volume (Metric Tons) Forecast By Country, 2020-2035
  • Table 11: North America Market Value (USD Billion) Forecast By Product Type, 2020-2035
  • Table 12: North America Market Volume (Metric Tons) Forecast By Product Type, 2020-2035
  • Table 13: North America Market Value (USD Billion) Forecast By Application, 2020-2035
  • Table 14: North America Market Volume (Metric Tons) Forecast By Application, 2020-2035
  • Table 15: North America Market Value (USD Billion) Forecast By Nature, 2020-2035
  • Table 16: North America Market Volume (Metric Tons) Forecast By Nature, 2020-2035
  • Table 17: Latin America Market Value (USD Billion) Forecast By Country, 2020-2035
  • Table 18: Latin America Market Volume (Metric Tons) Forecast By Country, 2020-2035
  • Table 19: Latin America Market Value (USD Billion) Forecast By Product Type, 2020-2035
  • Table 20: Latin America Market Volume (Metric Tons) Forecast By Product Type, 2020-2035
  • Table 21: Latin America Market Value (USD Billion) Forecast By Application, 2020-2035
  • Table 22: Latin America Market Volume (Metric Tons) Forecast By Application, 2020-2035
  • Table 23: Latin America Market Value (USD Billion) Forecast By Nature, 2020-2035
  • Table 24: Latin America Market Volume (Metric Tons) Forecast By Nature, 2020-2035
  • Table 25: Western Europe Market Value (USD Billion) Forecast By Country, 2020-2035
  • Table 26: Western Europe Market Volume (Metric Tons) Forecast By Country, 2020-2035
  • Table 27: Western Europe Market Value (USD Billion) Forecast By Product Type, 2020-2035
  • Table 28: Western Europe Market Volume (Metric Tons) Forecast By Product Type, 2020-2035
  • Table 29: Western Europe Market Value (USD Billion) Forecast By Application, 2020-2035
  • Table 30: Western Europe Market Volume (Metric Tons) Forecast By Application, 2020-2035
  • Table 31: Western Europe Market Value (USD Billion) Forecast By Nature, 2020-2035
  • Table 32: Western Europe Market Volume (Metric Tons) Forecast By Nature, 2020-2035
  • Table 33: Eastern Europe Market Value (USD Billion) Forecast By Country, 2020-2035
  • Table 34: Eastern Europe Market Volume (Metric Tons) Forecast By Country, 2020-2035
  • Table 35: Eastern Europe Market Value (USD Billion) Forecast By Product Type, 2020-2035
  • Table 36: Eastern Europe Market Volume (Metric Tons) Forecast By Product Type, 2020-2035
  • Table 37: Eastern Europe Market Value (USD Billion) Forecast By Application, 2020-2035
  • Table 38: Eastern Europe Market Volume (Metric Tons) Forecast By Application, 2020-2035
  • Table 39: Eastern Europe Market Value (USD Billion) Forecast By Nature, 2020-2035
  • Table 40: Eastern Europe Market Volume (Metric Tons) Forecast By Nature, 2020-2035
  • Table 41: East Asia Market Value (USD Billion) Forecast By Country, 2020-2035
  • Table 42: East Asia Market Volume (Metric Tons) Forecast By Country, 2020-2035
  • Table 43: East Asia Market Value (USD Billion) Forecast By Product Type, 2020-2035
  • Table 44: East Asia Market Volume (Metric Tons) Forecast By Product Type, 2020-2035
  • Table 45: East Asia Market Value (USD Billion) Forecast By Application, 2020-2035
  • Table 46: East Asia Market Volume (Metric Tons) Forecast By Application, 2020-2035
  • Table 47: East Asia Market Value (USD Billion) Forecast By Nature, 2020-2035
  • Table 48: East Asia Market Volume (Metric Tons) Forecast By Nature, 2020-2035
  • Table 49: South Asia & Pacific Market Value (USD Billion) Forecast By Country, 2020-2035
  • Table 50: South Asia & Pacific Market Volume (Metric Tons) Forecast By Country, 2020-2035
  • Table 51: South Asia & Pacific Market Value (USD Billion) Forecast By Product Type, 2020-2035
  • Table 52: South Asia & Pacific Market Volume (Metric Tons) Forecast By Product Type, 2020-2035
  • Table 53: South Asia & Pacific Market Value (USD Billion) Forecast By Application, 2020-2035
  • Table 54: South Asia & Pacific Market Volume (Metric Tons) Forecast By Application, 2020-2035
  • Table 55: South Asia & Pacific Market Value (USD Billion) Forecast By Nature, 2020-2035
  • Table 56: South Asia & Pacific Market Volume (Metric Tons) Forecast By Nature, 2020-2035
  • Table 57: Middle East and Africa Market Value (USD Billion) Forecast By Country, 2020-2035
  • Table 58: Middle East and Africa Market Volume (Metric Tons) Forecast By Country, 2020-2035
  • Table 59: Middle East and Africa Market Value (USD Billion) Forecast By Product Type, 2020-2035
  • Table 60: Middle East and Africa Market Volume (Metric Tons) Forecast By Product Type, 2020-2035
  • Table 61: Middle East and Africa Market Value (USD Billion) Forecast By Application, 2020-2035
  • Table 62: Middle East and Africa Market Volume (Metric Tons) Forecast By Application, 2020-2035
  • Table 63: Middle East and Africa Market Value (USD Billion) Forecast By Nature, 2020-2035
  • Table 64: Middle East and Africa Market Volume (Metric Tons) Forecast By Nature, 2020-2035

List of Figures

  • Figure 1: Global Market Volume (Metric Tons) Forecast 2020-2035
  • Figure 2: Global Market Pricing Analysis
  • Figure 3: Global Market Value (USD Billion) Forecast 2020-2035
  • Figure 4: Global Market Value Share and BPS Analysis By Product Type, 2025 and 2035
  • Figure 5: Global Market Y-o-Y Growth Comparison By Product Type, 2025-2035
  • Figure 6: Global Market Attractiveness Analysis By Product Type
  • Figure 7: Global Market Value Share and BPS Analysis By Application, 2025 and 2035
  • Figure 8: Global Market Y-o-Y Growth Comparison By Application, 2025-2035
  • Figure 9: Global Market Attractiveness Analysis By Application
  • Figure 10: Global Market Value Share and BPS Analysis By Nature, 2025 and 2035
  • Figure 11: Global Market Y-o-Y Growth Comparison By Nature, 2025-2035
  • Figure 12: Global Market Attractiveness Analysis By Nature
  • Figure 13: Global Market Value (USD Billion) Share and BPS Analysis By Region, 2025 and 2035
  • Figure 14: Global Market Y-o-Y Growth Comparison By Region, 2025-2035
  • Figure 15: Global Market Attractiveness Analysis By Region
  • Figure 16: North America Market Incremental $ Opportunity, 2025-2035
  • Figure 17: Latin America Market Incremental $ Opportunity, 2025-2035
  • Figure 18: Western Europe Market Incremental $ Opportunity, 2025-2035
  • Figure 19: Eastern Europe Market Incremental $ Opportunity, 2025-2035
  • Figure 20: East Asia Market Incremental $ Opportunity, 2025-2035
  • Figure 21: South Asia & Pacific Market Incremental $ Opportunity, 2025-2035
  • Figure 22: Middle East and Africa Market Incremental $ Opportunity, 2025-2035
  • Figure 23: North America Market Value Share and BPS Analysis By Country, 2025 and 2035
  • Figure 24: North America Market Value Share and BPS Analysis By Product Type, 2025 and 2035
  • Figure 25: North America Market Y-o-Y Growth Comparison By Product Type, 2025-2035
  • Figure 26: North America Market Attractiveness Analysis By Product Type
  • Figure 27: North America Market Value Share and BPS Analysis By Application, 2025 and 2035
  • Figure 28: North America Market Y-o-Y Growth Comparison By Application, 2025-2035
  • Figure 29: North America Market Attractiveness Analysis By Application
  • Figure 30: North America Market Value Share and BPS Analysis By Nature, 2025 and 2035
  • Figure 31: North America Market Y-o-Y Growth Comparison By Nature, 2025-2035
  • Figure 32: North America Market Attractiveness Analysis By Nature
  • Figure 33: Latin America Market Value Share and BPS Analysis By Country, 2025 and 2035
  • Figure 34: Latin America Market Value Share and BPS Analysis By Product Type, 2025 and 2035
  • Figure 35: Latin America Market Y-o-Y Growth Comparison By Product Type, 2025-2035
  • Figure 36: Latin America Market Attractiveness Analysis By Product Type
  • Figure 37: Latin America Market Value Share and BPS Analysis By Application, 2025 and 2035
  • Figure 38: Latin America Market Y-o-Y Growth Comparison By Application, 2025-2035
  • Figure 39: Latin America Market Attractiveness Analysis By Application
  • Figure 40: Latin America Market Value Share and BPS Analysis By Nature, 2025 and 2035
  • Figure 41: Latin America Market Y-o-Y Growth Comparison By Nature, 2025-2035
  • Figure 42: Latin America Market Attractiveness Analysis By Nature
  • Figure 43: Western Europe Market Value Share and BPS Analysis By Country, 2025 and 2035
  • Figure 44: Western Europe Market Value Share and BPS Analysis By Product Type, 2025 and 2035
  • Figure 45: Western Europe Market Y-o-Y Growth Comparison By Product Type, 2025-2035
  • Figure 46: Western Europe Market Attractiveness Analysis By Product Type
  • Figure 47: Western Europe Market Value Share and BPS Analysis By Application, 2025 and 2035
  • Figure 48: Western Europe Market Y-o-Y Growth Comparison By Application, 2025-2035
  • Figure 49: Western Europe Market Attractiveness Analysis By Application
  • Figure 50: Western Europe Market Value Share and BPS Analysis By Nature, 2025 and 2035
  • Figure 51: Western Europe Market Y-o-Y Growth Comparison By Nature, 2025-2035
  • Figure 52: Western Europe Market Attractiveness Analysis By Nature
  • Figure 53: Eastern Europe Market Value Share and BPS Analysis By Country, 2025 and 2035
  • Figure 54: Eastern Europe Market Value Share and BPS Analysis By Product Type, 2025 and 2035
  • Figure 55: Eastern Europe Market Y-o-Y Growth Comparison By Product Type, 2025-2035
  • Figure 56: Eastern Europe Market Attractiveness Analysis By Product Type
  • Figure 57: Eastern Europe Market Value Share and BPS Analysis By Application, 2025 and 2035
  • Figure 58: Eastern Europe Market Y-o-Y Growth Comparison By Application, 2025-2035
  • Figure 59: Eastern Europe Market Attractiveness Analysis By Application
  • Figure 60: Eastern Europe Market Value Share and BPS Analysis By Nature, 2025 and 2035
  • Figure 61: Eastern Europe Market Y-o-Y Growth Comparison By Nature, 2025-2035
  • Figure 62: Eastern Europe Market Attractiveness Analysis By Nature
  • Figure 63: East Asia Market Value Share and BPS Analysis By Country, 2025 and 2035
  • Figure 64: East Asia Market Value Share and BPS Analysis By Product Type, 2025 and 2035
  • Figure 65: East Asia Market Y-o-Y Growth Comparison By Product Type, 2025-2035
  • Figure 66: East Asia Market Attractiveness Analysis By Product Type
  • Figure 67: East Asia Market Value Share and BPS Analysis By Application, 2025 and 2035
  • Figure 68: East Asia Market Y-o-Y Growth Comparison By Application, 2025-2035
  • Figure 69: East Asia Market Attractiveness Analysis By Application
  • Figure 70: East Asia Market Value Share and BPS Analysis By Nature, 2025 and 2035
  • Figure 71: East Asia Market Y-o-Y Growth Comparison By Nature, 2025-2035
  • Figure 72: East Asia Market Attractiveness Analysis By Nature
  • Figure 73: South Asia & Pacific Market Value Share and BPS Analysis By Country, 2025 and 2035
  • Figure 74: South Asia & Pacific Market Value Share and BPS Analysis By Product Type, 2025 and 2035
  • Figure 75: South Asia & Pacific Market Y-o-Y Growth Comparison By Product Type, 2025-2035
  • Figure 76: South Asia & Pacific Market Attractiveness Analysis By Product Type
  • Figure 77: South Asia & Pacific Market Value Share and BPS Analysis By Application, 2025 and 2035
  • Figure 78: South Asia & Pacific Market Y-o-Y Growth Comparison By Application, 2025-2035
  • Figure 79: South Asia & Pacific Market Attractiveness Analysis By Application
  • Figure 80: South Asia & Pacific Market Value Share and BPS Analysis By Nature, 2025 and 2035
  • Figure 81: South Asia & Pacific Market Y-o-Y Growth Comparison By Nature, 2025-2035
  • Figure 82: South Asia & Pacific Market Attractiveness Analysis By Nature
  • Figure 83: Middle East and Africa Market Value Share and BPS Analysis By Country, 2025 and 2035
  • Figure 84: Middle East and Africa Market Value Share and BPS Analysis By Product Type, 2025 and 2035
  • Figure 85: Middle East and Africa Market Y-o-Y Growth Comparison By Product Type, 2025-2035
  • Figure 86: Middle East and Africa Market Attractiveness Analysis By Product Type
  • Figure 87: Middle East and Africa Market Value Share and BPS Analysis By Application, 2025 and 2035
  • Figure 88: Middle East and Africa Market Y-o-Y Growth Comparison By Application, 2025-2035
  • Figure 89: Middle East and Africa Market Attractiveness Analysis By Application
  • Figure 90: Middle East and Africa Market Value Share and BPS Analysis By Nature, 2025 and 2035
  • Figure 91: Middle East and Africa Market Y-o-Y Growth Comparison By Nature, 2025-2035
  • Figure 92: Middle East and Africa Market Attractiveness Analysis By Nature
  • Figure 93: Global Market - Tier Structure Analysis
  • Figure 94: Global Market - Company Share Analysis

Frequently Asked Questions

What is the projected size of the soybean meal market in 2025?

The market is valued at USD 103.3 billion in 2025.

What is the outlook on soybean meal demand by 2035?

The market is forecasted to reach USD 165.3 billion by 2035, reflecting a CAGR of 4.8%.

Which segment leads the soybean meal market by product type in 2025?

Defatted soybean meal will lead the product type segment, capturing 45% of the global market share in 2025.

What is the top application sector for the soybean meal market in 2025?

Feed will dominate the application segment with a 48% share in 2025.

Which country is projected to have the fastest-growing soybean meal market?

Japan is projected to grow at the fastest rate, with a CAGR of 5.5% from 2025 to 2035.

Explore Similar Insights

Future Market Insights

Soybean Meal Market