The global sodium malate market is projected to grow from USD 661.2 million in 2025 to USD 979.2 million by 2035, registering a CAGR of 4%. The market expansion is being driven by increasing demand for clean-label additives and pH regulators across the food and beverage industry.
Rising health consciousness, coupled with growing demand for low-calorie and functional beverages, is encouraging manufacturers to adopt sodium malate as a flavor enhancer and acidity regulator. Additionally, its use in cosmetics and pharmaceuticals for skin conditioning and buffering purposes is contributing to broader market adoption.
The global market holds an estimated 14% share in the global food acidulants market, reflecting its significant role as a flavor enhancer and pH regulator. Within the food additives market, it accounts for 2.5%, while in the functional food ingredients space, its share stands around 3%.
In the cosmetic ingredients market, sodium malate contributes about 1.8%, largely due to its use in skin conditioning formulations. It commands 8% in the alpha-hydroxy acids (AHA) segment, given its natural derivation and multifunctionality. However, its presence in the broader specialty chemicals market is minimal, accounting for less than 0.01%.
Regulatory frameworks impacting the market emphasize food safety, ingredient transparency, and consumer health. The United States FDA categorizes sodium malate as GRAS (Generally Recognized as Safe), while the European Food Safety Authority (EFSA) lists it under approved food additives. In India, the FSSAI regulates its use under food additive guidelines aligned with Codex Alimentarius standards. These frameworks drive the demand for high-purity, compliant formulations of sodium malate, supporting its sustained growth across global markets.
Japan is projected to be the fastest-growing market, expected to expand at a CAGR of 4.5% from 2025 to 2035. Monosodium malate will lead the product type segment with a 61% share, while the food and beverage will dominate the application segment with a 69% share. The USA, UK, Germany, and France markets are also expected to grow steadily at CAGRs of 3.2%, 3.5%, 3.8%, and 3.6%, respectively.
Food processing operations reveal persistent friction between formulation scientists advocating natural-derived acidulants for clean-label positioning and cost optimization teams managing price volatility from biologically-produced malic acid feedstock supplies. Beverage manufacturing facilities struggle coordinating between taste panel evaluations optimizing tartness profiles and production managers implementing pH control protocols that maintain microbial stability throughout extended shelf-life requirements. Quality assurance departments encounter challenges establishing consistent analytical methodologies for optical rotation testing while coordinating with suppliers providing certificates of analysis documenting stereochemical purity specifications.
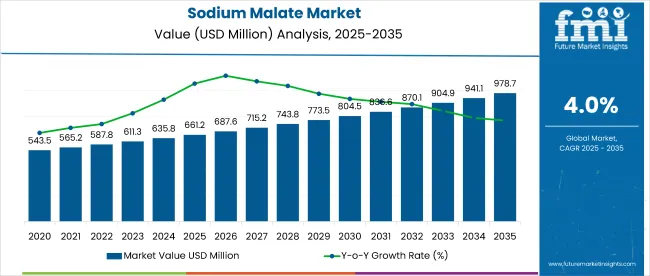
| Metric | Value |
|---|---|
| Industry Size (2025E) | USD 661.2 million |
| Industry Value (2035F) | USD 979.2 million |
| CAGR (2025 to 2035) | 4% |
The sodium malate market is segmented by type, application, and region. By type, the market is bifurcated into monosodium malate and disodium malate. In terms of application, the market is classified into food and beverages, personal care, cosmetics, and animal feed. Regionally, the market is segmented into North America, Latin America, Europe, East Asia, South Asia, Oceania, and the Middle East & Africa.
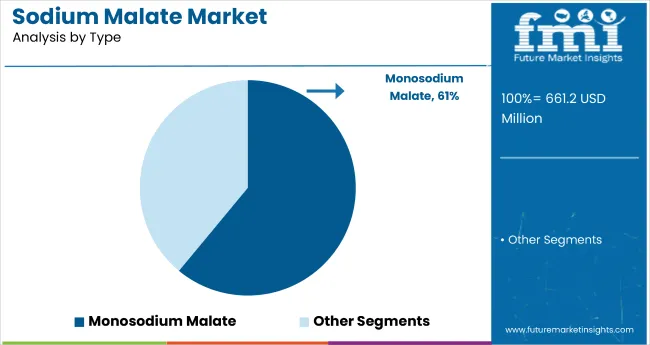
Monosodium malate is expected to dominate the type segment with a 61% market share by 2025, driven by its widespread use in food and beverage products as an effective acidity regulator and flavor enhancer. Its compatibility with clean-label formulations and regulatory approvals across major markets further support its extensive application in processed and packaged food sectors.
Food and beverage are projected to lead the application category, holding 69% of the global market share by 2025, driven by their extensive use as a flavor enhancer and pH regulator across various products. Rising demand for processed foods, clean-label ingredients, and shelf-stable formulations further accelerates their adoption across sauces, beverages, snacks, and ready-to-eat meals.
The global sodium malate market is experiencing steady growth, driven by rising demand for natural food additives and pH regulators across the food, beverage, and personal care industries. Sodium malate plays a crucial role in enhancing flavor profiles and maintaining product stability, while supporting clean-label trends and regulatory compliance.
Recent Trends in the Sodium Malate Market
Challenges in the Sodium Malate Market
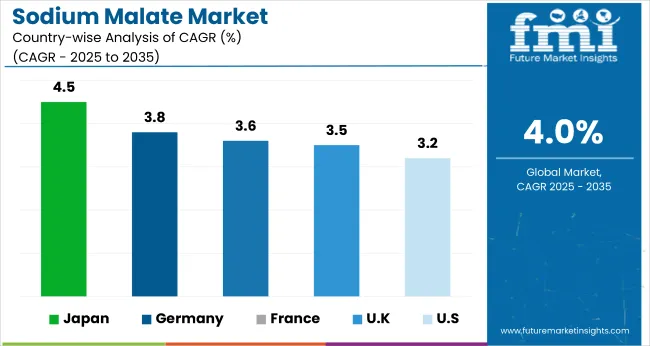
Japan’s momentum is driven by advanced food processing, personal care innovation, and regulatory alignment with clean-label and natural ingredient standards. Germany and France maintain consistent demand, supported by EU food safety mandates and funding for sustainable product development under the Green Deal. In contrast, developed economies such as the USA (3.2% CAGR), UK (3.5%), and Japan (4.5%) are expected to grow at rates between 0.80x and 1.13x the global average, reflecting moderate to strong expansion.
Japan leads with the fastest market growth, fueled by strong demand in processed foods and personal care products that emphasize natural and sustainable ingredients. Germany and France show stable expansion, underpinned by strict EU regulations, clean-label initiatives, and growing demand for organic and multifunctional products.
The USA market grows at a comparatively slower pace, focusing on regulatory compliance, ingredient transparency, and premium product innovation. The UK experiences the slowest growth among these countries, impacted by post-Brexit regulatory uncertainties; however, demand remains steady due to continued consumer interest in clean-label and natural additives.
The report covers in-depth analysis of 40+ countries; five top-performing OECD countries are highlighted below.
The sodium malate revenue in Japan is growing at a CAGR of 4.5% from 2025 to 2035. Growth is driven by rising demand in processed foods, beverages, and personal care products emphasizing natural and clean-label ingredients. As a technology-driven economy, Japan prioritizes high-quality, sustainably sourced ingredients integrated into advanced food and cosmetic formulations. While overall food industry growth is moderate, demand for multifunctional additives like sodium malate is increasing. Japan’s focus on quality, safety, and innovation differentiates it from other markets.
Sales of sodium malate in Germany are expected to expand at a CAGR of 3.8% during the forecast period, slightly below the global average but strongly driven by regulatory factors. EU clean-label initiatives, food safety regulations, and cosmetic ingredient transparency standards are accelerating the adoption of sodium malate in food and personal care products.
Key applications include bakery, beverages, and skincare. The German marketplaces strong emphasis on ingredient traceability and efficacy, with growing use in organic and natural product lines. Compared to emerging markets, Germany prioritizes regulatory compliance and product lifecycle transparency.
The French sodium malate market is projected to grow at a CAGR of 3.6% during the forecast period, mirroring Germany in its policy-backed adoption trajectory. Demand is driven by national clean-label initiatives, stringent food safety regulations, and the development of sustainable cosmetic products.
Key consumer sectors include bakery, beverages, confectionery, and personal care. The market favors multifunctional additives that offer flavor enhancement, preservation, and skin benefits. France aligns closely with EU sustainability programs that promote the use of natural ingredients.
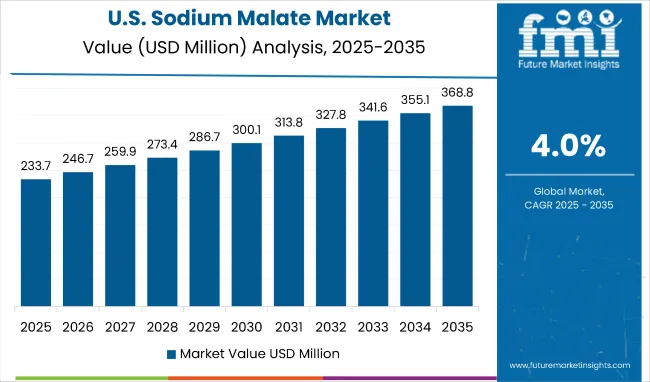
The USA sodium malate revenue is projected to grow at 3.2% CAGR from 2025 to 2035. Emerging markets focused on rapid new product launches, USA demand centers on clean-label reformulations, ingredient transparency, and compliance with FDA regulations.
High-purity and naturally sourced ingredients are critical in the food, beverage, and personal care sectors. Key production hubs include the Midwest and West Coast. Although growth lags behind Japan, the USA market delivers high value through premium product positioning and continuous innovation.
The UK sodium malate revenue is projected to grow at a CAGR of 3.5% from 2025 to 2035, representing the slowest growth among the top OECD nations at 0.88x the global pace. Growth is supported by clean-label and natural ingredient trends in food, beverages, and cosmetics.
Post-Brexit regulatory changes have introduced uncertainty, slowing capital investment. However, demand is rising for multifunctional additives tailored to smaller food producers and natural personal care brands. Government and consumer-led sustainability initiatives continue to support baseline growth across key verticals.
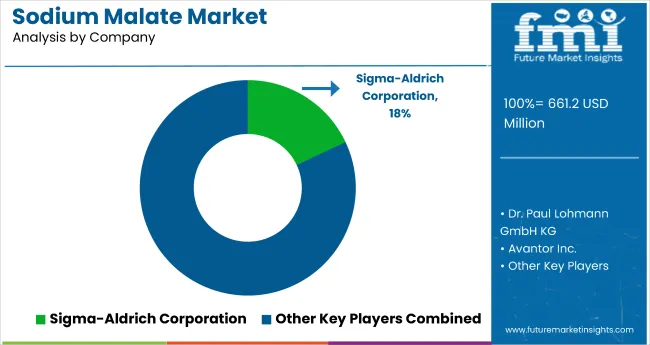
The Sodium Malate Market is growing steadily, driven by rising demand across food and beverage, pharmaceutical, and cosmetics industries. Sodium malate, a sodium salt of malic acid, serves as a flavor enhancer, acidity regulator, and buffering agent. Its natural origin, excellent solubility, and stability make it a preferred ingredient in functional foods, beverages, and dietary supplements. Market expansion is supported by the global shift toward clean-label ingredients, acidulant diversification, and increasing use in nutraceutical and personal care formulations.
Leading producers such as Sigma-Aldrich Corporation (Merck KGaA), Avantor Inc., and Dr. Paul Lohmann GmbH KG dominate the market through high-purity and pharmaceutical-grade sodium malate products. Sigma-Aldrich (Merck KGaA) offers analytical and food-grade sodium malate for use in laboratory, food, and biotech applications, focusing on quality assurance and compliance with international standards. Avantor Inc. provides high-grade sodium malate formulations for biopharmaceutical and analytical uses, ensuring consistency and scalability for global customers. Dr. Paul Lohmann GmbH KG leads in Europe with specialty mineral salts, supplying sodium malate tailored for food fortification, electrolyte balancing, and pH control applications.
Carbosynth Ltd. and Tokyo Chemical Industry Co. Ltd. (TCI) cater to the research and specialty chemical segments with laboratory-grade sodium malate used in chemical synthesis and analytical testing. BOC Sciences and MP Biomedicals LLC contribute to the life sciences and pharmaceutical sectors by offering custom synthesis and biocompatible sodium malate for cell culture media and metabolic research.
Muby Chemicals, Penta Manufacturing Company, and Neufarm GmbH focus on industrial and food-grade sodium malate production, supporting applications in processed foods, beverages, and personal care products. These suppliers emphasize sustainability and competitive pricing, meeting global demand from food processing and formulation industries.
| Report Attributes | Details |
|---|---|
| Market Size (2025) | USD 661.2 million |
| Projected Market Size (2035) | USD 979.2 million |
| CAGR (2025 to 2035) | 4% |
| Base Year for Estimation | 2024 |
| Historical Period | 2020 to 2024 |
| Projections Period | 2025 to 2035 |
| Report Parameter | USD million for value/volume in metric tons |
| Type Analyzed | Monosodium Malate and Disodium Malate |
| Application Analyzed | Food and Beverages, Personal Care, Cosmetics, and Animal Feed |
| Regions Covered | North America, Latin America, Europe, East Asia, South Asia, Oceania, Middle East and Africa |
| Countries Covered | United States, United Kingdom, Germany, France, Japan, China, India, Brazil, South Korea, Australia and 40+ countries |
| Key Players Influencing the Market | Sigma-Aldrich Corporation (Merck KGaA), Avantor Inc., Dr. Paul Lohmann GmbH KG, Carbosynth Ltd., Tokyo Chemical Industry Co. Ltd. (TCI), BOC Sciences, MP Biomedicals LLC, Muby Chemicals, Penta Manufacturing Company, Neufarm GmbH |
| Additional Attributes | Dollar sales by type, share by application, regional demand growth, regulatory influence, sustainability trends, competitive benchmarking |
The global sodium malate market is estimated to be valued at USD 661.2 million in 2025.
The market size for the sodium malate market is projected to reach USD 978.7 million by 2035.
The sodium malate market is expected to grow at a 4.0% CAGR between 2025 and 2035.
The key product types in sodium malate market are monosodium malate and disodium malate.
In terms of application, food and beverages segment to command 48.6% share in the sodium malate market in 2025.


Our Research Products

The "Full Research Suite" delivers actionable market intel, deep dives on markets or technologies, so clients act faster, cut risk, and unlock growth.

The Leaderboard benchmarks and ranks top vendors, classifying them as Established Leaders, Leading Challengers, or Disruptors & Challengers.

Locates where complements amplify value and substitutes erode it, forecasting net impact by horizon

We deliver granular, decision-grade intel: market sizing, 5-year forecasts, pricing, adoption, usage, revenue, and operational KPIs—plus competitor tracking, regulation, and value chains—across 60 countries broadly.

Spot the shifts before they hit your P&L. We track inflection points, adoption curves, pricing moves, and ecosystem plays to show where demand is heading, why it is changing, and what to do next across high-growth markets and disruptive tech

Real-time reads of user behavior. We track shifting priorities, perceptions of today’s and next-gen services, and provider experience, then pace how fast tech moves from trial to adoption, blending buyer, consumer, and channel inputs with social signals (#WhySwitch, #UX).

Partner with our analyst team to build a custom report designed around your business priorities. From analysing market trends to assessing competitors or crafting bespoke datasets, we tailor insights to your needs.
Supplier Intelligence
Discovery & Profiling
Capacity & Footprint
Performance & Risk
Compliance & Governance
Commercial Readiness
Who Supplies Whom
Scorecards & Shortlists
Playbooks & Docs
Category Intelligence
Definition & Scope
Demand & Use Cases
Cost Drivers
Market Structure
Supply Chain Map
Trade & Policy
Operating Norms
Deliverables
Buyer Intelligence
Account Basics
Spend & Scope
Procurement Model
Vendor Requirements
Terms & Policies
Entry Strategy
Pain Points & Triggers
Outputs
Pricing Analysis
Benchmarks
Trends
Should-Cost
Indexation
Landed Cost
Commercial Terms
Deliverables
Brand Analysis
Positioning & Value Prop
Share & Presence
Customer Evidence
Go-to-Market
Digital & Reputation
Compliance & Trust
KPIs & Gaps
Outputs
Full Research Suite comprises of:
Market outlook & trends analysis
Interviews & case studies
Strategic recommendations
Vendor profiles & capabilities analysis
5-year forecasts
8 regions and 60+ country-level data splits
Market segment data splits
12 months of continuous data updates
DELIVERED AS:
PDF EXCEL ONLINE
Sodium 3-Nitrobenzenesulfonate Market Size and Share Forecast Outlook 2025 to 2035
Sodium Difluorophosphate (NaDFP) Market Size and Share Forecast Outlook 2025 to 2035
Sodium Bisulfite Market Size and Share Forecast Outlook 2025 to 2035
Sodium Formate Market Size and Share Forecast Outlook 2025 to 2035
Sodium Borohydride Market Size and Share Forecast Outlook 2025 to 2035
Sodium Chloride Market Size and Share Forecast Outlook 2025 to 2035
Sodium Lactate Market Size and Share Forecast Outlook 2025 to 2035
Sodium Caprylate Market Size and Share Forecast Outlook 2025 to 2035
Sodium Caseinate Market Size and Share Forecast Outlook 2025 to 2035
Sodium Iodide Market Size and Share Forecast Outlook 2025 to 2035
Sodium Lauryl Sulphate Market Size and Share Forecast Outlook 2025 to 2035
Sodium Cumenesulfonate Market Size and Share Forecast Outlook 2025 to 2035
Sodium Stearoyl Lactate Market Size and Share Forecast Outlook 2025 to 2035
Sodium Hydrosulfite Market Size and Share Forecast Outlook 2025 to 2035
Sodium Sulphate Market Size and Share Forecast Outlook 2025 to 2035
Sodium-Ion Batteries Market Analysis - Size, Share, and Forecast Outlook 2025 to 2035
Sodium Hyaluronate Crosslinked Market Size and Share Forecast Outlook 2025 to 2035
Sodium Sulfur Batteries Market Size and Share Forecast Outlook 2025 to 2035
Sodium Thiosulphate Market Size and Share Forecast Outlook 2025 to 2035
Sodium Lauroyl Isethionate Market Size and Share Forecast Outlook 2025 to 2035

Thank you!
You will receive an email from our Business Development Manager. Please be sure to check your SPAM/JUNK folder too.
Chat With
MaRIA