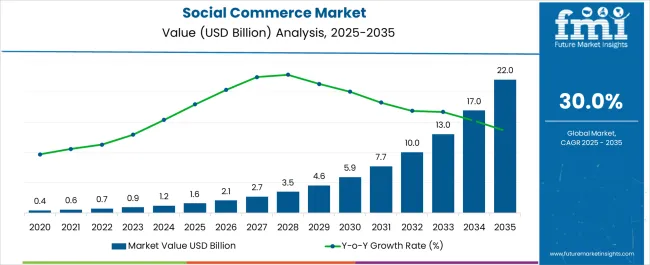
The social commerce market is estimated to be valued at USD 1.6 billion in 2025 and is projected to reach USD 22.0 billion by 2035, registering a compound annual growth rate (CAGR) of 30.0% over the forecast period.
The market represents a transformative segment within the broader digital commerce ecosystem, distinguished by its unprecedented growth velocity and fundamental departure from traditional e-commerce models. Unlike conventional online marketplaces that operate as separate destinations requiring deliberate navigation, social commerce integrates purchasing capabilities directly into social media consumption patterns, creating seamless transitions from content discovery to transaction completion. The projected compound annual growth rate of 30% reflects not merely market expansion but a comprehensive shift in how consumers interact with brands and make purchasing decisions across digital platforms.
Market dynamics in this sector reveal distinctive operational complexities that differentiate social commerce from both traditional retail and conventional e-commerce models. Social commerce platforms must simultaneously manage content creation algorithms, user engagement metrics, creator compensation structures, and transaction processing systems while maintaining the entertainment value that keeps users actively participating. This multi-faceted operational approach creates unique challenges where platform success depends on balancing content virality with commercial effectiveness, requiring specialized teams that understand both social media psychology and retail conversion optimization.
The technological landscape presents intricate challenges related to real-time inventory management across thousands of creator-led storefronts and dynamic pricing adjustments that respond to social media engagement patterns. Platform operators must develop sophisticated systems that can handle sudden demand spikes triggered by viral content while maintaining payment processing reliability and fraud detection capabilities across diverse transaction volumes. Technical teams encounter complex integration requirements where social media features, live streaming capabilities, and e-commerce functionality must operate seamlessly without compromising user experience quality.
Investment patterns within the social commerce sector reflect the capital-intensive nature of building integrated platforms that can support both social engagement and commercial transactions at scale. Companies must allocate resources across multiple operational areas including content recommendation algorithms, payment infrastructure, creator support systems, and customer service capabilities while competing for user attention against established social media platforms. These investment requirements become complicated by the need to achieve profitability across multiple revenue streams including transaction fees, advertising revenue, and subscription services.
The competitive landscape operates under different parameters compared to traditional e-commerce due to the creator economy integration and social validation factors that influence purchasing decisions. Success depends not only on product availability and pricing but also on platform ability to attract influential content creators and maintain active user communities that drive organic product discovery. Platform differentiation requires sophisticated understanding of social media trends, creator compensation models, and community management strategies that extend far beyond conventional retail expertise.
| Metric | Value |
|---|---|
| Social Commerce Market Estimated Value in (2025 E) | USD 1.6 billion |
| Social Commerce Market Forecast Value in (2035 F) | USD 22.0 billion |
| Forecast CAGR (2025 to 2035) | 30.0% |
The social commerce market is expanding rapidly as consumers increasingly engage in shopping experiences integrated with social media platforms. The growth is being fueled by rising smartphone penetration, enhanced internet connectivity, and the shift toward interactive content that merges entertainment with instant purchasing.
Businesses are leveraging influencers, live demonstrations, and peer recommendations to build trust and accelerate conversions. Technological advancements in AI driven personalization, payment integration, and seamless checkout systems are improving customer engagement and reducing drop off rates.
Regulatory support for secure digital transactions and growing consumer preference for convenience are further reinforcing adoption. The outlook remains strong as brands continue to invest in social commerce strategies that merge digital storytelling with direct sales, creating new opportunities across diverse product categories and consumer demographics.
The business to consumer segment is projected to account for 48.60% of the total market revenue by 2025, making it the leading business model. Growth in this segment is being driven by the direct engagement between brands and consumers, which enhances transparency and trust in transactions.
The ability to bypass intermediaries has enabled cost efficiency while also supporting personalized marketing campaigns. Social platforms have strengthened brand visibility and enabled faster feedback loops, which are crucial for adapting product strategies.
With increasing consumer confidence in direct online purchases, the business to consumer model continues to dominate due to its efficiency, adaptability, and direct value delivery to customers.
The personal and beauty care segment is expected to hold 42.70% of the total revenue share by 2025 within the product type category, positioning it as the most prominent. This dominance is being driven by the strong influence of visual content and consumer reliance on reviews and peer recommendations in beauty and skincare.
Social commerce platforms have provided ideal channels for product demonstrations, tutorials, and influencer led campaigns that resonate strongly with younger demographics. High product turnover, coupled with consumer desire for trend based and personalized beauty solutions, has further reinforced growth in this segment.
The continued popularity of cosmetics, skincare routines, and wellness products ensures that personal and beauty care remains at the forefront of product adoption within the social commerce market.
The video commerce segment, which includes live streaming and prerecorded content, is anticipated to represent 57.20% of total market revenue by 2025, making it the leading platform type. This is being propelled by the rising appeal of immersive and interactive shopping experiences that combine entertainment with instant purchasing capability.
Consumers have shown a preference for video based demonstrations that provide transparency, authenticity, and trust compared to static content. Brands and sellers are increasingly using live streaming to showcase product functionality, answer customer queries in real time, and drive impulse purchases.
The combination of entertainment and commerce has created a highly engaging environment that maximizes conversion rates, making video commerce the dominant force in shaping the future of social commerce.
The social commerce business has expanded quickly, since it has opened up new horizons of opportunity for medium and small-sized enterprises (SMEs). When purchasing through social commerce as opposed to e-commerce platforms, customers are more likely to expect to do so from a smaller company. Another study found that during the forecast period, 8 to 10 American firms plan to sell on social media platforms. 12% of e-Commerce businesses (mainly SMEs) currently sell on social media, and 30% of them want to do so by 2035.
During the forecast period, the market is projected to experience substantial growth compared to the period of 2020 to 2025. The social commerce market is likely to record a 30% CAGR from 2025 to 2035, in comparison to the 21% CAGR registered from 2020 to 2025.
Market Growth during 2025 to 2035
| USD billion 2025 | 1,598.6 |
|---|---|
| USD billion 2035 | 3,512.13 |
| USD billion 2035 | 10,031.0 |
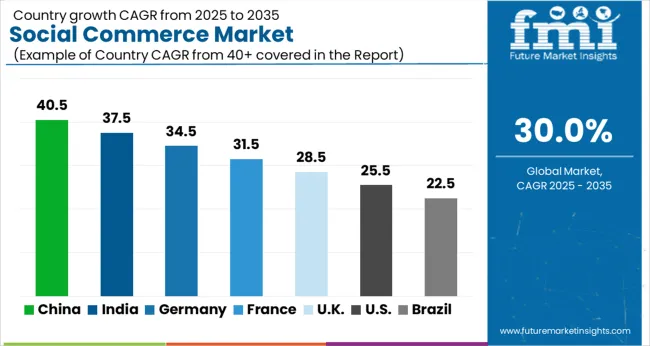
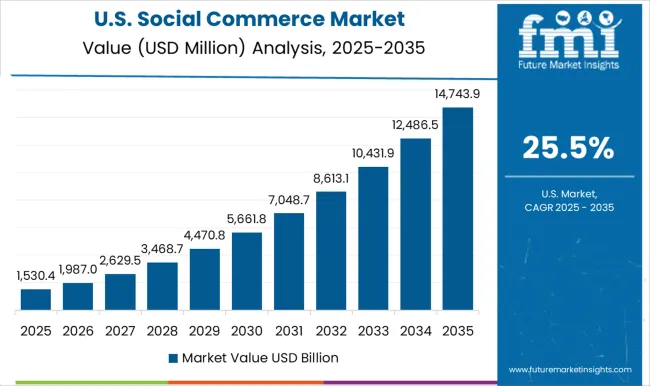
As per FMI, the USA social commerce industry is estimated to capture a market share of around 40% in the global market. With a large number of consumers and businesses adopting social media for commerce purposes, the region is expected to continue to play a significant role in the growth of the global market. The country is considered to be a hub for technological advancements and innovation, which is one of the key factors driving the growth of the social commerce industry in the region.
The USA e-commerce industry is well-established, with a large number of online retailers operating in the country. This has led to the rise of social commerce, as consumers increasingly use social media to make purchases. Social media platforms like Facebook, Twitter, and Instagram are widely used in the country and are increasingly integrating shopping features, making it easier for consumers to make purchases directly from the platforms.
In addition, the USA has a large number of businesses that are leveraging social media for marketing and advertising purposes. Companies are investing in social media marketing to reach out to their target audience and drive sales. This is expected to drive the growth of the social commerce industry in the region.
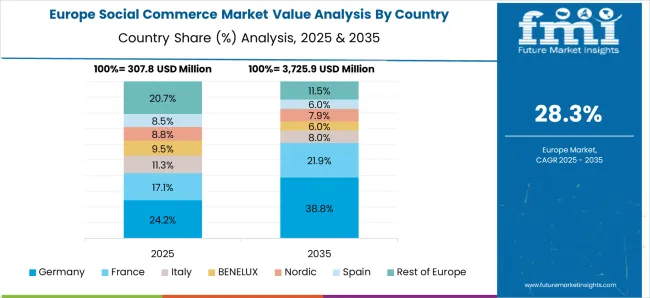
As per FMI, the German social commerce industry is estimated to capture a market share of around 20% in the global market. With a large number of consumers and businesses adopting social media for commerce purposes, Germany is expected to continue to play a significant role in the growth of the global market.
Germany is a key player in the European social commerce industry and holds a significant share of the global market. The country has a large number of e-commerce businesses, with a well-established online shopping industry. This has led to the rise of social commerce, as consumers increasingly use social media to make purchases.
Social media platforms like Facebook, Twitter, and Instagram are widely used in Germany and are increasingly integrating shopping features, making it easier for consumers to make purchases directly from the platforms. Additionally, businesses in the country are leveraging social media for marketing and advertising purposes, providing a boost to the growth of the social commerce industry.
Germany has a high adoption rate of digital technologies and a large number of tech-savvy consumers, further driving the growth of the social commerce market in the region. The country has a strong economy, which is expected to provide further support to the growth of the market.
The Asia Pacific social commerce industry is estimated to capture a market share of around 30% in the global market. With a large number of consumers and businesses adopting social media for commerce purposes, the region is expected to continue to play a significant role in the growth of the global market.
Asia Pacific is one of the fastest-growing regions in the social commerce industry and is expected to play a significant role in the growth of the global market. The region is home to a large number of developing economies, with a growing number of consumers and businesses adopting digital technologies, including social media.
Countries like China, India, and Indonesia are witnessing rapid growth in their e-commerce industries, with a large number of consumers using social media for commerce purposes. Social media platforms like WeChat and Shopee are widely used in the region and are increasingly integrating shopping features, making it easier for consumers to make purchases directly from the platforms.
In addition, businesses in the region are increasingly leveraging social media for marketing and advertising purposes. Companies are investing in social media marketing to reach out to their target audience and drive sales, which is expected to drive the growth of the social commerce industry in the region.
As per FMI, the South Korea social commerce market is estimated to capture a market share of around 15% in the global market. With a large number of consumers and businesses adopting social media for commerce purposes, the region is expected to continue to play a significant role in the growth of the global market.
South Korea has emerged as a key player in the global social commerce industry, with a significant share of the market. The country is known for its high-tech infrastructure and widespread use of technology, which has helped to drive the growth of the social commerce industry.
In South Korea, social media platforms like KakaoTalk, Naver, and Band are widely used by consumers and businesses. These platforms have integrated shopping features, making it easier for consumers to make purchases directly from the platforms. Additionally, the country's e-commerce industry is well-established, with a large number of online retailers operating in the region.
In addition, South Korean businesses are leveraging social media for marketing and advertising purposes. Companies are investing in social media marketing to reach out to their target audience and drive sales, which is expected to drive the growth of the social commerce industry in the region.
The business-to-consumer (B2C) segment in the social commerce market has held a dominant position, with a market share of 56% in 2025. This segment is expected to continue its significant growth rate during the forecast period, driven by shifts in consumer behavior, adoption of digital modes, and rising demand for easier shopping experiences. Social commerce platforms allow customers to easily browse, select, and purchase products, while also viewing reviews from other users.
On the other hand, the customer-to-customer (C2C) segment is expected to experience a rapid growth rate of 28% during the forecast period. This segment refers to websites that act as intermediaries between customers, enabling them to switch between the roles of seller and buyer based on their needs.
The business-to-business (B2B) segment is expected to experience steady growth in the coming years, as companies and businesses use this model to sell their products and services to other buyer companies. This segment also caters to niche markets and fulfills the unique requirements of its customers.
Video Commerce dominated the social commerce market with a staggering 42.5% share in 2025, and is projected to grow at a CAGR of 33.6% in the forecast years. With live-stream shopping emerging as a popular trend, retailers are capitalizing on this opportunity to increase sales conversion rates and enhance the customer experience.
For example, Walmart Inc. entered into a partnership with TikTok and conducted a successful pilot test for live-stream shopping in December 2024. As video commerce continues to grow in popularity, key players are jumping on the bandwagon with their versions, such as YouTube Short, Snapchat Spotlight, and Instagram Reels. The boom in short-form videos, particularly in the Asia Pacific region and in Western countries, is expected to drive engagement and further boost the growth of the video commerce segment.
In 2025, the apparel industry dominated the social commerce market, with a revenue share of approximately 23.4%. Clothing and apparel is the most popular product category on social media platforms, due to their widespread popularity and demand. During the pandemic, fashion retailers have utilized social media to create unique shopping experiences, collaborate with influencers and connect with customers in new ways.
The personal and beauty care segment is poised for significant growth, with an estimated CAGR of 36.2% during the forecast period. Consumers are drawn to online shopping for personal and beauty care products, as they have a clear understanding of the product and user experience. Personal and beauty care brands place a high value on customer data and use it for targeted marketing and product development.
The social commerce industry is highly competitive, with a large number of players operating in the industry. Leading players in the market include Amazon, Facebook, Alibaba, Twitter, and Google. These companies are investing in innovation and developing new technologies to enhance the shopping experience for consumers.
Innovative Technologies by Key Players and Investment Opportunities
Amazon
Amazon is leveraging its vast e-commerce ecosystem to integrate social shopping features into its platform. The company is also investing in AI-powered recommendations and personalized shopping experiences to enhance the customer experience.
Facebook is leveraging its massive user base to drive the growth of its social commerce offerings. The company is integrating shopping features into its platform, allowing consumers to make purchases directly from the platform. Facebook is also investing in augmented reality and virtual reality technologies to enhance the shopping experience for consumers.
Alibaba
Alibaba is leveraging its expertise in e-commerce and logistics to drive the growth of its social commerce offerings. The company is integrating social shopping features into its platform, making it easier for consumers to make purchases. Alibaba is also investing in AI and machine learning technologies to enhance the shopping experience for consumers.
Twitter is leveraging its massive user base and real-time news feed to drive the growth of its social commerce offerings. The company is integrating shopping features into its platform, allowing consumers to make purchases directly from the platform. Twitter is also investing in AI-powered recommendations and personalized shopping experiences to enhance the customer experience.
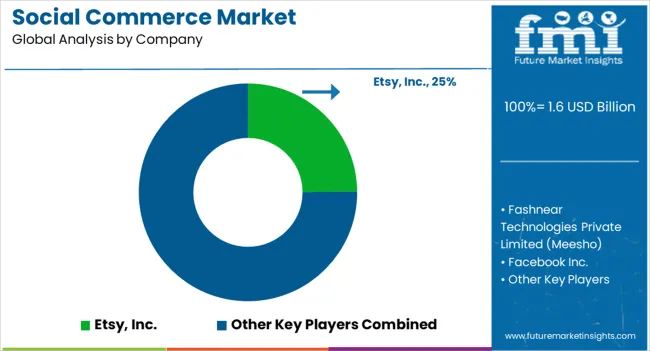
The Social Commerce Market is experiencing strong growth as digital consumers increasingly merge social engagement with online purchasing. The market’s evolution is being driven by platform integration, influencer-driven marketing, and the seamless blending of content, community, and commerce. Global leaders such as Meta Platforms Inc., TikTok, and Alibaba Group Holding Ltd. are defining the landscape with advanced in-app shopping features, live-streamed sales, and AI-based personalization engines that enhance product discovery and consumer retention.
Etsy Inc., Pinduoduo Inc., and Taobao continue to strengthen their ecosystems by combining peer-to-peer selling, small business empowerment, and localized marketplace models. Their strategies emphasize trust-based commerce through user reviews, transparent seller metrics, and creative content engagement. Pinterest Inc., Snap Inc., and X Corp. are evolving into transactional platforms, adding shoppable posts, integrated payment gateways, and augmented reality try-on tools that improve consumer interaction and conversion rates.
In emerging markets, Fashnear Technologies Private Limited (Meesho), Roposo, Trell Shop, and Yunji Sharing Technology Co. Ltd. are reshaping online retail through social referral models and influencer-led community selling. These firms leverage micro-entrepreneurship and social sharing to reach price-sensitive, mobile-first consumers.
Poshmark Inc. and PayPal Holdings Inc. contribute through seamless payment integration, community trust mechanisms, and secure transaction ecosystems that simplify the buying process. Xiaohongshu (Little Red Book) exemplifies China’s hybrid model of content-led commerce, blending lifestyle inspiration with direct shopping experiences.
| Item | Value |
|---|---|
| Quantitative Units | USD 1.6 Billion |
|
Business Model |
Business to Consumer (B2C), Business to Business (B2B), and Consumer to Consumer (C2C) |
| Product Type |
Personal & Beauty Care, Apparels, Accessories, Home Products, Health Supplements, Food & Beverage, and Others |
| Platform/Sales Channel |
Video Commerce (Live stream + Prerecorded), Social Network-led Commerce, Social Reselling, Group Buying, and Product Review Platforms |
| Regions Covered | North America, Europe, Asia-Pacific, Latin America, Rest of world |
| Country Covered | United States, Germany, China, India, South Korea |
| Key Companies Profiled |
Etsy Inc., Fashnear Technologies Private Limited, Meta Platforms Inc., Pinduoduo Inc., Pinterest Inc., Poshmark Inc., Roposo, Snap Inc., Taobao, TikTok, Trell Shop, X Corp., PayPal Holdings Inc., Xiaohongshu, Yunji Sharing Technology Co. Ltd., Alibaba Group Holding Ltd. |
| Additional Attributes | Dollar sales by business model, product type, and platform channel; adoption trends in influencer-driven and live-stream video commerce; rising demand for AI-personalized product recommendations and social network-led shopping integrations; sector-specific growth in beauty, apparel, and home product categories; revenue segmentation between physical product transactions and affiliate/live-commerce services; integration with AR/VR try-on tools, AI-powered recommendation engines. |
The global social commerce market is estimated to be valued at USD 1.6 billion in 2025.
The market size for the social commerce market is projected to reach USD 22.0 billion by 2035.
The social commerce market is expected to grow at a 30.0% CAGR between 2025 and 2035.
The key product types in social commerce market are business to consumer (b2c), business to business (b2b) and consumer to consumer (c2c).
In terms of product type, personal & beauty care segment to command 42.7% share in the social commerce market in 2025.


Our Research Products

The "Full Research Suite" delivers actionable market intel, deep dives on markets or technologies, so clients act faster, cut risk, and unlock growth.

The Leaderboard benchmarks and ranks top vendors, classifying them as Established Leaders, Leading Challengers, or Disruptors & Challengers.

Locates where complements amplify value and substitutes erode it, forecasting net impact by horizon

We deliver granular, decision-grade intel: market sizing, 5-year forecasts, pricing, adoption, usage, revenue, and operational KPIs—plus competitor tracking, regulation, and value chains—across 60 countries broadly.

Spot the shifts before they hit your P&L. We track inflection points, adoption curves, pricing moves, and ecosystem plays to show where demand is heading, why it is changing, and what to do next across high-growth markets and disruptive tech

Real-time reads of user behavior. We track shifting priorities, perceptions of today’s and next-gen services, and provider experience, then pace how fast tech moves from trial to adoption, blending buyer, consumer, and channel inputs with social signals (#WhySwitch, #UX).

Partner with our analyst team to build a custom report designed around your business priorities. From analysing market trends to assessing competitors or crafting bespoke datasets, we tailor insights to your needs.
Supplier Intelligence
Discovery & Profiling
Capacity & Footprint
Performance & Risk
Compliance & Governance
Commercial Readiness
Who Supplies Whom
Scorecards & Shortlists
Playbooks & Docs
Category Intelligence
Definition & Scope
Demand & Use Cases
Cost Drivers
Market Structure
Supply Chain Map
Trade & Policy
Operating Norms
Deliverables
Buyer Intelligence
Account Basics
Spend & Scope
Procurement Model
Vendor Requirements
Terms & Policies
Entry Strategy
Pain Points & Triggers
Outputs
Pricing Analysis
Benchmarks
Trends
Should-Cost
Indexation
Landed Cost
Commercial Terms
Deliverables
Brand Analysis
Positioning & Value Prop
Share & Presence
Customer Evidence
Go-to-Market
Digital & Reputation
Compliance & Trust
KPIs & Gaps
Outputs
Full Research Suite comprises of:
Market outlook & trends analysis
Interviews & case studies
Strategic recommendations
Vendor profiles & capabilities analysis
5-year forecasts
8 regions and 60+ country-level data splits
Market segment data splits
12 months of continuous data updates
DELIVERED AS:
PDF EXCEL ONLINE
SocialFi NFTs Market Size and Share Forecast Outlook 2025 to 2035
Social and Emotional Learning Market Forecast Outlook 2025 to 2035
Social Tourism Market Forecast and Outlook 2025 to 2035
Social Publishing Application Market Size and Share Forecast Outlook 2025 to 2035
Social Media Records Management Market Size and Share Forecast Outlook 2025 to 2035
Social Media Engagement Applications Market Size and Share Forecast Outlook 2025 to 2035
Social TV Market Size and Share Forecast Outlook 2025 to 2035
Social Video Advertising Market Size and Share Forecast Outlook 2025 to 2035
Social Employee Recognition System Market Size, Growth, and Forecast for 2025 to 2035
Social Media Content Creation Market Size and Share Forecast Outlook 2025 to 2035
Social Advertising Tools Market Size and Share Forecast Outlook 2025 to 2035
Social Employee Recognition System Market in Korea – Industry Outlook & Forecast 2025 to 2035
Evaluating Social Media and Destination Market Share & Provider Insights
Social Media and Destination Market Analysis by Platform, by Destination Type, by Region - Forecast for 2025 to 2035
Social Business Intelligence Market Growth – Trends & Forecast 2024-2034
Commerce Cloud Market
Social Media Content Creator Market
Social Media Analytics Market
Social Software As A Collaborative ERP Tool Market
Ecommerce Software and Platform Market Size and Share Forecast Outlook 2025 to 2035

Thank you!
You will receive an email from our Business Development Manager. Please be sure to check your SPAM/JUNK folder too.
Chat With
MaRIA