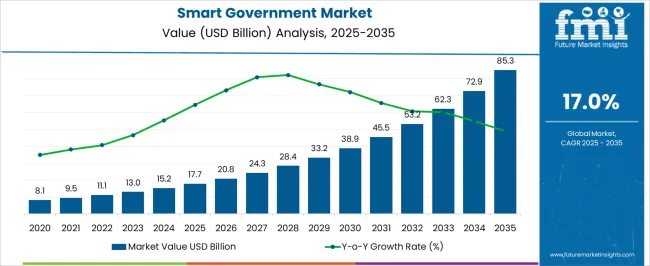
The Smart Government Market is estimated to be valued at USD 17.7 billion in 2025 and is projected to reach USD 85.3 billion by 2035, registering a compound annual growth rate (CAGR) of 17.0% over the forecast period.

| Metric | Value |
|---|---|
| Smart Government Market Estimated Value in (2025 E) | USD 17.7 billion |
| Smart Government Market Forecast Value in (2035 F) | USD 85.3 billion |
| Forecast CAGR (2025 to 2035) | 17.0% |
The smart government market is experiencing consistent growth as public sector organizations increasingly adopt digital technologies to enhance service delivery, transparency, and operational efficiency. Rising investments in smart infrastructure, e governance platforms, and data driven decision making are propelling adoption across multiple regions.
The push for citizen centric services, integration of IoT and AI into public operations, and the demand for real time information access are further reinforcing market expansion. Governments are prioritizing cloud adoption, cybersecurity measures, and interoperable platforms to improve resilience and responsiveness.
The outlook remains favorable as the public sector continues to modernize operations, reduce inefficiencies, and enable more accessible and secure services aligned with long term digital transformation goals.

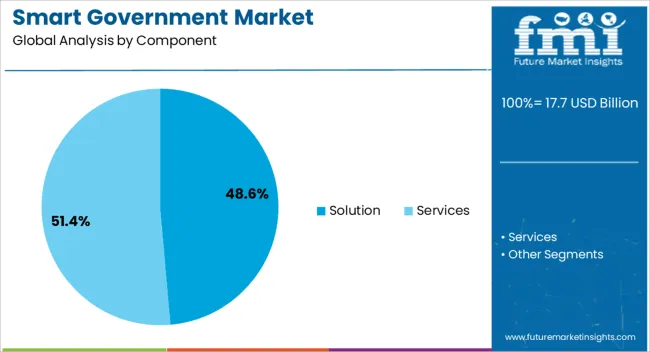
The solution segment is projected to hold 48.60% of the total market by 2025, making it the dominant component. Growth in this segment is attributed to the rising implementation of advanced platforms that streamline government processes, enhance data integration, and provide real time insights for policy making.
Solutions have been widely adopted to improve citizen engagement, strengthen security frameworks, and optimize resource utilization. The ability to consolidate multiple services within a unified digital platform has further supported demand.
As governments continue to pursue comprehensive digital transformation initiatives, the solution segment remains the cornerstone of smart government adoption.

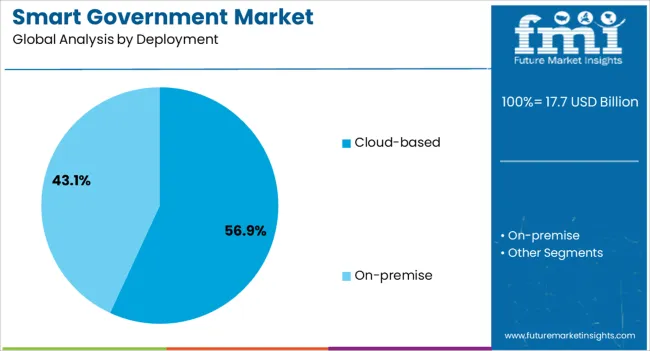
The cloud based deployment segment is expected to account for 56.90% of overall revenue by 2025, positioning it as the leading deployment model. The rapid growth of this segment is being driven by the scalability, cost efficiency, and flexibility that cloud infrastructure offers to government operations.
Cloud adoption has enabled real time collaboration, enhanced cybersecurity frameworks, and disaster recovery capabilities that are crucial for mission critical applications. Moreover, cloud deployment supports the integration of AI, big data analytics, and IoT across government ecosystems, significantly improving decision making and service delivery.
With increasing emphasis on resilient and secure digital infrastructure, cloud based deployment has solidified its position as the preferred model in the smart government market.
Owing to the availability of resources and initiatives by governments, countries are witnessing an increase in the number of smart cities. With the same intention, various city councils in the countries are collaborating with various solution providers for implementing new information and communication technologies (ICT).
Moreover, with the intention of proliferating the adoption of smart devices and smart technologies, various organizations are collaborating with the country’s government entities to drive smart cities projects, which further is contributing towards the growth of the market.
For instance, In January 2020, the city of Duisburg signed a Memorandum of Understanding (MoU) with Huawei Enterprise Business Group for enabling Duisburg to become a smart city. Also, In May 2020, GFCA (Global Future Cities Alliance) partnered with CATIS (China Association of Trade in Services) for accelerating the smart city development in the country.
In addition, rapid increase in urbanization is creating congested landscapes, thereby giving rise to issues such as climate change, high energy consumption, water scarcity, and other economic and social problems. According to the United Nations, the global urban population in 2020 was 54%, which is expected to increase to 66% by 2050.
This rapid rate of change in urbanization is expected to exert substantial pressure on the available resources. Thus, the governments of most developed and developing countries are focusing on smart city projects to implement new technologies which ensure optimal utilization of the available resources, along with providing superior connectivity and healthy lifestyles.
With the rise in the number of smartphones and tablets and other smart devices, the opportunities for the growth of digital technologies is growing continuously. For any city to cater to and meet the growing demands of an urban population and the consumption of man-made and natural resources, it must leverage technology and the resultant smart solutions to drive a holistic benefit for the entire ecosystem.
Furthermore, owing to the initiatives taken by the governments of various countries, such as China and India, for adopting smart meters and smart grids, a high opportunity for the growth of smart government market is expected.
For instance, In June 2020, HPL Electric and Power Ltd., an Indian-based company, received a BIS certification for the deployment of smart meters in the country. In June 2020, Vector, an Auckland-based energy and utility company, partnered with mPrest, an Israeli-based software company, for offering smart grids in Australia.
A transition towards the adoption of fiber optic network systems is being witnessed from copper-based systems in some developed and developing countries. However, network systems of a high proportion of developing countries still function over copper-based cables and systems. This, as a result, restricts the efficient implementation of advanced technologies such as smart grids, IoT, etc.
Hence, the inability of supporting the required bandwidth for the implementation of advanced technologies (necessary for enabling smart government) across a major proportion of cities, globally, restrains the growth of the market.

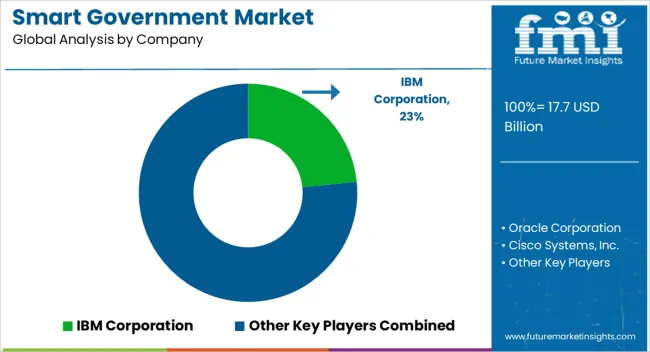
are actively involved in offering smart governmentsolutions across various applications in different geographies.
Cisco Systems has a long history of jump-starting or accelerating its growth in market through strategic partnerships and collaborations with companies in the smart cities ecosystem. This planned and yet aggressive approach to business growth coupled with strong execution allowed the company to maintain its firm leadership position in the smart cities market and helps the company in building broadest portfolio of products and a customer base.
The companies are focusing on continuous improvements and technological advancements in smart government solutions. Moreover, the company aims at expanding its solution portfolio by introducing new product releases to cater to the technological advancements and demands from various industries.
With growing awareness about sustainable living, several countries such as Ecuador and Bolivia are developing their own consumption and sustainable lifestyle patterns. Sustainable living entails the adoption of environment-friendly lifestyle and reducing the carbon footprint by altering energy consumption, mode of transportation, etc.
Therefore, growing awareness about leading a sustainable lifestyle among consumers is expected to fuel the growth of the global smart government market in the near future.
The total amount of waste generated globally is expected to increase by approximately 50% over the next decade. This is gradually creating the need for waste management solutions beyond conventional landfills. Governments in Smart cities are deploying waste management solutions for the recycling and reduction of waste.
IBM Intelligent Waste Management Platform provides analytic tools that allow users to collate information about waste collection, demographics, & financial information, and present it in the form of visual analytics based on which cities can plan recycling programs and other activities.
The government of North America continuously focuses on implementing technologically advanced innovations across all industry verticals. Hence, with the intention of enhancing the offerings and security associated with transportation, the region has witnessed continuous implementations of smart solutions; for instance, smart vehicles.
In May 2020, the Colorado Department of Transportation offered USD 2.75 Million to Integrated Roadways, a Kansas city-based startup, with the intention of testing and implementing smart pavements for enhancing the roadway security of the region. Integrated Roadways, in partnership with Kiewit Infrastructure Co., Cisco Systems, WSP Global, and Wichita Concrete Pipe is focusing on building a half-mile smart pavement.
Owing to the initiatives taken by the governments of some countries, such as India, for adopting smart cities and smart grids, a high opportunity for the growth of smart meters is expected. Hence, various companies are focusing on deploying/offering smart meters in the region.
In June 2020, HPL Electric and Power Ltd., an Indian-based company, received a BIS certification for the deployment of smart meters in the country.
In June 2020, Vector, an Auckland-based energy and utility company, partnered with mPrest, an Israeli-based software company, for offering smart grids in Australia.
The pandemic outbreak has a substantial impact on societies and economies and has affected the market significantly. As lockdowns had been imposed by governments all over the globe, the continuity of operations for a majority of industries was adversely impacted.
In addition, hardware and IoT sensors ar majorly manufactured in China due to low labour costs, but as the global supply chain was impacted abruptly, majority of countries have cut-off all their imports. Thus there will be a rise in costs of hardware and IoT solutions, which hinders the growth of the smart government market.
However, smart cities were using smart city platform for aerial surveillance, heat maps, GPS systems and othersto monitor the movement of suspected Covid-19 cases and health personnel. Thus there was demand for solutions and services during the pandemic outbreak. So the smart government market is anticipated to gain back its momentum by end of 2024.
The global smart government market is estimated to be valued at USD 17.7 billion in 2025.
The market size for the smart government market is projected to reach USD 85.3 billion by 2035.
The smart government market is expected to grow at a 17.0% CAGR between 2025 and 2035.
The key product types in smart government market are solution, _analytics, _]open data platform, _government resource planning system, _remote monitoring, _network management, _security, _smart transportation, _others, services, _professional services and _managed services.
In terms of deployment, cloud-based segment to command 56.9% share in the smart government market in 2025.


Our Research Products

The "Full Research Suite" delivers actionable market intel, deep dives on markets or technologies, so clients act faster, cut risk, and unlock growth.

The Leaderboard benchmarks and ranks top vendors, classifying them as Established Leaders, Leading Challengers, or Disruptors & Challengers.

Locates where complements amplify value and substitutes erode it, forecasting net impact by horizon

We deliver granular, decision-grade intel: market sizing, 5-year forecasts, pricing, adoption, usage, revenue, and operational KPIs—plus competitor tracking, regulation, and value chains—across 60 countries broadly.

Spot the shifts before they hit your P&L. We track inflection points, adoption curves, pricing moves, and ecosystem plays to show where demand is heading, why it is changing, and what to do next across high-growth markets and disruptive tech

Real-time reads of user behavior. We track shifting priorities, perceptions of today’s and next-gen services, and provider experience, then pace how fast tech moves from trial to adoption, blending buyer, consumer, and channel inputs with social signals (#WhySwitch, #UX).

Partner with our analyst team to build a custom report designed around your business priorities. From analysing market trends to assessing competitors or crafting bespoke datasets, we tailor insights to your needs.
Supplier Intelligence
Discovery & Profiling
Capacity & Footprint
Performance & Risk
Compliance & Governance
Commercial Readiness
Who Supplies Whom
Scorecards & Shortlists
Playbooks & Docs
Category Intelligence
Definition & Scope
Demand & Use Cases
Cost Drivers
Market Structure
Supply Chain Map
Trade & Policy
Operating Norms
Deliverables
Buyer Intelligence
Account Basics
Spend & Scope
Procurement Model
Vendor Requirements
Terms & Policies
Entry Strategy
Pain Points & Triggers
Outputs
Pricing Analysis
Benchmarks
Trends
Should-Cost
Indexation
Landed Cost
Commercial Terms
Deliverables
Brand Analysis
Positioning & Value Prop
Share & Presence
Customer Evidence
Go-to-Market
Digital & Reputation
Compliance & Trust
KPIs & Gaps
Outputs
Full Research Suite comprises of:
Market outlook & trends analysis
Interviews & case studies
Strategic recommendations
Vendor profiles & capabilities analysis
5-year forecasts
8 regions and 60+ country-level data splits
Market segment data splits
12 months of continuous data updates
DELIVERED AS:
PDF EXCEL ONLINE
Smart Card in Government Market by Card Type , by Application, by End User & Region Forecast till 2025 to 2035
Smart School Bus Platform Market Size and Share Forecast Outlook 2025 to 2035
Smart Home Wireless Smoke Detector Market Size and Share Forecast Outlook 2025 to 2035
Smart Bus Platform Market Size and Share Forecast Outlook 2025 to 2035
Smart Vision Processing Chips Market Size and Share Forecast Outlook 2025 to 2035
Smart Touch Screen Scale Market Size and Share Forecast Outlook 2025 to 2035
Smart Magnetic Drive Conveyor System Market Size and Share Forecast Outlook 2025 to 2035
Smart Wheelchair market Size and Share Forecast Outlook 2025 to 2035
Smart Mining Technologies Market Size and Share Forecast Outlook 2025 to 2035
Smart Parking Market Size and Share Forecast Outlook 2025 to 2035
Smart Digital Valve Positioner Market Forecast and Outlook 2025 to 2035
Smart Card IC Market Size and Share Forecast Outlook 2025 to 2035
Smart-Tag Inlay Inserters Market Analysis - Size and Share Forecast Outlook 2025 to 2035
Smart TV Market Forecast and Outlook 2025 to 2035
Smart/AI Toy Market Size and Share Forecast Outlook 2025 to 2035
Smart Locks Market Size and Share Forecast Outlook 2025 to 2035
Smart Sprinkler Controller Market Size and Share Forecast Outlook 2025 to 2035
Smart Indoor Gardening System Market Size and Share Forecast Outlook 2025 to 2035
Smart Building Delivery Robot Market Size and Share Forecast Outlook 2025 to 2035
Smart Watch Market Size and Share Forecast Outlook 2025 to 2035

Thank you!
You will receive an email from our Business Development Manager. Please be sure to check your SPAM/JUNK folder too.
Chat With
MaRIA