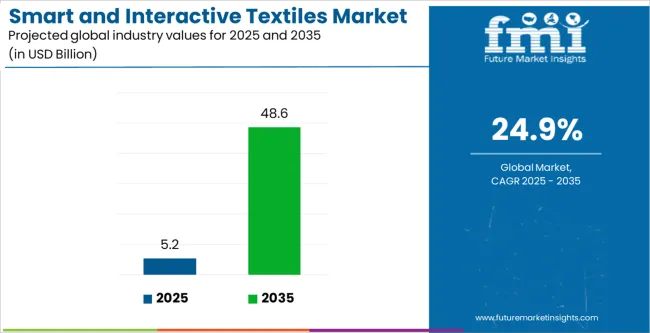
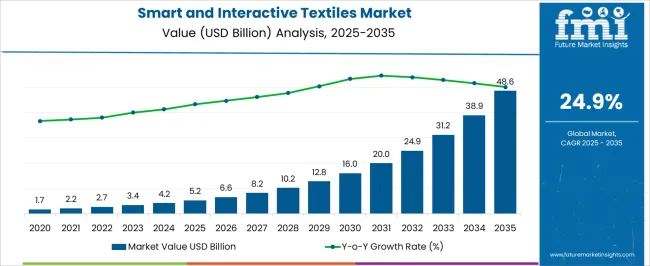
The Smart and Interactive Textiles Market is estimated to be valued at USD 5.2 billion in 2025 and is projected to reach USD 48.6 billion by 2035, registering a compound annual growth rate (CAGR) of 24.9% over the forecast period.
| Metric | Value |
|---|---|
| Smart and Interactive Textiles Market Estimated Value in (2025 E) | USD 5.2 billion |
| Smart and Interactive Textiles Market Forecast Value in (2035 F) | USD 48.6 billion |
| Forecast CAGR (2025 to 2035) | 24.9% |
The smart and interactive textiles market is experiencing strong growth driven by advancements in wearable technology, increasing integration of sensors, and rising demand for responsive fabrics across diverse sectors. The convergence of electronics with textiles is enabling real time monitoring, data collection, and adaptive functionality, which are being adopted in both consumer and industrial environments.
Growing health and fitness awareness has accelerated demand for textile based wearables, while military and defense organizations are investing in smart fabrics that enhance safety, communication, and performance. Innovations in conductive fibers, nanomaterials, and energy harvesting fabrics are broadening application potential.
Regulatory support for sustainable textile development and rising consumer interest in multifunctional clothing are further fueling adoption. The outlook remains optimistic as smart textiles are positioned to become a key enabler of connected ecosystems, aligning with digital health, Industry 4.0, and sustainability initiatives.
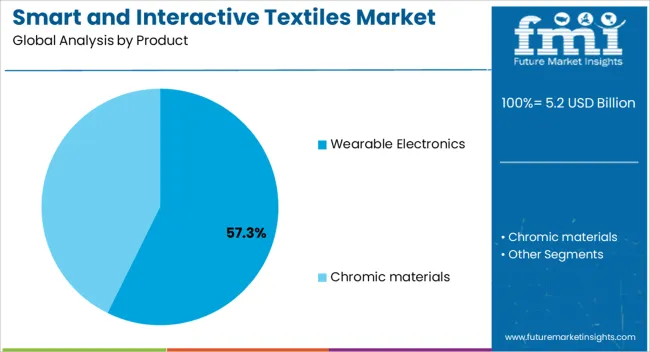
The wearable electronics segment is projected to contribute 57.30% of total revenue by 2025 within the product category, establishing it as the leading segment. Growth has been driven by rising demand for health monitoring, fitness tracking, and personalized data solutions integrated seamlessly into apparel.
The ability of wearable electronic textiles to track physiological parameters such as heart rate, temperature, and movement has accelerated their adoption in both healthcare and consumer markets. Additionally, lifestyle shifts toward proactive health management and growing acceptance of digital fitness platforms have further supported market penetration.
Continuous research in flexible sensors and durable conductive fibers is improving product performance and comfort, strengthening the dominance of wearable electronics in this category.
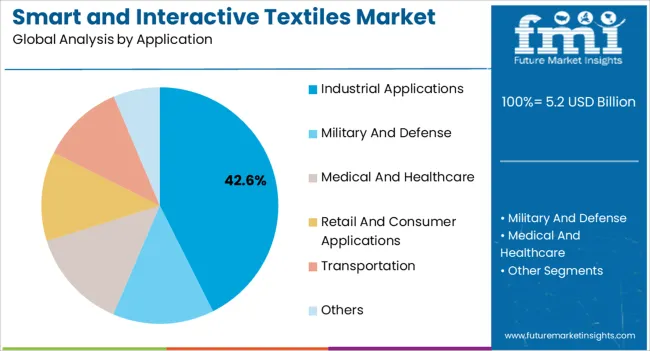
The industrial applications segment is expected to account for 42.60% of overall market revenue by 2025, positioning it as the most prominent application area. This growth is being propelled by demand for textiles that enhance worker safety, operational efficiency, and predictive maintenance in manufacturing and heavy industries.
Smart fabrics embedded with sensors and connectivity features are enabling real time monitoring of hazardous conditions and worker health, reducing risks and downtime. Adoption has also been supported by the increasing shift toward Industry 4.0, where data driven decision making and machine to human interfaces are central.
Furthermore, innovations in heat resistant and pressure sensitive fabrics are expanding industrial use cases. With industries prioritizing safety compliance, productivity, and sustainability, smart textiles are becoming integral to future ready industrial operations.
The global demand for smart and interactive textiles is projected to increase at a CAGR of 26.1% during the forecast period between 2025 and 2035, reaching a total of USD 48.6 billion in 2035, according to a report from Future Market Insights (FMI). From 2020 to 2025, sales witnessed significant growth, registering a CAGR of 24%.
The establishment of a new facility by key manufacturers for meeting the rising demand for smart fabrics around the globe is one of the current trends. For instance,
Increasing demand for smart fabrics like leisurewear is expected to be one of the key trends in the market. This is also attributed to the growing disposable income of the consumer which is encouraging them to spend on leisure products. Also, changing lifestyles of the consumers coupled with the growth in the urban population around the globe due to the gradual shift from rural to urban areas is further expected to propel the market growth.
Development of Multi-Featured and Hybrid Smart Textiles to Boost the Market Growth
Nowadays, people usually own multiple mobile devices, such as smartphones and tablets, and are further looking for compact devices, which can integrate all the computing and monitoring into a single device. This presents an opportunity for the development of multi-function and hybrid smart textiles that not only make users’ life easy but also bring convergence with many wearable devices. For instance,
Implementation of Advance Technologies in Smart Textiles to Accelerate the Market Growth
The advent of new technologies such as the Internet of Things (IoT), and Artificial Intelligence (AI) has transformed the textile industry. New smart apparel is being manufactured integrated with AI, Bluetooth Low Energy (BLE), edge computing, and cloud data, which can monitor and communicate the wearer’s information, including blood pressure, heart rate, perspiration, and temperature.
AI can access and collect historical and real-time operational data and provide insights, which can enhance the wearer’s efficiency. Defect detection, pattern inspection, and color matching are some of the common applications of AI in textile manufacturing.
The use of AI has enabled the production of smart apparel that leverages IoT and electronic sensors to create an excellent user experience. Further, the integration of technologies in textiles can provide a comfortable and health-focused experience.
Since clothes cover a significant portion of the body, smart textiles can potentially provide different types of physiological information. Besides, smart textiles highly rely on BLE and IoT technologies for a long-lasting energy source from their embedded battery.
Thermal Consideration and Product Protection Challenges to Impede the Market Growth
Smart textiles such as smart shirts and health monitors that are worn continuously function in rugged conditions involving dust and moisture. Materials used in packaging and assembly remain sensitive to external temperature and moisture.
The operating temperature of the device is decided based on reliability requirements and the comfort level of users. These thermal design challenges are significant enough since it is required for the comfort and longevity of the product.
The Lack of Standards and Regulations to Hinder the Market Growth
The lack of standards and regulations is expected to be one of the key restraining factors for the market growth as it is making it difficult for smart fabric manufacturers to scale up and commercialize new and incremental technologies. Moreover, the production of smart textiles can pose serious environmental and health hazards.
Some of the leading operations of the textile industry are de-sizing, bleaching, dyeing, neutralizing, scouring, mercerizing, printing, and finishing. These operations lead to the discharge of high-level toxic effluents that contaminate soil, as well as cause air, groundwater, and surface water pollution. Thus, the establishment of environmental standards is necessary to control the pollution caused by the textile and leather industries.
| Countries | Revenue Share % (2025) |
|---|---|
| The United States | 16.8% |
| Germany | 10.5% |
| Japan | 6.6% |
| Australia | 2.8% |
| North America | 28.1% |
| Europe | 21.8% |
| Countries | CAGR % (2025 to 2035) |
|---|---|
| China | 28.7% |
| India | 25.4% |
| The United Kingdom | 23.2% |
The Rising Penetration of Smartphones in the Region to Boost the Market Growth
North America is slated to capture the largest chunk of the smart and interactive textiles market revenue, held 28.1% in 2025. The expanding fitness & sports industry along with the rising penetration of smartphones with Bluetooth Low Energy (BLE) to connect sensors to the internet is expected to boost the product demand in North America.
North America held a notable share of the global smart and interactive textiles market, attributed to the strong presence of several industries such as healthcare, military, and transportation.
The Adoption of Smart Textiles by End-Users to Fuel the Market Growth
The smart and interactive textiles market in Asia Pacific held a market share of 32% in 2025. Asia Pacific region is one of the significantly growing regions in the smart and interactive textiles market, attributed to the:
Rising Growth of the Automotive Industry to Reaffirm Growth in Europe
The market in Europe accumulated a market share of 21.8% in 2025, attributed to the:
| Category | By Product Type |
|---|---|
| Leading Segment | Wearables Electronics |
| Market Share% (2025) | 65.6% |
| Category | By Product Type |
|---|---|
| Leading Segment | Industrial |
| Market Share% (2025) | 19.6% |
Wearable Electronics Segment of Smart and Interactive Textiles to Beat Competition in Untiring Markets
The wearable electronics segment is projected to expand at a market share of 11.9% over the analysis period. The wearable electronics are integrated with sensors to track the movement of soldiers, sportspersons, and racers. It is also used for patients with cardiac diseases. The segment held a market share of 65.6% in 2025.
The prevailing widespread applications of wearable electronics in the medical & healthcare sector can be attributed to the accurate & fast diagnosis and risk assessment. Additionally, wearable electronics is a versatile category compared to other electronics sections and users can detect changes fast and in many convenient ways.
Transportation to Constitute the Bulk of the Smart and Interactive Textiles Market
By Application, the transportation segment of the market held a notable market share of nearly 10.0% in 2024. Smart textiles are used in applications including aerospace, such as airplanes, spaceships, and satellites, and ground transportation railway & automotive to decrease weight, which will ultimately boost efficiency. Further, the textiles are used to make insulation for thermal control inside the vehicle. The industrial application segment leads the market and held a market share of 19.6% in 2025.
The transportation sector has been growing at a significant pace owing to improving socioeconomic factors, thereby leading to significantly evolving consumer preference for technically advanced cars and other vehicles.
Smart and interactive textiles providers such as MesoMat, EHO Textiles, Nyokas Technologies, Clim8, Myant, Elitac, and Reshamandi, among others, are adopting various marketing strategies such as new product launches, geographical exapansion, merger and acquisitions, partnerships, and collaboration to identify the interest of potential buyers and create a large customer base. For instance,
These solutions point to a new mode of care delivery that addresses the fundamental distribution and adoption challenges that limit existing telehealth systems.
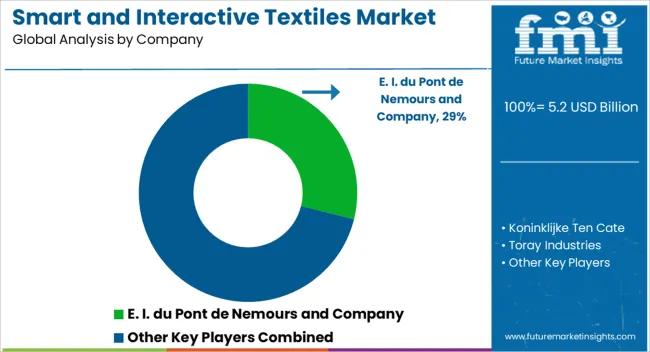
Prominent players in the smart and interactive textiles market are E. I. du Pont de Nemours and Company, Koninklijke Ten Cate, Toray Industries, Textronics, Inc., Sensoria, Inc., Milliken & Company, Globe Holding Company LLC, Interactive Wear AG, Indorama Ventures Public Company Limited, Schoeller Textil AG, Outlast Technologies LLC, D3O Lab Limited, EXO2 Limited, AiQ Smart Clothing, Inc., DuPont, Alphabet, Jabil, AIQ Smart Clothing, Sensoria, Gentherm, Interactive Wear, Outlast Technologies, Adidas, and Hexoskin, among others.
Recent Developments:
Key Players Profiled in the Global Market
The global smart and interactive textiles market is estimated to be valued at USD 5.2 billion in 2025.
The market size for the smart and interactive textiles market is projected to reach USD 48.6 billion by 2035.
The smart and interactive textiles market is expected to grow at a 24.9% CAGR between 2025 and 2035.
The key product types in smart and interactive textiles market are wearable electronics, chromic materials, _photochromic and _thermochromic.
In terms of application, industrial applications segment to command 42.6% share in the smart and interactive textiles market in 2025.


Full Research Suite comprises of:
Market outlook & trends analysis
Interviews & case studies
Strategic recommendations
Vendor profiles & capabilities analysis
5-year forecasts
8 regions and 60+ country-level data splits
Market segment data splits
12 months of continuous data updates
DELIVERED AS:
PDF EXCEL ONLINE
Smart Digital Valve Positioner Market Forecast and Outlook 2025 to 2035
Smart Card IC Market Size and Share Forecast Outlook 2025 to 2035
Smart-Tag Inlay Inserters Market Analysis - Size and Share Forecast Outlook 2025 to 2035
Smart Wheelchair Market Forecast and Outlook 2025 to 2035
Smart TV Market Forecast and Outlook 2025 to 2035
Smart/AI Toy Market Size and Share Forecast Outlook 2025 to 2035
Smart Locks Market Size and Share Forecast Outlook 2025 to 2035
Smart Sprinkler Controller Market Size and Share Forecast Outlook 2025 to 2035
Smart Indoor Gardening System Market Size and Share Forecast Outlook 2025 to 2035
Smart Building Delivery Robot Market Size and Share Forecast Outlook 2025 to 2035
Smart Watch Market Size and Share Forecast Outlook 2025 to 2035
Smart Label Market Size and Share Forecast Outlook 2025 to 2035
Smart Mat Market Size and Share Forecast Outlook 2025 to 2035
Smart Water Management Market Size and Share Forecast Outlook 2025 to 2035
Smart Built-In Kitchen Appliance Market Size and Share Forecast Outlook 2025 to 2035
Smart Cold Therapy Machine Market Size and Share Forecast Outlook 2025 to 2035
Smart Personal Assistance Devices Market Size and Share Forecast Outlook 2025 to 2035
Smart Speaker Market Size and Share Forecast Outlook 2025 to 2035
Smart Vehicle Architecture Market Size and Share Forecast Outlook 2025 to 2035
Smart City Platforms Market Size and Share Forecast Outlook 2025 to 2035

Thank you!
You will receive an email from our Business Development Manager. Please be sure to check your SPAM/JUNK folder too.
Chat With
MaRIA