

- Market Size (2026)
- USD 10.8 Bn
- Forecast (2036)
- USD 22.9 Bn
- CAGR (2026 to 2036)
- 7.8%
How big is Shipping Container Market in 2026?
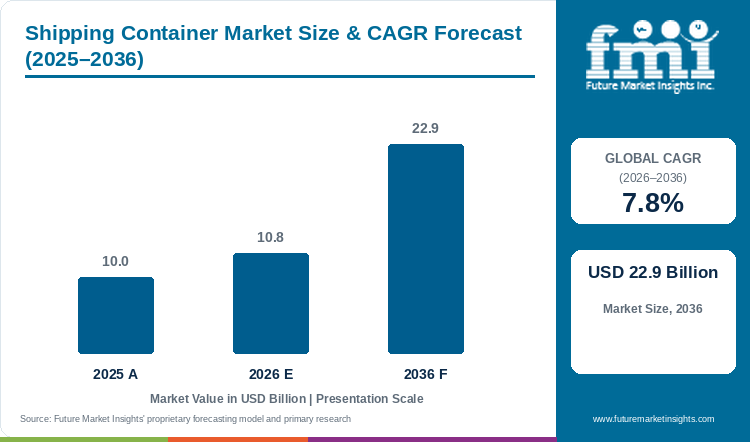
Sales in the shipping container market are projected to grow at 7.8% CAGR, with the market size rising from USD 10.0 billion in 2025 to USD 10.8 billion in 2026 and reaching USD 22.9 billion by 2036.
Port terminal bottlenecks across transoceanic shipping lanes and the need to cut cargo handling losses during ship-to-rail transfers have led maritime carriers to standardize high-cube and temperature-controlled container fleets. According to FMI, global shipping container market valuation rises from USD 10.0 billion in 2025 to USD 10.8 billion in 2026 and is projected to reach USD 22.9 billion by 2036, expanding at a 7.8% CAGR from 2026 to 2036 and generating USD 12.1 billion in added revenue. In September 2025, the United Nations Conference on Trade and Development reported that global container fleet capacity expanded by 6.7% in 2025 to accommodate longer transoceanic routing [1]. Rigid Containers & Bottles hold 40.4% of packaging format demand in 2026 because corrugated Corten steel walls prevent load crushing during nine-tier vessel stacking. However, issues such as volatile hot-rolled Corten steel pricing and empty box repositioning imbalances between Asian export hubs and Western import gateways continue to restrain carrier capital budgets.
Key Market Trends & Insights
- By packaging format: Rigid Containers & Bottles led with 40.4% share in 2026, supported by high structural racking strength, standardized ISO corner castings, and direct compatibility with ship-to-shore spreader cranes.
- By material substrate: Recycled Paperboard accounted for 32.5% in 2026, reflecting widespread deployment of heavy-duty corrugated slip sheets, honeycomb void fillers, and moisture-absorbent interior container liners that prevent cargo shifting.
- By end-use sector: Food & Beverage held 38.9% of revenue in 2026, underpinned by continuous transoceanic shipments of chilled meat, counter-seasonal fruit, and bulk agricultural commodities requiring atmosphere-controlled reefer boxes.
Regional Highlights
- Fastest-growing evaluated country: USA, at 9.5% CAGR from 2026 to 2036.
- By country: UK at 8.7%, France at 8.1%, and Canada at 7.5% follow, while Italy records the lowest evaluated CAGR at 6.2%.
Market Size & Forecast
Table 1: Market Size and Forecast for the Shipping Container Market (USD billion and CAGR percentage), 2025 to 2036
| Metric | Value |
|---|---|
| 2025 Market Size | USD 10.0 billion |
| Estimated Market Size in 2026 | USD 10.8 billion |
| Projected Market Size by 2036 | USD 22.9 billion |
| CAGR, 2026 to 2036 | 7.8% |
| Added Revenue, 2026 to 2036 | USD 12.1 billion |
Country demand conditions differ as port draft depth, inland double-stack rail clearance, and cold-storage terminal capacity vary across maritime trade corridors. FMI research indicates that ocean carriers and container leasing companies are upgrading intermodal asset fleets to survive harsh marine salt-spray environments while cutting dwell times at congested rail ramps. In June 2026, the World Shipping Council reported that out of more than 280 million containers transported across international waters in 2025, improved twist-lock lashing and stack weight verification limited losses at sea to 1,478 units [2]. Connecting vessel schedules with container journey orchestration platforms allows fleet managers to track box turnaround cycles and redirect empty equipment toward high-yield export ports.
Intermodal TEU Fleet Capacity and Corten Steel Fabrication Sizing
Table 2: TEU Fabrication Parameters and Fleet Sizing Metrics for the Shipping Container Market (USD billion and metric units), mixed historical and forecast years from 2025 to 2036
| Engineering Parameter | 2025 | 2026 | 2036 |
|---|---|---|---|
| Baseline Global Market Valuation (USD billion) | 10.0 | 10.8 | 22.9 |
| Total Operational Container Fleet (Million TEU) | 48.2 | 51.5 | 94.2 |
| Annual Newbuild Fabrication Output (Million TEU) | 3.9 | 4.1 | 7.2 |
| Smart Telemetry-Enabled Container Fleet Share (%) | 18.5% | 22.4% | 68.5% |
Calculation basis: Fleet sizing indicators align active twenty-foot equivalent unit (TEU) circulation with annual dry van and reefer replacement schedules across commercial shipyards.
Fleet Capital Expenditure & Port Terminal Handling Sizing
Containerized shipping equipment has gained wide adoption across bulk and specialized logistics because modular steel boxes eliminate break-bulk cargo handling at transfer points. Managing a profitable container fleet requires balancing newbuild box purchase prices against daily per-diem lease rates and depot repair expenses. Growing chemical, liquefied gas, and pharmaceutical trade is prompting leasing companies to expand intermodal ISO tank containers alongside standard dry vans, giving shippers a certified pressure vessel that fits directly into standard cellular container ship slots.
Table 3: Carrier Fleet Capital Expenditure and Container Spending Indicators for the Shipping Container Market (USD and percentages), mixed historical and forecast years from 2025 to 2036
| Expenditure Indicator | 2025 | 2026 | 2036 |
|---|---|---|---|
| Average Purchase Price per Standard 20ft Dry Box (USD) | 2,450 | 2,520 | 3,340 |
| Reefer Container Fleet Value Proportion (%) | 28.5% | 30.2% | 44.5% |
| Carrier Direct Ownership vs Leased Container Ratio (%) | 48:52 | 47:53 | 38:62 |
| Secondary Repurposed Container Spending Share (%) | 11.2% | 12.0% | 19.8% |
Table 4: Port Yard Stacking Footprint and Handling Efficiency Standards for the Shipping Container Market (USD billion, units, and percentages), mixed reporting years from 2024 to 2026
| Metric | Value | Basis |
|---|---|---|
| Market size, 2026 | USD 10.8 billion | Report value |
| Active global container fleet | 51.5 million TEU | 2026 fleet estimate |
| Rigid Containers & Bottles revenue, 2026 | USD 4.4 billion | 40.4% share |
| Food & Beverage end-use revenue, 2026 | USD 4.2 billion | 38.9% share |
Analyst Perspective
"Factory-fitted satellite telemetry and lighter high-tensile Corten steel panels give leasing fleets higher payload efficiency across transoceanic routes. Fluctuating hot-rolled steel coil prices and empty container repositioning imbalances still delay newbuild orders among regional carriers."
- Nandini Roy Choudhury, Principal Consultant, Future Market Insights.
How is the shipping container market segmented?
The shipping container market is segmented by packaging format, material substrate, end-use sector, and region. In 2026, Rigid Containers & Bottles is projected at 40.4%, recycled paperboard at 32.5%, and food & beverage at 38.9%.
By packaging format: Rigid containers & bottles, flexible wraps & bags, and secondary bulk packaging.
By material substrate: Recycled paperboard, thermoplastic polymers, sustainable plant fibers, and specialty alloys.
By end-use sector: Food & beverage, pharmaceuticals & healthcare, personal care & homecare, and industrial manufacturing.
Why do Rigid Containers & Bottles lead the packaging format category?
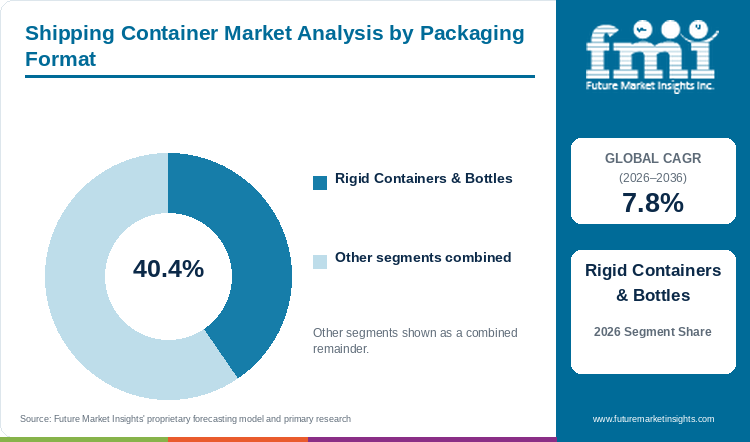
Rigid Containers & Bottles are expected to hold 40.4% of packaging format demand in 2026, supported by nine-tier vessel stacking strength.
Table 5: Packaging Format Share for the Shipping Container Market (percentage share), 2026
| Packaging Format | Share (2026) |
|---|---|
| Rigid Containers & Bottles | 40.4% |
| Other Segments Combined | 59.6%* |
| Total | 100.0% |
*Calculated as the balance remaining after deducting the leading segment's reported share from 100.0%.
Table 6: Packaging Format Leadership and Market Growth for the Shipping Container Market (segment and CAGR percentage), 2026 to 2036
| Metric | Value |
|---|---|
| Global CAGR (2026 to 2036) | 7.8% |
| Leading Segment | Rigid Containers & Bottles |
Maritime carriers and intermodal rail operators rely on rigid enclosure formats because standardized twenty-foot and forty-foot steel boxes absorb severe racking and torsional loads during rough ocean crossings. Unlike flexible bulk bags that deform under vertical compression, rigid corrugated steel walls and forged corner castings allow terminal cranes to stack laden containers up to nine tiers high on ultra-large vessels. Chemical and liquid food shippers also pair rigid outer frames with intermediate bulk containers and inner bulk liners to move non-hazardous liquids inside standard dry vans without investing in dedicated tank fleets. Procurement teams verify twist-lock dimensional tolerances and floor forklift axle ratings before approving batch deliveries.
- Rigid Containers & Bottles are projected to account for 40.4% of packaging format demand in 2026, supported by standardized twist-lock handling and multi-tier stack stability.
- In May 2025, the Institute of International Container Lessors released updated structural inspection tolerances for rigid dry van corner posts and floor cross-members [3].
What makes Recycled Paperboard central to the material substrate category?
Recycled paperboard is estimated to represent 32.5% of the material substrate category in 2026, reflecting widespread intermodal dunnage and liner use.
Inside ocean containers, cargo damage frequently occurs when palletized loads shift during vessel rolling or rail coupling impacts, which is why logistics managers use recycled paperboard slip sheets, honeycomb bulkheads, and inflatable kraft dunnage bags alongside structural steel alloys. While copper-bearing Corten steel forms the weather-resistant outer shell, recycled paperboard dunnage provides low-cost, curb-recyclable void bracing that adds minimal tare weight to the container. Export food packers also combine corrugated inner dividers with aluminum foil containers to protect shelf-stable catering trays against condensation and salt-air humidity during equatorial sea transit. Receiving warehouses prefer fiber dunnage because it enters standard cardboard balers without disposal fees.
- Recycled paperboard is estimated to hold 32.5% of material substrate demand in 2026, underpinned by high compressive bracing strength and simple destination recycling.
- In July 2025, the European Intermodal Research Advisory Council documented that high-density honeycomb paperboard bulkheads reduced pallet shift claims by 18% across rail-port corridors [4].
How does Food & Beverage anchor the end-use sector category?
Food & beverage is projected to capture 38.9% of end-use sector demand in 2026, driven by transoceanic perishable cold-chain trade.
Supermarket chains and agricultural exporters depend on containerized transport to move counter-seasonal fruits, frozen poultry, seafood, and bagged grain across hemispheres without spoilage. Modern refrigerated containers maintain tight temperature and humidity bands while regulating oxygen and carbon dioxide levels to slow respiration in fresh produce during four-week sea voyages. Expanding investments in cold chain logistics and insulated transport fleets allow food shippers to transfer reefer boxes directly from port gantry cranes onto generator-equipped highway chassis without breaking thermal integrity. However, high electricity draw at port reefer plugs and strict phytosanitary customs inspections require continuous digital temperature logging.
- Food & beverage is anticipated to contribute 38.9% of end-use sector sales in 2026, owing to year-round retail demand for imported perishable foods.
- In June 2025, the International Container Bureau recorded a 14% annual increase in registered active refrigerated container prefix codes for perishable food trade [5].
What are the drivers, restraints, and opportunities in the shipping container market?
Containerized intermodal trade expansion and port crane automation support fleet demand, whereas Corten steel price swings and empty box repositioning costs restrain margins, and factory-fitted IoT telematics create premium leasing opportunities.
- Driver:Expanding cross-border intermodal rail-port corridors and mega-vessel deployments compel ocean carriers to maintain larger standardized container pools.
- Restraint:Shipping lines face sharp fluctuations in hot-rolled Corten steel prices and high marine repositioning expenses for empty boxes accumulated at import ports.
- Opportunity:Embedding solar-powered cellular and satellite telemetry into container door hardware enables lessors to charge premium daily rates for verified cargo security.
Growth Analysis and Future Potential: Qualitative Demand Catalysts
Global manufacturers are shifting away from fragmented break-bulk shipping toward synchronized intermodal container networks so that cargo packed at an inland factory moves untouched across highway, rail, and deep-sea vessels. When ocean carriers deploy 24,000-TEU vessels, port operators must clear thousands of boxes within a single twenty-four-hour berth window to avoid demurrage penalties. Upgrading berths into automated container terminals and installing port terminal automation systems increases crane lift rates, which requires carriers to hold a larger buffer of standardized forty-foot high-cube containers across inland depots. In August 2025, ASTM International updated its A588 structural steel specification for atmospheric corrosion resistance in intermodal containers [6]. Suppliers must certify weld fatigue life before carriers sign multi-year lease contracts.
Risk Assessment of the Shipping Container Market: Operational and Formulation Friction
Newbuild container procurement remains highly sensitive to raw material cost swings because copper-bearing Corten steel panels, cast corner fittings, and marine floor plywood account for more than two-thirds of factory production costs. Whenever steel mill coil prices spike or waterborne zinc primer costs rise, container leasing companies delay speculative yard orders and extend the service life of twelve-year-old boxes through patch welding. In addition to fabrication cost pressure, persistent trade imbalances between Asian manufacturing exporters and North American or European retail importers leave millions of empty containers stranded at Western discharge terminals. In June 2026, maritime transport economists documented that empty container repositioning accounted for 19% of total fleet operating expenses [7]. Carriers consequently defer fleet expansion during freight rate downturns.
Commercial Opportunity Analysis: Formulation Differentiation and Value-Add Formats
Container manufacturers and lessors are capturing higher lease yields by turning passive steel boxes into connected logistics assets and modular industrial enclosures. Pharmaceutical, electronics, and cold-chain shippers frequently suffer cargo claims when refrigeration power disconnects at rail transfer yards or unauthorized door openings occur in transit. In November 2025, the Smart Container Working Group published updated interoperability standards for low-power satellite and cellular telemetry modules mounted on container door locking rods [8]. Integrating permanent shock, temperature, and GPS sensors with ocean freight forwarding networks allows lessors to command premium per-diem rates, while retired dry vans are increasingly remanufactured into battery energy storage enclosures. Manufacturers need weather-sealed sensor housings that survive high-pressure washdowns.
Shipping Container Market by Country (2026 to 2036)
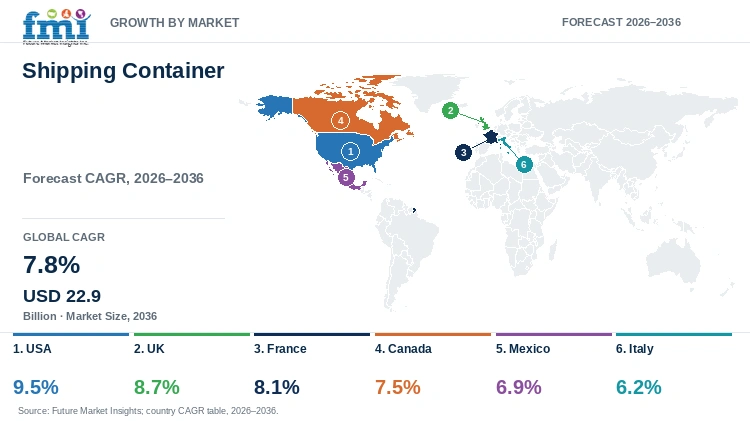
As per FMI, the United States represents the fastest-growing shipping container market among the six evaluated countries at a 9.5% CAGR from 2026 to 2036, while Italy records the slowest expansion at 6.2% CAGR. Across all evaluated economies, fleet growth is shaped by how effectively port authorities expand deep-water gantry crane capacity, connect marine berths directly to inland double-stack rail corridors, and balance import-export box flows.
Table 7: Country CAGR and Primary Growth Levers for the Shipping Container Market (CAGR percentage and operational drivers), 2026 to 2036
| Country | CAGR (2026 to 2036) | Primary Growth Lever |
|---|---|---|
| USA | 9.5% | High retail import container volume, Class I double-stack rail hubs, and port crane modernization |
| UK | 8.7% | Deep-water berth upgrades at Felixstowe and London Gateway and refrigerated food import reliance |
| France | 8.1% | Modal shift to Seine-Nord and Rhone rail-barge shuttles at Le Havre and Marseille-Fos |
| Canada | 7.5% | Pacific gateway expansion at Vancouver and Prince Rupert with balanced grain export containerization |
| Mexico | 6.9% | Nearshoring automotive and appliance manufacturing driving Manzanillo and Lazaro Cardenas throughput |
| Italy | 6.2% | Mediterranean transshipment hub upgrades at Genoa and Trieste and reefer food export demand |
Source: Future Market Insights analysis
USA Shipping Container Market Outlook (2026 to 2036)
Massive retail import volumes and long-distance inland rail distribution distinguish the United States from shorter-haul European container markets, driving a projected 9.5% CAGR from 2026 to 2036. Because forty-foot high-cube containers discharged at Los Angeles, Long Beach, and Savannah must travel over a thousand miles to inland distribution hubs in Chicago, Dallas, and Memphis, domestic logistics operators require reinforced floor structures that endure repeated double-stack rail well-car transfers. In January 2026, the U.S. Bureau of Transportation Statistics reported that the top 25 American container ports operated 583 ship-to-shore gantry cranes to accelerate vessel turnarounds [9]. However, chassis shortages and inland depot congestion often delay empty container returns, prompting U.S. intermodal carriers to lease GPS-tracked domestic fifty-three-foot and ISO forty-foot boxes under multi-year pool agreements.
Key takeaway:In the USA, high-volume coastal port throughput and long-haul double-stack railroad corridors drive sustained leasing and procurement of high-cube and smart intermodal containers.
UK Shipping Container Market Outlook (2026 to 2036)
As an island economy that imports a large share of its fresh groceries and manufactured retail goods by sea, the United Kingdom is forecast to expand at an 8.7% CAGR through 2036. In January 2026, the British Ports Association noted that deep-sea terminals at Felixstowe, Southampton, and London Gateway expanded automated stacking crane blocks to handle ultra-large container vessels calling from Asia [10]. Unlike continental European hubs with broad cross-border highway alternatives, British importers face strict post-Brexit border target operating model inspections and limited port yard acreage, which penalizes slow container dwell times. Logistics providers overcome these space constraints by deploying six-high automated yard stacking and leasing high-efficiency controlled-atmosphere reefer containers that keep imported produce fresh during customs clearance holds.
Key takeaway:In the UK, deep-sea port yard automation and heavy reliance on maritime cold-chain food imports sustain strong demand for high-density dry and refrigerated containers.
France Shipping Container Market Outlook (2026 to 2036)
French maritime logistics is shaped by a dual-coastline port architecture connecting Atlantic trade at HAROPA Port (Le Havre-Rouen-Paris) with Mediterranean routes at Marseille-Fos, supporting an 8.1% CAGR between 2026 and 2036. In February 2026, the French Maritime Cluster reported that inland river barge and electrified rail container shuttles along the Seine and Rhone axes increased modal share by 11% under national freight decarbonization mandates [11]. While highway weight limits and strict urban low-emission zones around Paris and Lyon restrict direct diesel drayage, river barge transfers require containers with certified corrosion protection against prolonged damp hold conditions. French chemical, wine, and aerospace exporters consequently favor leased ISO tank containers and thermally insulated boxes tailored for combined rail-waterway transit.
Key takeaway:In France, state-backed rail-river modal shift programs and high-value wine and chemical exports anchor demand for specialized tank, reefer, and intermodal containers.
Canada Shipping Container Market Outlook (2026 to 2036)
Extreme winter temperature swings across transcontinental rail routes and balanced two-way agricultural export flows set Canada apart from import-heavy peers, with demand projected to rise at a 7.5% CAGR through 2036. Pacific terminals at Vancouver and Prince Rupert offer the shortest steaming distance from Northeast Asia to North America, transferring inbound boxes directly onto Class I double-stack trains bound for Toronto, Montreal, and the U.S. Midwest. In March 2026, Transport Canada documented that containerized grain, pulse, and potash export loadings helped offset inbound retail container flows across western rail corridors [12]. Because sub-zero prairie winters cause brittle fracture in standard carbon steel and stiffening in door gaskets, Canadian rail and maritime operators specify low-temperature impact-tested Corten steel and EPDM seals.
Key takeaway:In Canada, Pacific gateway rail integration and high outbound agricultural containerization support steady fleet utilization and cold-weather container specifications.
Mexico Shipping Container Market Outlook (2026 to 2036)
Rapid industrial nearshoring across northern and central assembly clusters is transforming Mexico from a regional transshipment stop into a primary intermodal manufacturing corridor, propelling a 6.9% CAGR from 2026 to 2036. Automotive, electronics, and household appliance plants in Nuevo Leon, Coahuila, and Guanajuato import Asian sub-assemblies through Pacific ports at Manzanillo and Lazaro Cardenas before shipping finished goods north in fifty-three-foot and forty-foot high-cube containers. In April 2026, the Mexican Institute of Transportation recorded a 16% rise in bonded intermodal rail container movements between Pacific terminals and cross-border gateways [13]. However, mountainous rail grades, customs security checks, and highway cargo theft risks require shippers to adopt tamper-evident electronic door locks and reinforced rigid containers.
Key takeaway:In Mexico, nearshoring factory supply chains and expanding Pacific port rail links drive demand for high-cube dry containers and GPS-secured intermodal equipment.
Italy Shipping Container Market Outlook (2026 to 2036)
Operating as a central Mediterranean peninsula bridging Suez-bound Asian shipping lanes with Alpine rail tunnels into central Europe, Italy is projected to register a 6.2% CAGR through 2036. Deep-water ports at Genoa, Trieste, La Spezia, and Gioia Tauro handle high volumes of transshipment boxes alongside outbound exports of Italian machinery, ceramic tiles, olive oil, and pharmaceuticals. In May 2026, the Italian Port Association (Assoporti) reported that rail-linked container handling at northern Adriatic and Ligurian terminals rose 9% following Terzo Valico corridor upgrades [14]. Because historic coastal port yards face tight land boundaries encircled by urban districts, Italian terminal operators and freight forwarders prioritize high-stack rigid containers and energy-efficient reefer units that minimize yard dwell footprint.
Key takeaway:In Italy, Mediterranean transshipment positioning and Alpine rail-port connectivity sustain steady replacement and leasing demand for dry and refrigerated containers.
Full report country CAGRs cover: North America; Latin America; Western Europe; Eastern Europe; East Asia; South Asia and Pacific; Middle East and Africa.
Who are the notable companies in the shipping container market?
China International Marine Containers (CIMC), CXIC Group, Singamas Container Holdings, Maersk Container Industry, Triton International, Textainer Group, SeaCube Container Leasing, and CAI International are the significant market players in this market.
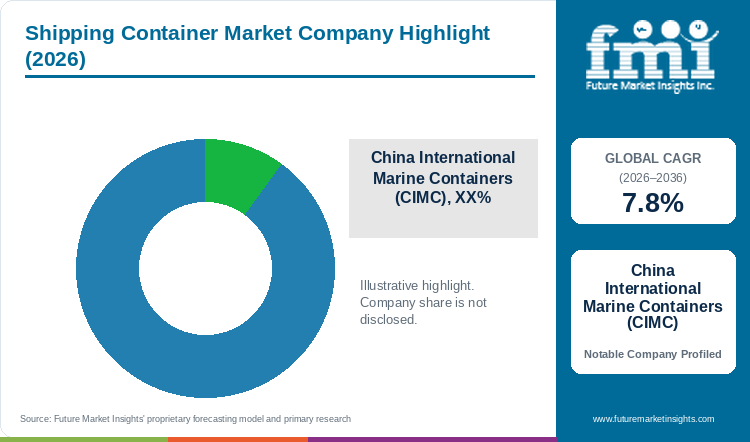
FMI data suggests that industry competition splits between high-volume container fabrication conglomerates and global intermodal equipment leasing firms. Manufacturing yards concentrated along coastal Chinese industrial zones operate automated steeldecoiling, stamping, robotic welding, and waterborne zinc-coating lines that supply over four-fifths of global newbuild dry and refrigerated boxes. Meanwhile, international leasing companies finance and manage multi-million-TEU asset pools, providing ocean carriers with flexible master leases and depot repair coverage across hundreds of ports. Buyers evaluate suppliers on Corten steel weld integrity, tare weight reduction, and factory-installed telemetry readiness.
- Global Container Fabrication Conglomerates: China International Marine Containers (CIMC), CXIC Group, and Singamas Container Holdings manufacture standard dry vans, high-cube boxes, and specialized industrial containers.
- Specialized Refrigerated Box Manufacturers: Maersk Container Industry and Daikin Reefer engineer thermally insulated reefer boxes and controlled-atmosphere cooling machinery.
- Container Equipment Leasing Enterprises: Triton International, Textainer Group, SeaCube Container Leasing, and CAI International manage global dry, reefer, and tank container lease portfolios.
Competitive Benchmarking: Shipping Container Market
Table 8: Competitive Benchmarking for the Shipping Container Market (qualitative capability ratings), 2026
| Company | Fabrication Capacity Depth | Smart IoT Fleet Integration | Global Depot Network Scope | Geographic Reach |
|---|---|---|---|---|
| China International Marine Containers (CIMC) | High | High | High | High |
| CXIC Group | High | Medium | Medium | High |
| Singamas Container Holdings | High | Medium | High | High |
| Maersk Container Industry | Medium | High | High | High |
| Triton International | Medium | High | High | High |
| Textainer Group | Medium | High | High | High |
| SeaCube Container Leasing | Medium | High | Medium | High |
| CAI International | Medium | Medium | Medium | High |
Scoring basis: Fabrication Capacity Depth is High when public records confirm multi-line automated box output exceeding 500,000 TEU annually, and Medium when specialized or lessor-focused. Smart IoT Fleet Integration is High when factory-installed cellular or satellite transceivers are deployed at scale. Global Depot Network Scope is High when maintenance and off-hire depots span over 50 international ports. Geographic Reach reflects multi-regional commercial supply.
Key Developments in the Shipping Container Market
- In March 2025, China International Marine Containers (CIMC) commissioned an upgraded automated dry container stamping and robotic welding line in Qingdao, raising annual energy-efficient box output capacity by 25% [15].
- In July 2025, Triton International completed a fleet digitization rollout, equipping more than 100,000 newly built dry freight containers with factory-fitted cellular and satellite tracking transceivers [16].
- In November 2025, Maersk Container Industry introduced its upgraded Star Cool CA+ controlled-atmosphere refrigeration unit designed to cut compressor electrical consumption on long-haul perishable voyages [17].
- In January 2026, Singamas Container Holdings expanded its specialized fabrication division by opening a dedicated production line for modular battery energy storage enclosures and customized high-cube containers [18].
Key Players in the Shipping Container Market
Global Container Fabrication Conglomerates
- China International Marine Containers (CIMC)
- CXIC Group
- Singamas Container Holdings
Specialized Refrigerated Box Manufacturers
- Maersk Container Industry
- Daikin Reefer
Container Equipment Leasing Enterprises
- Triton International
- Textainer Group
- SeaCube Container Leasing
Shipping Container Market - Report Scope
Table 9: Report Scope for the Shipping Container Market (coverage fields and definitions), 2026 to 2036
| Coverage field | Report scope |
|---|---|
| Market breakdown | Packaging Format; Material Substrate; End-Use Sector; Region |
| Quantitative Units | USD Billion |
| Market Definition | Includes manufacturer and lessor revenue from standard dry freight, high-cube, refrigerated, and specialized intermodal shipping containers and in-scope dunnage components. Excludes ocean vessel chartering fees and port stevedoring service charges. |
| Regions Covered | North America; Latin America; Western Europe; Eastern Europe; East Asia; South Asia and Pacific; Middle East and Africa |
| Countries Covered | USA, UK, France, Canada, Mexico, Italy, and additional countries in the full report |
| Key Companies Covered | China International Marine Containers (CIMC), CXIC Group, Singamas Container Holdings, Maersk Container Industry, Triton International, Textainer Group, SeaCube Container Leasing, CAI International |
| Forecast Period | 2026 to 2036 |
| Approach | Primary and secondary research with rigorous market triangulation. |
Shipping Container Market - Research Methodology
Table 10: Research Methodology for the Shipping Container Market (research methods and approach), 2026 edition
| Method | Approach |
|---|---|
| Primary Research | Primary interviews were conducted with container fabrication plant directors, equipment leasing executives, ocean carrier fleet managers, intermodal rail operators, and marine inspection specialists to validate production volumes, structural standards, and leasing dynamics. |
| Secondary Research | Secondary research included corporate annual filings, investor disclosures, maritime transport registries, international container standards, port authority throughput bulletins, and publicly available trade publications relevant to intermodal containers. |
| Market Sizing and Forecasting | Market sizing and forecasting for the 2026 to 2036 assessment period were developed using top-down and bottom-up approaches to evaluate active TEU fleet capacity, annual replacement production, and unit price points. |
| Data Triangulation and Validation | Data is validated against maritime trade indicators, port crane lift statistics, steel feedstock trends, and historical fleet utilization records to ensure high accuracy without double counting adjacent logistics services. |
Shipping Container Market by Segments
Shipping Container Market segmented by Packaging Format:
- Rigid Containers & Bottles
- Flexible Wraps & Bags
- Secondary Bulk Packaging
Shipping Container Market segmented by Material Substrate:
- Recycled Paperboard
- Thermoplastic Polymers
- Sustainable Plant Fibers
- Specialty Alloys
Shipping Container Market segmented by End-Use Sector:
- Food & Beverage
- Pharmaceuticals & Healthcare
- Personal Care & Homecare
- Industrial Manufacturing
Shipping Container Market by Region
- North America
- United States
- Canada
- Latin America
- Brazil
- Mexico
- Argentina
- Chile
- Western Europe
- Germany
- France
- United Kingdom
- Italy
- Spain
- Benelux
- Nordics
- Eastern Europe
- Poland
- Czech Republic
- Romania
- Hungary
- East Asia
- China
- Japan
- South Korea
- South Asia and Pacific
- India
- ASEAN
- Australia and New Zealand
- Middle East and Africa
- GCC Countries
- South Africa
- Türkiye
- Israel
Research Sources and Bibliography
- [1] United Nations Conference on Trade and Development (UNCTAD). (2025, September 24). Review of Maritime Transport 2025: Freight Rates, Container Fleet Capacity, and Maritime Transport Costs. UNCTAD Official Publications.
- [2] World Shipping Council. (2026, June 25). Containers Lost at Sea Report: 2026 Update and Global Fleet Operations Overview. WSC Industry Reports.
- [3] Institute of International Container Lessors (IICL). (2025, May 22). Technical standards for container inspection and repair: Dry van and reefer structural tolerances. IICL Technical Bulletins, 19(2), 34-51.
- [4] European Intermodal Research Advisory Council. (2025, July 20). Multimodal rail-port logistics and honeycomb dunnage integrity in European freight corridors. EIRAC Technical Papers, 14(3), 88-104.
- [5] International Container Bureau (BIC). (2025, June 16). Global container prefix code registrations and refrigerated fleet census. BIC Official Directory, 2025 Edition.
- [6] American Society for Testing and Materials (ASTM). (2025, August 24). Standard specification for atmospheric corrosion-resistant structural steel for intermodal containers. ASTM Standards, A588/A588M-25.
- [7] International Journal of Transport Economics. (2026, June 14). Container repositioning economics and global trade imbalance cost dynamics. IJTE Research Studies, 53(2), 210-228.
- [8] Smart Container Working Group. (2025, November 16). IoT telematics standards and satellite tracking architecture for intermodal freight. SCWG Whitepaper Series, 8(1), 45-62.
- [9] United States Bureau of Transportation Statistics. (2026, January 10). Port Performance Freight Statistics: 2026 Annual Report. U.S. Department of Transportation.
- [10] British Ports Association. (2026, January 14). Deep-sea port container throughput and automated stacking capacity in the United Kingdom. BPA Annual Statistical Review, 2026-01.
- [11] French Maritime Cluster. (2026, February 18). Logistics performance of French Atlantic and Mediterranean rail-river container gateways. CMF Policy Papers, 2026-02.
- [12] Transport Canada. (2026, March 20). Transportation in Canada annual report: Marine and double-stack rail freight performance. Government of Canada Publications.
- [13] Mexican Institute of Transportation (IMT). (2026, April 24). Nearshoring manufacturing impacts on bonded container traffic across Mexican ports. IMT Research Bulletins, 33(2), 77-93.
- [14] Italian Port Association (Assoporti). (2026, May 18). Container throughput dynamics across Italian Mediterranean transshipment hubs. Assoporti Economic Reports, 2026-05.
- [15] China International Marine Containers (CIMC). (2025, March 28). Inauguration of automated dry container fabrication and welding lines in Qingdao. CIMC Corporate Press Releases.
- [16] Triton International. (2025, July 14). Strategic fleet modernization: Deploying factory-fitted smart IoT telematics across dry container assets. Triton Investor Disclosures.
- [17] Maersk Container Industry. (2025, November 20). Commercial rollout of energy-optimized Star Cool CA+ controlled-atmosphere refrigeration units. MCI Product Releases.
- [18] Singamas Container Holdings. (2026, January 26). Commissioning of specialized modular energy storage and customized high-cube container facilities. Singamas Operations Briefings.
- [19] Textainer Group Holdings. (2026, April 15). Expansion of low-GWP refrigerated container lease portfolio for global perishable trade. Textainer Corporate Announcements.
- [20] SeaCube Container Leasing. (2025, August 19). Deployment of solar-assisted intermodal reefer assets across North American cold-chain corridors. SeaCube Fleet Updates.
- [21] United Nations Conference on Trade and Development (UNCTAD). (2025, September 24). Maritime Trade Under Pressure: Global Shipping and Port Reconfiguration Assessment. UNCTAD Maritime Statistics.
This bibliography is provided for reader reference and is not exhaustive. The full report contains the complete reference list and detailed citations.
This Report Answers
- How large is the shipping container market in 2026 and what is forecast for 2036?
- Which intermodal trade and port automation pressures support demand for shipping containers?
- Why do Rigid Containers & Bottles lead the packaging format category?
- Why does recycled paperboard hold a major share in the material substrate category?
- How do growth rates prominently differ across the USA, the UK, France, and Canada?
- Which leading companies manufacture and lease intermodal containers today?
- What limits fleet expansion or supplier switching in the shipping container market?
- What should buyers evaluate deeply before purchasing or leasing shipping containers?
Frequently Asked Questions
How big is the shipping container market in 2026, and what is forecast for 2036?
The global shipping container market is projected to reach USD 10.8 billion in 2026. Valuation is forecast to reach USD 22.9 billion by 2036, supported by expanding containerized ocean trade and double-stack rail logistics.
What is the CAGR for the shipping container market from 2026 to 2036?
As per FMI, the shipping container market is projected to expand at a 7.8% CAGR from 2026 to 2036. Growth is underpinned by automated container terminal upgrades and rising replacement demand for high-cube dry and reefer boxes.
Which packaging format segment leads the shipping container market?
Rigid Containers & Bottles hold 40.4% share of packaging format demand in 2026. The segment leads because corrugated Corten steel walls and standardized corner castings support nine-tier vessel stacking and rapid crane transfers.
Which end-use sector holds the largest share in the shipping container market?
Food & beverage accounts for 38.9% of end-use sector revenue in 2026. Demand is driven by year-round international shipments of fresh fruit, chilled meat, seafood, and bulk grain inside temperature-controlled and dry containers.
Which country has a notable growth outlook during the assessment period?
FMI finds that the United States is projected to register a 9.5% CAGR from 2026 to 2036. Expansion is supported by high retail import throughput at coastal ports and extensive inland Class I double-stack rail corridors.
Who are the key players in the market?
Notable market participants include China International Marine Containers (CIMC), CXIC Group, Singamas Container Holdings, Maersk Container Industry, Triton International, Textainer Group, SeaCube Container Leasing, and CAI International. These companies focus on automated Corten steel welding, controlled-atmosphere refrigeration, and factory-installed IoT tracking.
Preview the report firsthand - request a free sample
Get SampleGet the brochure for pricing and purchase details.
Get PDFTable of Content
- Key Takeaways
- Market Size and CAGR
- Top Growth Driver
- Fastest Growing Segment
- Leading Region
- Key Companies
- Emerging Opportunities
- Executive Summary
- Global Market Outlook
- Demand-side Trends
- Supply-side Trends
- Technology Roadmap Analysis
- Analysis and Recommendations
- Analyst Perspective (What is happening? Why now? What should investors know?)
- Key Questions Answered
- How large is the market?
- What is the CAGR?
- What are key trends?
- Which region dominates?
- Who are the leaders?
- Market Overview
- Market Coverage / Taxonomy
- Market Definition / Scope / Limitations
- Research Methodology
- Chapter Orientation
- Analytical Lens and Working Hypotheses
- Market Structure, Signals, and Trend Drivers
- Benchmarking and Cross-market Comparability
- Market Sizing, Forecasting, and Opportunity Mapping
- Research Design and Evidence Framework
- Desk Research Programme (Secondary Evidence)
- Expert Input and Fieldwork (Primary Evidence)
- Tooling, Models, and Reference Databases
- Data Engineering and Model Build
- Quality Assurance and Audit Trail
- Market Background
- Market Dynamics (Drivers, Restraints, Opportunity, Trends)
- Scenario Forecast (Optimistic, Likely, Conservative)
- Impact Analysis
- AI Impact
- Sustainability Impact
- Regulatory Impact
- Technology Impact
- Consumer / Buyer Analysis
- Purchase Drivers
- Adoption Barriers
- Buyer Journey
- Opportunity Map Analysis
- Product Life Cycle Analysis
- Supply Chain Analysis
- Investment Feasibility Matrix
- Value Chain Analysis
- PESTLE and Porter's Analysis
- Regulatory Landscape
- Regional Parent Market Outlook
- Production and Consumption Statistics
- Import and Export Statistics
- Global Market Analysis and Forecast, 2021 to 2036
- Historical Market Size Value (USD Billion) Analysis, 2021 to 2025
- Current and Future Market Size Value (USD Billion) Projections, 2026 to 2036
- Y-o-Y Growth Trend Analysis
- Absolute $ Opportunity Analysis
- Global Market Pricing Analysis, 2021 to 2036
- Global Market Analysis and Forecast, By Packaging Format, 2021 to 2036
- Introduction / Key Findings
- Historical Market Size Value (USD Billion) Analysis By Packaging Format, 2021 to 2025
- Current and Future Market Size Value (USD Billion) Analysis and Forecast By Packaging Format, 2026 to 2036
- Rigid Containers & Bottles
- Flexible Wraps & Bags
- Secondary Bulk Packaging
- Y-o-Y Growth Trend Analysis By Packaging Format, 2021 to 2025
- Absolute $ Opportunity Analysis By Packaging Format, 2026 to 2036
- Global Market Analysis and Forecast, By Material Substrate, 2021 to 2036
- Introduction / Key Findings
- Historical Market Size Value (USD Billion) Analysis By Material Substrate, 2021 to 2025
- Current and Future Market Size Value (USD Billion) Analysis and Forecast By Material Substrate, 2026 to 2036
- Recycled Paperboard
- Thermoplastic Polymers
- Sustainable Plant Fibers
- Specialty Alloys
- Y-o-Y Growth Trend Analysis By Material Substrate, 2021 to 2025
- Absolute $ Opportunity Analysis By Material Substrate, 2026 to 2036
- Global Market Analysis and Forecast, By End-Use Sector, 2021 to 2036
- Introduction / Key Findings
- Historical Market Size Value (USD Billion) Analysis By End-Use Sector, 2021 to 2025
- Current and Future Market Size Value (USD Billion) Analysis and Forecast By End-Use Sector, 2026 to 2036
- Food & Beverage
- Pharmaceuticals & Healthcare
- Personal Care & Homecare
- Industrial Manufacturing
- Y-o-Y Growth Trend Analysis By End-Use Sector, 2021 to 2025
- Absolute $ Opportunity Analysis By End-Use Sector, 2026 to 2036
- Global Market Analysis and Forecast, By Region, 2021 to 2036
- Introduction
- Historical Market Size Value (USD Billion) Analysis By Region, 2021 to 2025
- Current Market Size Value (USD Billion) Analysis and Forecast By Region, 2026 to 2036
- North America
- Latin America
- Western Europe
- Eastern Europe
- East Asia
- South Asia and Pacific
- Middle East and Africa
- Market Attractiveness Analysis By Region
- North America Market Analysis and Forecast, By Country, 2021 to 2036
- Historical Market Size Value (USD Billion) Trend Analysis By Market Taxonomy, 2021 to 2025
- Market Size Value (USD Billion) Forecast By Market Taxonomy, 2026 to 2036
- By Country
- United States
- Canada
- By Packaging Format
- By Material Substrate
- By End-Use Sector
- By Country
- Market Attractiveness Analysis
- By Country
- By Packaging Format
- By Material Substrate
- By End-Use Sector
- Key Takeaways
- Latin America Market Analysis and Forecast, By Country
- Historical Market Size Value (USD Billion) Trend Analysis By Market Taxonomy, 2021 to 2025
- Market Size Value (USD Billion) Forecast By Market Taxonomy, 2026 to 2036
- By Country
- Brazil
- Mexico
- Argentina
- Chile
- By Packaging Format
- By Material Substrate
- By End-Use Sector
- By Country
- Market Attractiveness Analysis
- By Country
- By Packaging Format
- By Material Substrate
- By End-Use Sector
- Key Takeaways
- Western Europe Market Analysis and Forecast, By Country
- Historical Market Size Value (USD Billion) Trend Analysis By Market Taxonomy, 2021 to 2025
- Market Size Value (USD Billion) Forecast By Market Taxonomy, 2026 to 2036
- By Country
- Germany
- France
- United Kingdom
- Italy
- Spain
- Benelux
- Nordics
- By Packaging Format
- By Material Substrate
- By End-Use Sector
- By Country
- Market Attractiveness Analysis
- By Country
- By Packaging Format
- By Material Substrate
- By End-Use Sector
- Key Takeaways
- Eastern Europe Market Analysis and Forecast, By Country
- Historical Market Size Value (USD Billion) Trend Analysis By Market Taxonomy, 2021 to 2025
- Market Size Value (USD Billion) Forecast By Market Taxonomy, 2026 to 2036
- By Country
- Poland
- Czech Republic
- Romania
- Hungary
- By Packaging Format
- By Material Substrate
- By End-Use Sector
- By Country
- Market Attractiveness Analysis
- By Country
- By Packaging Format
- By Material Substrate
- By End-Use Sector
- Key Takeaways
- East Asia Market Analysis and Forecast, By Country
- Historical Market Size Value (USD Billion) Trend Analysis By Market Taxonomy, 2021 to 2025
- Market Size Value (USD Billion) Forecast By Market Taxonomy, 2026 to 2036
- By Country
- China
- Japan
- South Korea
- By Packaging Format
- By Material Substrate
- By End-Use Sector
- By Country
- Market Attractiveness Analysis
- By Country
- By Packaging Format
- By Material Substrate
- By End-Use Sector
- Key Takeaways
- South Asia and Pacific Market Analysis and Forecast, By Country
- Historical Market Size Value (USD Billion) Trend Analysis By Market Taxonomy, 2021 to 2025
- Market Size Value (USD Billion) Forecast By Market Taxonomy, 2026 to 2036
- By Country
- India
- ASEAN
- Australia and New Zealand
- By Packaging Format
- By Material Substrate
- By End-Use Sector
- By Country
- Market Attractiveness Analysis
- By Country
- By Packaging Format
- By Material Substrate
- By End-Use Sector
- Key Takeaways
- Middle East and Africa Market Analysis and Forecast, By Country
- Historical Market Size Value (USD Billion) Trend Analysis By Market Taxonomy, 2021 to 2025
- Market Size Value (USD Billion) Forecast By Market Taxonomy, 2026 to 2036
- By Country
- GCC Countries
- South Africa
- Türkiye
- Israel
- By Packaging Format
- By Material Substrate
- By End-Use Sector
- By Country
- Market Attractiveness Analysis
- By Country
- By Packaging Format
- By Material Substrate
- By End-Use Sector
- Key Takeaways
- Key Countries Market Analysis
- United States
- Pricing Analysis
- Market Share Analysis, 2025
- By Packaging Format
- By Material Substrate
- By End-Use Sector
- Canada
- Pricing Analysis
- Market Share Analysis, 2025
- By Packaging Format
- By Material Substrate
- By End-Use Sector
- Mexico
- Pricing Analysis
- Market Share Analysis, 2025
- By Packaging Format
- By Material Substrate
- By End-Use Sector
- Brazil
- Pricing Analysis
- Market Share Analysis, 2025
- By Packaging Format
- By Material Substrate
- By End-Use Sector
- Chile
- Pricing Analysis
- Market Share Analysis, 2025
- By Packaging Format
- By Material Substrate
- By End-Use Sector
- Germany
- Pricing Analysis
- Market Share Analysis, 2025
- By Packaging Format
- By Material Substrate
- By End-Use Sector
- United Kingdom
- Pricing Analysis
- Market Share Analysis, 2025
- By Packaging Format
- By Material Substrate
- By End-Use Sector
- Italy
- Pricing Analysis
- Market Share Analysis, 2025
- By Packaging Format
- By Material Substrate
- By End-Use Sector
- Spain
- Pricing Analysis
- Market Share Analysis, 2025
- By Packaging Format
- By Material Substrate
- By End-Use Sector
- France
- Pricing Analysis
- Market Share Analysis, 2025
- By Packaging Format
- By Material Substrate
- By End-Use Sector
- India
- Pricing Analysis
- Market Share Analysis, 2025
- By Packaging Format
- By Material Substrate
- By End-Use Sector
- ASEAN
- Pricing Analysis
- Market Share Analysis, 2025
- By Packaging Format
- By Material Substrate
- By End-Use Sector
- Australia and New Zealand
- Pricing Analysis
- Market Share Analysis, 2025
- By Packaging Format
- By Material Substrate
- By End-Use Sector
- China
- Pricing Analysis
- Market Share Analysis, 2025
- By Packaging Format
- By Material Substrate
- By End-Use Sector
- Japan
- Pricing Analysis
- Market Share Analysis, 2025
- By Packaging Format
- By Material Substrate
- By End-Use Sector
- South Korea
- Pricing Analysis
- Market Share Analysis, 2025
- By Packaging Format
- By Material Substrate
- By End-Use Sector
- Poland
- Pricing Analysis
- Market Share Analysis, 2025
- By Packaging Format
- By Material Substrate
- By End-Use Sector
- Hungary
- Pricing Analysis
- Market Share Analysis, 2025
- By Packaging Format
- By Material Substrate
- By End-Use Sector
- Türkiye
- Pricing Analysis
- Market Share Analysis, 2025
- By Packaging Format
- By Material Substrate
- By End-Use Sector
- South Africa
- Pricing Analysis
- Market Share Analysis, 2025
- By Packaging Format
- By Material Substrate
- By End-Use Sector
- United States
- Market Structure Analysis
- Competition Dashboard
- Competition Benchmarking
- Market Share Analysis of Top Players
- By Regional
- By Packaging Format
- By Material Substrate
- By End-Use Sector
- Emerging Startups
- Innovation Benchmarking
- Competition Analysis
- Competition Deep Dive
- China International Marine Containers (CIMC)
- Overview
- Product Portfolio
- Profitability by Market Segments
- Sales Footprint
- Strategy Overview
- Marketing Strategy
- Product Strategy
- Channel Strategy
- CXIC Group
- Singamas Container Holdings
- Maersk Container Industry
- Triton International
- Textainer Group
- SeaCube Container Leasing
- CAI International
- Daikin Reefer
- China International Marine Containers (CIMC)
- Case Studies
- Success Stories
- Recent Developments
- Competition Deep Dive
- Assumptions & Acronyms Used


