The Sensor Fusion Market is estimated to be valued at USD 8.1 billion in 2025 and is projected to reach USD 34.9 billion by 2035, registering a compound annual growth rate (CAGR) of 15.8% over the forecast period.
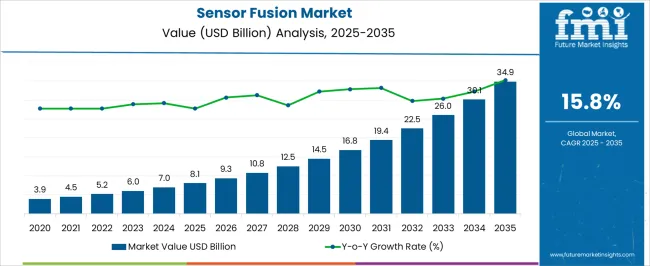
| Metric | Value |
|---|---|
| Sensor Fusion Market Estimated Value in (2025 E) | USD 8.1 billion |
| Sensor Fusion Market Forecast Value in (2035 F) | USD 34.9 billion |
| Forecast CAGR (2025 to 2035) | 15.8% |
The sensor fusion market is expanding rapidly as industries increasingly depend on multi sensor integration for accuracy, efficiency, and safety in complex environments. The growing adoption of advanced driver assistance systems, autonomous mobility solutions, and smart devices has been a primary catalyst for this growth.
By combining data from multiple sensors, sensor fusion enables improved perception, enhanced decision making, and greater system reliability compared to standalone sensor inputs. Continuous advancements in microelectronics, signal processing algorithms, and artificial intelligence are strengthening the scope of sensor fusion technologies across automotive, consumer electronics, and industrial automation.
Regulatory frameworks promoting vehicle safety, coupled with rising consumer expectations for connected and intelligent devices, are further reinforcing demand. With technological convergence across sectors, the market outlook remains robust, with sensor fusion positioned as a foundational enabler of next generation intelligent systems.
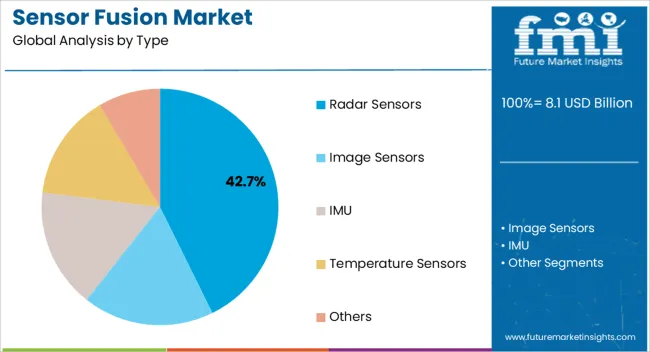
The radar sensors type segment is projected to hold 42.70% of the total revenue by 2025, positioning it as the leading segment. Its dominance is supported by the ability to provide precise object detection, velocity measurement, and distance estimation under various environmental conditions.
Radar sensors are widely integrated in automotive safety systems due to their reliability in low visibility scenarios such as fog, rain, or darkness. They are also valued in industrial and defense applications where high accuracy and robustness are essential.
The growing demand for advanced driver assistance and collision avoidance systems has further accelerated their adoption, strengthening radar sensors as the most significant type segment.
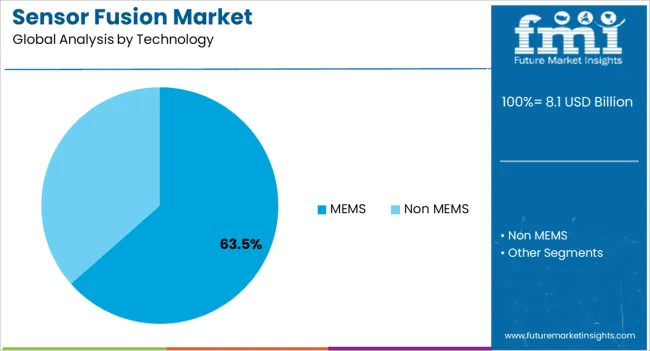
The MEMS technology segment is expected to account for 63.50% of market revenue by 2025, making it the leading technology category. This growth is being driven by the miniaturization of sensors, cost effectiveness, and their integration capability in compact devices.
MEMS sensors are essential for providing motion tracking, orientation detection, and environmental monitoring in smartphones, wearables, and connected devices. In automotive applications, they support stability control, navigation, and driver assistance functionalities.
Their scalability and energy efficiency have further advanced adoption across industries. The broad applicability and adaptability of MEMS technology have positioned it as the cornerstone of the sensor fusion landscape.
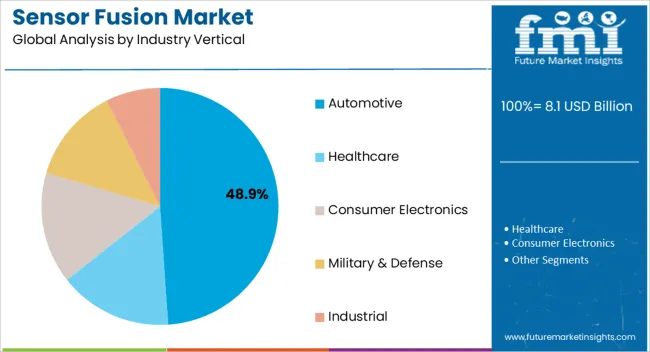
The automotive industry vertical segment is projected to capture 48.90% of total revenue by 2025, making it the dominant application area. This leadership is fueled by rising demand for autonomous vehicles, safety compliance requirements, and connected car technologies.
Automotive manufacturers are integrating sensor fusion systems to enable features such as adaptive cruise control, lane keeping assistance, collision detection, and automated parking. Regulatory mandates for vehicle safety and growing consumer preference for advanced driving features are accelerating investment in sensor fusion.
With increasing emphasis on mobility innovation, the automotive industry continues to be the primary driver of adoption, reinforcing its position as the largest industry vertical in the sensor fusion market.
The global sensor fusion market is projected to witness a CAGR of 16.5% from 2025 to 2035. It showcased a considerable CAGR of around 19.6% during the historical period from 2020 to 2024.
With increasing adoption of advanced driver assistance systems (ADAS) and autonomous driving technologies, the automotive sector witnessed a surging sensor fusion demand. Integrating data from multiple sensors such as cameras, LiDAR, radar, and ultrasonic sensors enabled vehicles to accurately perceive their surroundings and make informed decisions.
In the aerospace sector, sensor fusion became essential for navigation, guidance, and control systems. Aircraft demanded sensor fusion to combine data from various sensors such as gyroscopes, accelerometers, magnetometers, and GPS receivers. It enabled them to achieve precise positioning, maintain stability, and navigate accurately in complex airspace, thereby boosting sales.
Sensor fusion played a critical role in the development of robots for industrial automation, healthcare, and other sectors. Robots were able to perceive their environment, manipulate objects with precision, and ensure safe interactions with humans. This was made possible by fusing data from different sensors such as vision sensors, force/torque sensors, and proximity sensors, which soared demand.
Sensor fusion also found applications in sports performance tracking and virtual reality systems in the last 5 years. This is attributed to its ability to combine data from multiple sensors.
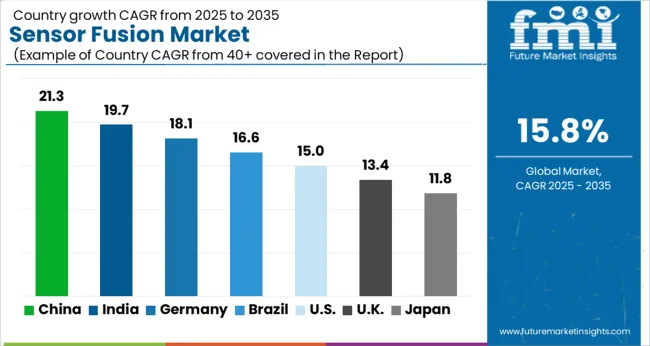
Need for Enhancing Risk Mitigation in the United States to Propel Sales of Multi Sensor Fusion
The United States sensor fusion industry is projected to create an absolute dollar opportunity of USD 34.9 billion in the next ten years. It is set to reach a valuation of USD 3.4 billion by 2035.
One of the primary drivers in the country is advancements in autonomous vehicles and transportation systems. Integration of sensor fusion technology enables these vehicles to gather and process data from multiple sensors, ensuring accurate perception and decision-making capabilities.
There is also a growing focus on improving industrial safety and risk mitigation. Here, sensor fusion plays a crucial role in combining data from various sensors to detect potential hazards and take proactive measures. It is anticipated to aid sensor fusion sales in the United States.
Increasing adoption of the internet of things (IoT) and connected devices across sectors has also contributed to surging demand for sensor fusion. By integrating data from multiple sensors, organizations can achieve real-time data analysis and gain actionable insights, enabling better decision-making and operational efficiency.
Need for Advanced Robotics in China to Fuel Demand for Sensor Fusion Algorithm
China sensor fusion market is estimated to witness a CAGR of 18.0% from 2025 to 2035. It exhibited an exceptional CAGR of 21.9% during the historical period.
Sales of sensor fusion in China are on the rise, propelled by several key factors driving demand for this technology. One of the main drivers is rapid growth of autonomous vehicles and transportation systems in the country. Sensor fusion plays a crucial role in these advanced vehicles by combining data from multiple sensors to ensure accurate perception and decision-making capabilities.
China is also witnessing a significant adoption of advanced robotics and industrial automation. Here, sensor fusion is considered to be essential for integrating data from different sensors to enable efficient and intelligent automation processes. It would further help to support the market.
Government initiatives and policies promoting the development of smart cities have also contributed to increasing demand for sensor fusion in China. As cities in the country strive to become smarter and more interconnected, sensor fusion technology plays a vital role in integrating data from various sensors. It would further enable real-time data analysis, as well as facilitate improved urban planning, resource management, and citizen services.
Demand for Sensor Fusion & Tracking to Rise in the United Kingdom with Growing Research Work
The United Kingdom sensor fusion market is predicted to reach a valuation of USD 606.4 million in 2035. It is projected to witness a CAGR of 14.7% in the estimated time frame.
The United Kingdom has the potential to be a prominent hub for sensor fusion vendors due to several factors. It has a strong and vibrant technology sector with expertise in various fields, including sensor technologies and data analytics. This favorable ecosystem provides a conducive environment for sensor fusion vendors to thrive and innovate.
The United Kingdom has a rich history of research and development in advanced technologies. With renowned universities and research institutions, the country fosters an environment that encourages innovation & technological advancements. This research expertise can be leveraged by sensor fusion vendors to develop cutting-edge algorithms and systems.
The United Kingdom has a diverse range of sectors, including automotive, aerospace, healthcare, and manufacturing. These sectors can greatly benefit from the integration of sensor fusion technology to enhance safety, efficiency, and decision-making processes. Demand for sensor fusion solutions in these sectors would soon create opportunities for vendors to establish a strong presence and cater to the needs of a diverse customer base.
Demand for IMU Sensor Fusion to Rise amid High Sales of Autonomous Vehicles
Based on type, the inertial measurement unit (IMU) segment is anticipated to remain at the forefront through 2035. It is likely to showcase a CAGR of 16.4% in the assessment period from 19.3% CAGR registered in the historical period.
Demand for IMU sensor fusion is rising due to several key factors. It provides accurate and reliable data in dynamic and challenging environments. This would make it particularly valuable in applications such as robotics, unmanned vehicles, virtual reality, and augmented reality, where precise motion tracking and orientation estimation are critical.
Increasing adoption of autonomous systems across various sectors is driving the demand for IMU sensor fusion. Autonomous vehicles, drones, and industrial automation systems rely on IMU sensors to accurately perceive their surroundings and make informed decisions. By fusing data from multiple IMU sensors, the system can achieve higher accuracy, robustness, and resilience in challenging operating conditions.
Advancements in microelectromechanical systems (MEMS) technology have made IMU sensors more affordable, compact, and energy-efficient. This has expanded the potential applications of IMU sensor fusion to a wider range of sectors, including consumer electronics, healthcare, gaming, and sports performance tracking.
MEMS Sensor Fusion Algorithms to Experience Astonishing Demand through 2035
Based on technology, the micro-electromechanical systems (MEMS) segment is projected to record a CAGR of 16.3% in the evaluation period. It exhibited a CAGR of around 19.0% from 2020 to 2024.
MEMS sensors offer a compact and integrated solution that combines multiple sensing capabilities into a single device. This miniaturization and integration of sensors would enable more efficient and cost-effective sensor fusion solutions, thereby supporting sales.
MEMS sensors have improved significantly in terms of performance, reliability, and power consumption. They provide accurate and precise measurements of various parameters such as motion, pressure, temperature, and orientation.
Reliability and accuracy are crucial for sensor fusion applications, where the fusion of data from multiple sensors is necessary. It is set to help obtain a comprehensive understanding of the operating environment further pushing growth.
Another factor driving demand for MEMS technology in sensor fusion is its versatility. These sensors can be easily integrated with other sensors such as accelerometers, gyroscopes, magnetometers, and pressure sensors. This compatibility allows for the fusion of data from different sensing modalities, enabling a more holistic and accurate perception of the surrounding environment.
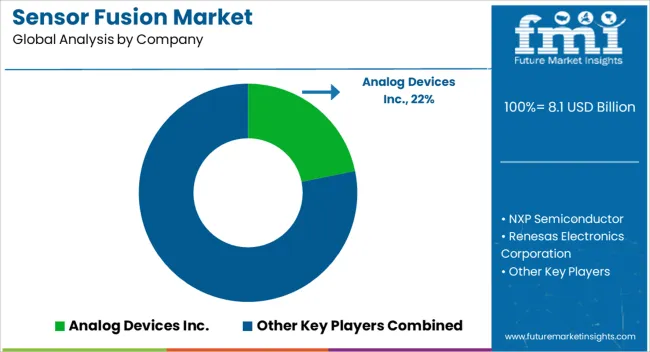
Several companies have established themselves as key players in the sensor fusion market. These companies specialize in developing and providing sensor fusion algorithms, software, and solutions.
They have a strong track record, experience, and expertise in sensor fusion technologies. They often cater to a wide range of sectors, including automotive, aerospace, robotics, healthcare, and consumer electronics.
Large technology providers with diverse product portfolios have entered the sensor fusion space. These companies would leverage their expertise in hardware, software, and data analytics to offer integrated sensor fusion solutions. Their strong financial resources, research capabilities, and global reach would give them a competitive advantage.
The sensor fusion industry has also seen the emergence of start-ups and niche players focusing on specific applications or technological advancements. These companies often bring innovative solutions to the market, pushing the boundaries of sensor fusion capabilities. They are agile, flexible, and able to cater to niche markets or specific customer requirements.
For instance
| Attribute | Details |
|---|---|
| Estimated Market Size (2025) | USD 8.1 billion |
| Projected Market Valuation (2035) | USD 34.9 billion |
| Value-based CAGR (2025 to 2035) | 15.8% |
| Historical Data | 2020 to 2024 |
| Forecast Period | 2025 to 2035 |
| Quantitative Units | Value (USD billion) |
| Segments Covered | Type, Technology, Industry Vertical, Region |
| Key Regions Covered | North America; Latin America; Europe; Asia Pacific; Middle East and Africa |
| Key Countries Covered | United States, Canada, Brazil, Mexico, rest of Latin America, China, Japan, South Korea, India, Association of Southeast Asian Nations, Oceania, Germany, Italy, France, United Kingdom, Spain, BENELUX, Nordics, Rest of Western Europe, Poland, Hungary, Romania, Czech Republic, Central Asia, Russia & Belarus, Balkan & Baltics, GCC Countries, Türkiye, Northern Africa and South Africa |
| Key Companies Profiled | Analog Devices Inc.; NXP Semiconductor; Renesas Electronics Corporation; Bosch Sensortec GmbH; InvenSense Inc; Infineon Technologies; STMicroelectronics; Asahi Kasei Microdevices; Baselabs; Maxim Integrated |
| Report Coverage | Revenue Forecast, Volume Forecast, Company Ranking, Competitive Landscape, Growth Factors, Trends and Pricing Analysis |
The global sensor fusion market is estimated to be valued at USD 8.1 billion in 2025.
The market size for the sensor fusion market is projected to reach USD 34.9 billion by 2035.
The sensor fusion market is expected to grow at a 15.8% CAGR between 2025 and 2035.
The key product types in sensor fusion market are radar sensors, image sensors, imu, temperature sensors and others.
In terms of technology, mems segment to command 63.5% share in the sensor fusion market in 2025.


Full Research Suite comprises of:
Market outlook & trends analysis
Interviews & case studies
Strategic recommendations
Vendor profiles & capabilities analysis
5-year forecasts
8 regions and 60+ country-level data splits
Market segment data splits
12 months of continuous data updates
DELIVERED AS:
PDF EXCEL ONLINE
Sensor Based Glucose Measuring Systems Market Size and Share Forecast Outlook 2025 to 2035
Sensor Development Kit Market Size and Share Forecast Outlook 2025 to 2035
Sensory Modifier Market Size and Share Forecast Outlook 2025 to 2035
Sensor Bearings Market Insights - Growth & Forecast 2025 to 2035
Sensor Hub Market Analysis - Growth, Demand & Forecast 2025 to 2035
Sensor Patches Market Analysis - Growth, Applications & Outlook 2025 to 2035
Sensors Market Analysis by Type, Technology, End User & Region - Forecast from 2025 to 2035
Sensor Data Analytics Market Growth - Trends & Forecast through 2034
Sensor Testing Market Analysis – Growth & Forecast 2024-2034
Sensor Cable Market
Sensormatic Labels Market
3D Sensor Market Size and Share Forecast Outlook 2025 to 2035
Biosensors Market Trends – Growth & Future Outlook 2025 to 2035
UV Sensors Market Analysis by Type, End User, and Region from 2025 to 2035
CP Sensor for Consumer Applications Market – Growth & Forecast 2025 to 2035
Nanosensors Market Size and Share Forecast Outlook 2025 to 2035
NOx Sensor Market Size and Share Forecast Outlook 2025 to 2035
VOC Sensors and Monitors Market Analysis - Size, Growth, and Forecast 2025 to 2035
Rain Sensors Market Size and Share Forecast Outlook 2025 to 2035
Microsensor Market Size and Share Forecast Outlook 2025 to 2035

Thank you!
You will receive an email from our Business Development Manager. Please be sure to check your SPAM/JUNK folder too.
Chat With
MaRIA