The global security holograms market is valued at USD 4,728 million in 2025 and is set to reach USD 8,945 million by 2035, growing at a CAGR of 6.6%. The market stands at the forefront of a transformative decade that promises to redefine anti-counterfeiting infrastructure and brand protection excellence across financial systems, consumer products, and government documentation sectors. The market's journey from USD 4,728 million in 2025 to USD 8,945 million by 2035 represents substantial growth, demonstrating the accelerating adoption of advanced authentication solutions and sophisticated protection systems across currency, identification documents, product packaging, and high-value merchandise sectors.
Future Market Insights (FMI), recognized globally for its packaging market forecasts and material innovation studies, projects that the first half of the decade (2025-2030) will witness the market climbing from USD 4,728 million to approximately USD 6,234 million, adding USD 1,506 million in value, which constitutes 36% of the total forecast growth period. This phase will be characterized by the rapid adoption of holographic security systems, driven by increasing demand for counterfeit prevention materials and enhanced authentication capabilities worldwide. Multi-layer optical features and tamper-evident characteristics will become standard expectations rather than premium options.
The latter half (2030-2035) will witness sustained growth from USD 6,234 million to USD 8,945 million, representing an addition of USD 2,711 million or 64% of the decade's expansion. This period will be defined by mass market penetration of advanced holographic authentication systems, integration with comprehensive digital verification platforms, and seamless compatibility with existing security infrastructure. The market trajectory signals fundamental shifts in how governments, financial institutions, and brand manufacturers approach anti-counterfeiting solutions, with participants positioned to benefit from sustained demand across multiple application segments.
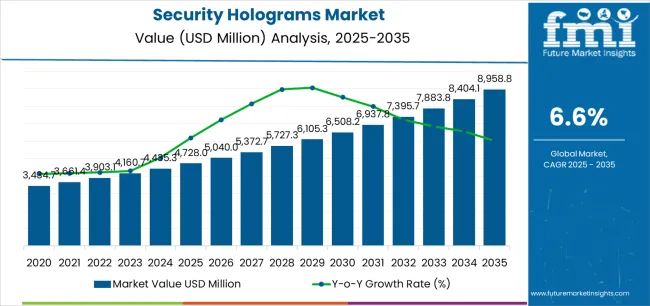
The security holograms market demonstrates distinct growth phases with varying market characteristics and competitive dynamics. Between 2025 and 2030, the market progresses through its authentication technology adoption phase, expanding from USD 4,728 million to USD 6,234 million with steady annual increments averaging 5.7% growth. This period showcases the transition from basic holographic labels to advanced systems with enhanced optical features and integrated verification capabilities becoming mainstream features.
The 2025-2030 phase adds USD 1,506 million to market value, representing 36% of total decade expansion. Market maturation factors include standardization of holographic security protocols, declining component costs for optical materials, and increasing brand awareness of security hologram benefits reaching 75-80% effectiveness in counterfeit prevention applications. Competitive landscape evolution during this period features established manufacturers like Leonhard Kurz Stiftung and K Laser Technology expanding their security product portfolios while new entrants focus on specialized authentication features and enhanced optical engineering.
From 2030 to 2035, market dynamics shift toward advanced authentication and digital integration, with growth accelerating from USD 6,234 million to USD 8,945 million, adding USD 2,711 million or 64% of total expansion. This phase transition logic centers on universal security hologram systems, integration with blockchain verification platforms, and deployment across diverse authentication scenarios, becoming standard rather than specialized applications. The competitive environment matures with focus shifting from basic optical security to comprehensive authentication ecosystems and integration with digital tracking systems.
At-a-Glance Metrics
| Metric | Value |
|---|---|
| Market Value (2025) | USD 4,728 million |
| Market Forecast (2035) | USD 8,945 million |
| Growth Rate | 6.60% CAGR |
| Leading Technology | Embossed Holograms |
| Primary Application | Banknotes & Currency Segment |
The market demonstrates strong fundamentals with embossed hologram systems capturing a dominant share through proven anti-counterfeiting effectiveness and reliable optical performance. Banknotes and currency applications drive primary demand, supported by increasing government spending on security features and counterfeit prevention solutions. Geographic expansion remains concentrated in Asia-Pacific markets with growing currency circulation volumes, while developed economies show steady adoption rates driven by security enhancement programs and document authentication requirements.
Market expansion rests on three fundamental shifts driving adoption across government, financial, and commercial sectors. 1. Counterfeit prevention demand creates compelling security advantages through holographic systems that provide immediate authenticity verification with sophisticated optical features, enabling organizations to protect brand reputation while maintaining consumer confidence and reducing revenue losses from fake products. 2. Currency modernization accelerates as central banks worldwide implement advanced security features for banknotes and coins, enabling enhanced counterfeit resistance that aligns with monetary policy goals and public trust requirements. 3. Regulatory compliance focus drives adoption from pharmaceutical manufacturers and consumer goods companies requiring tamper-evident solutions that maximize product traceability while maintaining authentication integrity during distribution and retail operations.
However, growth faces headwinds from production cost challenges that vary across application segments regarding material investments and optical engineering requirements, potentially limiting deployment flexibility in mid-tier product categories. Technology complexity also persists regarding verification equipment availability and authentication training that may increase operational barriers in markets with limited technical infrastructure.
The security holograms market represents a compelling intersection of optical technology innovation, anti-counterfeiting requirements, and brand protection management. With robust growth projected from USD 4,728 million in 2025 to USD 8,945 million by 2035 at a 6.60% CAGR, this market is driven by increasing counterfeit prevention needs, government security mandates, and consumer demand for authentic product verification.
The market's expansion reflects a fundamental shift in how governments, financial institutions, and brand manufacturers approach authentication infrastructure. Strong growth opportunities exist across diverse applications, from currency operations requiring sophisticated optical features to pharmaceutical facilities demanding tamper-evident protection and product tracking. Geographic expansion is particularly pronounced in Asia-Pacific markets, led by India (8.1% CAGR) and China (7.6% CAGR), while established markets in Europe and North America drive innovation and advanced feature development.
The dominance of embossed hologram systems and currency applications underscores the importance of proven optical technology and security effectiveness in driving adoption. Production complexity and verification integration remain key challenges, creating opportunities for companies that can deliver advanced authentication while maintaining operational efficiency.
Primary Classification: The market segments by product type into embossed holograms, dot-matrix holograms, and holographic strips categories, representing the evolution from basic optical structures to advanced multi-dimensional authentication features for comprehensive security operations.
Secondary Breakdown: Application segmentation divides the market into banknotes & currency, identification documents, pharmaceuticals & healthcare, consumer electronics, automotive components, tax stamps & excise, and others sectors, reflecting distinct requirements for security standards, tamper-evidence integration, and verification protocols.
Regional Classification: Geographic distribution covers Asia Pacific, Europe, North America, Latin America, and the Middle East & Africa, with developing markets leading volume growth while advanced economies show innovation focus driven by sophisticated authentication programs.
The segmentation structure reveals technology progression from standard embossed structures toward integrated multi-feature platforms with enhanced verification and anti-counterfeiting capabilities, while application diversity spans from currency operations to pharmaceutical facilities requiring precise authentication and supply chain tracking solutions.
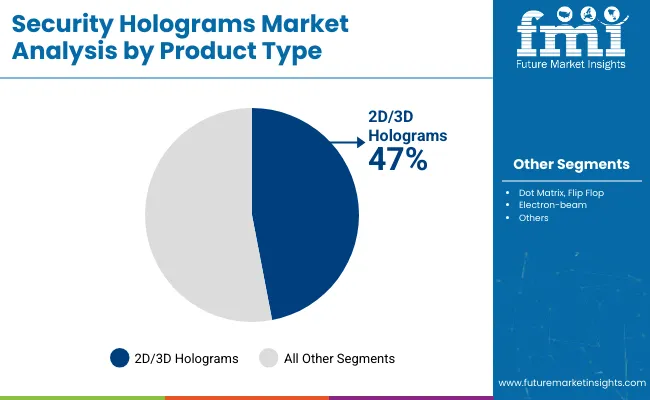
Embossed holograms segment is estimated to account for 52% of the security holograms market share in 2025. The segment's leading position stems from its fundamental role as a critical component in authentication applications and its extensive use across multiple security-sensitive sectors. Embossed holograms' dominance is attributed to their superior optical complexity, including diffraction patterns, 3D depth effects, and viewing angle variability that make them indispensable for high-security operations.
Market Position: Embossed hologram systems command the leading position in the security holograms market through advanced optical features, including comprehensive authentication layers, cost-effective production scalability, and reliable counterfeit resistance that enable organizations to deploy sophisticated security solutions across diverse verification environments.
Value Drivers: The segment benefits from government preference for proven security technologies that provide exceptional visual verification without requiring electronic reading equipment. Established manufacturing processes enable deployment in currency protection, document authentication, and product security applications where optical sophistication and production reliability represent critical security requirements.
Competitive Advantages: Embossed hologram systems differentiate through excellent visual impact, proven anti-counterfeiting performance, and compatibility with automated application equipment that enhance security effectiveness while maintaining cost-efficient operational profiles suitable for diverse protection applications.
Key market characteristics:
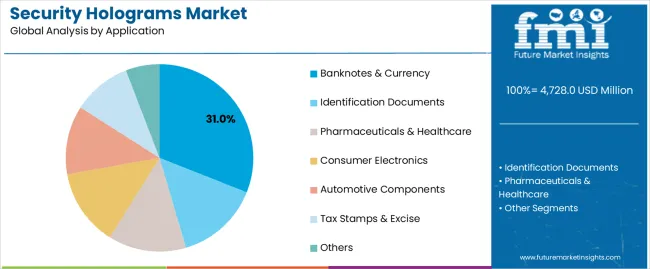
Banknotes & currency segment is projected to hold 31% of the security holograms market share in 2025. The segment's market leadership is driven by the extensive use of security holograms in paper currency protection, polymer banknote features, commemorative coins, and security threads, where holograms serve as both primary authentication features and public recognition elements. The financial sector's consistent investment in anti-counterfeiting technologies supports the segment's dominant position.
Market Context: Currency applications dominate the market due to widespread government adoption of holographic security features and increasing focus on counterfeit prevention management, monetary system integrity, and public confidence applications that enhance currency authentication while maintaining circulation efficiency.
Appeal Factors: Central banks prioritize optical security features, production durability, and integration with other security elements that enable coordinated protection across multiple denomination systems. The segment benefits from substantial security budgets and regular currency redesign cycles that emphasize advanced authentication features for circulation and international exchange operations.
Growth Drivers: Currency modernization programs incorporate security holograms as mandatory features for new banknote series and upgraded denominations. At the same time, emerging economy initiatives are increasing demand for sophisticated authentication systems that comply with international standards and enhance public trust.
Market Challenges: Long procurement cycles and stringent testing requirements may limit deployment flexibility in rapid implementation scenarios or emergency currency programs.
Application dynamics include:
Growth Accelerators: Counterfeit proliferation drives primary adoption as security hologram systems provide exceptional authentication capabilities that enable product protection without excessive verification costs, supporting brand integrity and consumer safety that require immediate visual confirmation. Government mandate expansion accelerates market growth as regulatory agencies worldwide require holographic security features for currency, documents, and excise products while enhancing public sector authentication through standardized optical verification. Technology investment increases globally, creating sustained demand for sophisticated holographic systems that complement product value and provide competitive advantages in brand protection environments.
Growth Inhibitors: Implementation cost challenges vary across application segments regarding material investments and production equipment requirements, which may limit market penetration and adoption rates in price-sensitive categories with constrained security budgets. Production complexity persists regarding optical engineering expertise and specialized manufacturing equipment availability that may increase lead times in custom applications with demanding authentication standards. Verification infrastructure gaps across retail and distribution channels create compatibility concerns between different authentication technologies and existing inspection systems.
Market Evolution Patterns: Adoption accelerates in pharmaceutical and electronics sectors where product authentication justifies security investments, with geographic concentration in Asia-Pacific markets transitioning toward mainstream adoption in Latin American economies driven by counterfeit prevention initiatives and brand protection programs. Technology development focuses on enhanced optical features, improved durability characteristics, and integration with digital verification platforms that optimize authentication speed and consumer engagement. The market could face disruption if alternative authentication technologies or digital-only verification systems significantly challenge hologram advantages in visual security applications.
The security holograms market demonstrates varied regional dynamics with Growth Leaders including India (8.1% CAGR) and China (7.6% CAGR) driving expansion through currency modernization and pharmaceutical authentication growth. Steady Performers encompass Germany (6.9% CAGR), the USA (6.4% CAGR), and the UK (5.8% CAGR), benefiting from established security infrastructure and advanced authentication adoption.
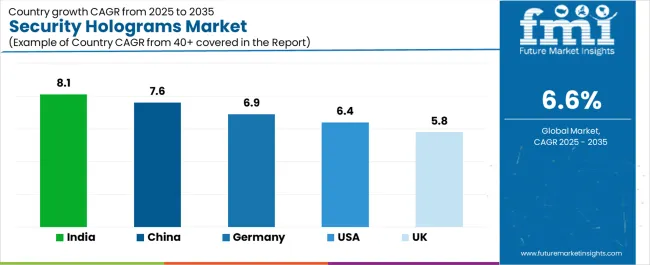
| Country | CAGR (2025-2035) |
|---|---|
| India | 8.1 |
| China | 7.6 |
| Germany | 6.9 |
| UAS | 6.4 |
| UK | 5.8 |
Regional synthesis reveals Asia-Pacific markets leading growth through currency circulation expansion and pharmaceutical security requirements, while European countries maintain steady expansion supported by document security standards and excise tax enforcement. North American markets show solid growth driven by brand protection applications and government identification programs.
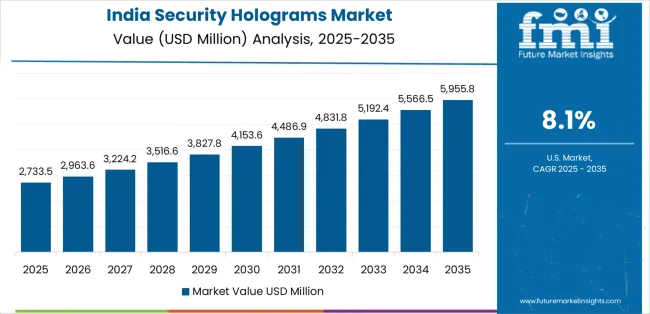
India establishes regional leadership through comprehensive currency modernization and extensive pharmaceutical security development, integrating advanced security hologram systems as standard components in banknote production and medication packaging applications. The country's 8.1% CAGR through 2035 reflects government initiatives promoting digital payment infrastructure alongside physical currency protection and pharmaceutical track-and-trace programs that mandate the use of holographic authentication in critical applications. Growth concentrates in major production centers, including Mumbai, Delhi, and Hyderabad, where security printing facilities showcase integrated hologram systems that appeal to government agencies seeking sophisticated counterfeit prevention and international certification standards.
Indian manufacturers are developing cost-effective security hologram solutions that combine local production advantages with international optical standards, including multi-layer security features and mobile verification capabilities.
Strategic Market Indicators:
The Chinese market emphasizes currency security and consumer product authentication, including rapid holographic feature adoption and comprehensive anti-counterfeiting infrastructure that increasingly incorporates security holograms for banknote protection and brand verification applications. The country is projected to show a 7.6% CAGR through 2035, driven by massive currency circulation volumes under monetary policy programs and commercial demand for authentic product identification systems. Chinese security facilities prioritize optical sophistication with holograms delivering advanced verification through multi-dimensional effects and machine-readable integration capabilities.
Technology deployment channels include government printing facilities, specialized security manufacturers, and brand protection programs that support customized production for authentication applications.
Performance Metrics:
The German market emphasizes advanced security hologram features, including innovative optical designs and integration with comprehensive document security systems that manage passport protection, identification authentication, and tax stamp applications through unified verification platforms. The country is projected to show a 6.9% CAGR through 2035, driven by technological innovation under manufacturing excellence programs and commercial demand for sophisticated, reliable authentication systems. German security manufacturers prioritize engineering precision with holograms delivering exceptional optical quality through advanced production techniques and quality control standards.
Technology deployment channels include government contractors, specialized security printers, and automotive component manufacturers that support custom development for premium authentication operations.
Performance Metrics:
The USA market emphasizes brand protection applications, including innovative holographic features and integration with comprehensive product security platforms that manage electronics authentication, pharmaceutical verification, and document security applications through unified anti-counterfeiting systems. The country is projected to show a 6.4% CAGR through 2035, driven by intellectual property protection under brand security programs and commercial demand for distinctive, verifiable authentication systems. American manufacturers prioritize consumer verification with holograms delivering accessible authentication through smartphone-compatible features and visual clarity.
Technology deployment channels include brand manufacturers, specialized security suppliers, and government document programs that support custom development for diverse protection operations.
Performance Metrics:
In London, Manchester, and Edinburgh, British government agencies and commercial security printers are implementing advanced security hologram systems to enhance document authentication capabilities and support passport security that aligns with international travel requirements and identity verification protocols. The UK market demonstrates sustained growth with a 5.8% CAGR through 2035, driven by border security modernization programs and document protection investments that emphasize sophisticated optical systems for identification and travel documents. British security facilities are prioritizing hologram systems that provide exceptional authentication reliability while maintaining compliance with international standards and minimizing verification complexity, particularly important in passport issuance and visa security operations.
Market expansion benefits from government security programs that mandate holographic features in official documents, creating sustained demand across the UK's identification and travel documentation sectors, where authentication integrity and international recognition represent critical requirements.
Strategic Market Indicators:
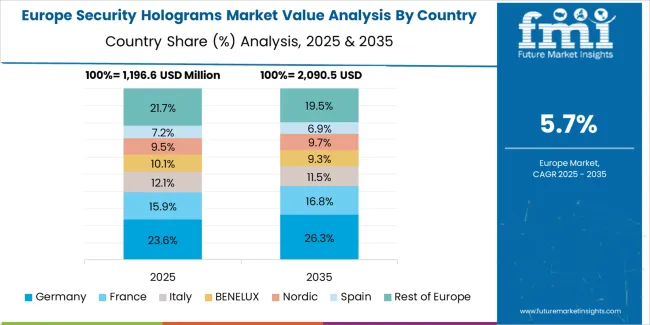
The security holograms market in Europe is projected to grow from USD 1,342 million in 2025 to USD 2,267 million by 2035, registering a CAGR of 5.4% over the forecast period. Germany is expected to maintain its leadership position with a 31.2% market share in 2025, increasing slightly to 31.8% by 2035, supported by its precision manufacturing capabilities and major security printing centers, including Munich and Frankfurt.
The United Kingdom follows with a 23.7% share in 2025, projected to reach 23.4% by 2035, driven by comprehensive document security programs and passport authentication initiatives. France holds a 19.4% share in 2025, expected to maintain 19.6% by 2035 through established currency production and identification security sectors. Switzerland commands a 14.8% share, while the Netherlands accounts for 8.3% in 2025. The Rest of Europe region is anticipated to gain momentum, expanding its collective share from 2.6% to 3.1% by 2035, attributed to increasing authentication adoption in Nordic countries and emerging Eastern European government security facilities implementing advanced holographic programs.
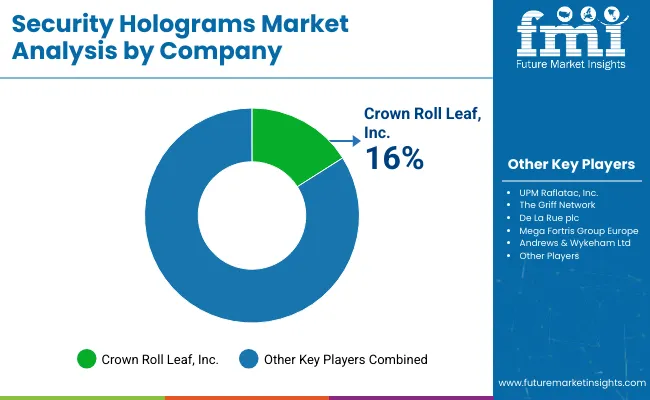
The security holograms market operates with moderate concentration, featuring approximately 15-22 participants, where leading companies control roughly 45-52% of the global market share through established government relationships and comprehensive optical engineering capabilities. Competition emphasizes authentication effectiveness, production reliability, and technical innovation rather than price-based rivalry.
Market leaders encompass Leonhard Kurz Stiftung, K Laser Technology, and De La Rue plc, which maintain competitive advantages through extensive security expertise, global manufacturing networks, and comprehensive feature development capabilities that create institutional trust and support premium contracts. These companies leverage decades of holographic security experience and ongoing technology investments to develop advanced authentication systems with exceptional optical sophistication and counterfeit resistance.
Specialty challengers include Holostik India Limited, Security Hologram, and OpSec Security Group, which compete through specialized application focus and innovative optical solutions that appeal to brand manufacturers seeking distinctive authentication capabilities and cost-effective security features. These companies differentiate through rapid customization emphasis and regional market expertise.
Market dynamics favor participants that combine proven authentication effectiveness with advanced optical engineering support, including feature design consultation and verification system integration capabilities. Competitive pressure intensifies as traditional printing companies expand into security holograms. At the same time, specialized authentication technology firms challenge established players through innovative optical solutions and digital integration targeting emerging security segments.
| Item | Value |
|---|---|
| Quantitative Units | USD 4,728 million |
| Product Type | Embossed Holograms, Dot-Matrix Holograms, Holographic Strips |
| Application | Banknotes & Currency, Identification Documents, Pharmaceuticals & Healthcare, Consumer Electronics, Automotive Components, Tax Stamps & Excise, Others |
| Regions Covered | Asia Pacific, Europe, North America, Latin America, Middle East & Africa |
| Countries Covered | India, China, Germany, USA, UK, and 25+ additional countries |
| Key Companies Profiled | Leonhard Kurz Stiftung, K Laser Technology, De La Rue plc, Holostik India Limited, Security Hologram, OpSec Security Group |
| Additional Attributes | Dollar sales by product type and application categories, regional adoption trends across Asia-Pacific, Europe, and North America, competitive landscape with security hologram manufacturers and optical technology suppliers, government preferences for authentication effectiveness and optical sophistication, integration with digital verification platforms and tracking systems, innovations in optical engineering and multi-layer security features, and development of advanced authentication solutions with enhanced counterfeit resistance and consumer verification capabilities |
The global security holograms market is estimated to be valued at USD 4,728.0 million in 2025.
The market size for the security holograms market is projected to reach USD 8,958.8 million by 2035.
The security holograms market is expected to grow at a 6.6% CAGR between 2025 and 2035.
The key product types in security holograms market are embossed holograms, dot-matrix holograms and holographic strips.
In terms of application, banknotes & currency segment to command 31.0% share in the security holograms market in 2025.


Full Research Suite comprises of:
Market outlook & trends analysis
Interviews & case studies
Strategic recommendations
Vendor profiles & capabilities analysis
5-year forecasts
8 regions and 60+ country-level data splits
Market segment data splits
12 months of continuous data updates
DELIVERED AS:
PDF EXCEL ONLINE
Evaluating Security Holograms Market Share & Provider Insights
Security Alarm Communicator Market Size and Share Forecast Outlook 2025 to 2035
Security and Vulnerability Management Market Forecast and Outlook 2025 to 2035
Security Paper Market Size and Share Forecast Outlook 2025 to 2035
Security System Tester Market Size and Share Forecast Outlook 2025 to 2035
Security Advisory Services Market Size and Share Forecast Outlook 2025 to 2035
Security Room Control Market Size and Share Forecast Outlook 2025 to 2035
Security Cameras (IR Illuminator) Market Size and Share Forecast Outlook 2025 to 2035
Security Operation Centre as a Service Market Size and Share Forecast Outlook 2025 to 2035
Security Robots Market Size and Share Forecast Outlook 2025 to 2035
Security Service Edge Market Size and Share Forecast Outlook 2025 to 2035
Security and Surveillance Equipment Market Size and Share Forecast Outlook 2025 to 2035
Security Orchestration Automation and Response (SOAR) Market Size and Share Forecast Outlook 2025 to 2035
Security Bags Market Size and Share Forecast Outlook 2025 to 2035
Security Screening Market Analysis - Size, Share, and Forecast 2025 to 2035
Security Bottles Market Size and Share Forecast Outlook 2025 to 2035
Security Inspection Market Insights – Trends & Forecast 2025 to 2035
Security Labels Market Analysis by Product Type, Material, Pattern, Application, End-Use Industry, and Region Through 2035
Market Share Breakdown of Security Bags Manufacturers
Market Share Insights for Security Tape Providers

Thank you!
You will receive an email from our Business Development Manager. Please be sure to check your SPAM/JUNK folder too.
Chat With
MaRIA