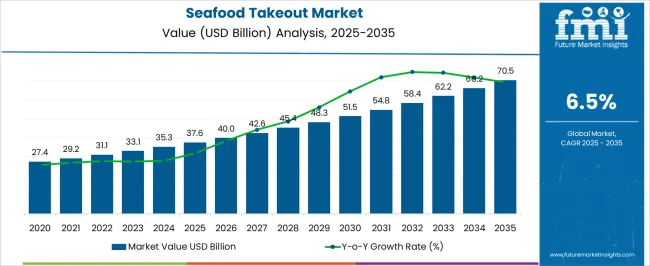
[306 Pages Report] The seafood takeout market is anticipated to have an effective CAGR of 6.50% during the period 2022 to 2032. The seafood takeout market is expected to expand from US$ 31.1 Billion in 2022 to US$ 51.3 Billion in 2032. Previously, the market grew at a faster rate of 2.5% from 2015 to 2021, culminating in a market of US$ 158.91 Billion in 2021.
"Pescetarian values and the availability of high nutritional value seafood dishes like sushi are two factors behind the growth of the seafood takeout market."
As per a survey conducted by the Associated Chamber of Commerce and Industry of India, more than 79% of households in India prefer instant food as a result of higher disposable incomes and changing living standards.
Businesses across the seafood supply chain faced uncertain operating conditions during the lockdown period. Governments offered a record level of financial support to assist businesses and employees. However, businesses did not know when services to export markets and UK food service markets would resume.
Pescetarianism refers to vegetarian food along with seafood but not any meat such as beef, pork, poultry, etc. This has caused growth in the seafood takeout market due to awareness of the health benefits of seafood and the change in the lifestyle of consumers. Non-vegetarian consumers are slowly changing their lifestyles and significantly following the pescetarian lifestyle.
Consequently, this shift has been observed due to consumers' preference for a healthy diet. Since meat & meat products are often contaminated with harmful pesticides and chemicals, consumption of meat & meat products is dangerous. Hence, consumers are looking for alternatives.
Furthermore, increased awareness about the living conditions of cattle in cattle farms has changed the preference of non-vegetarians towards pescetarianism, thus, driving the growth of the seafood takeout market.
A value-added seafood product was launched by Pacific seafood in May 2021. Amazon is partnering with Pacific to launch around 20 value-added seafood products quarterly for its Amazon Go stores, which now number 29 - with more to come, bolstering the opportunities for market growth in the seafood takeout market.
The depletion of sea species has restrained market growth. However, sustainable fishing can meet the new demands for seafood.
Collaboration between fishermen and fish farmers with processors, distributors, retailers, restaurants, and food service providers will help in resolving environmental concerns and will also contribute to making the market environmentally, economically, and socially sustainable.
China and India are among the developing economies in the Asia Pacific that are becoming centers of flavourful fish cuisines. The country, however, has developed a tradition of making and consuming authentic fish dishes that can be seen in the level of food choices available at restaurants.
The growing trend of out-of-home dining in the markets, together with the growing demand for organized food services, will likely stimulate the growth of seafood takeout and premium servings, including crustaceans, in quick-service and full-service restaurants.
As the developing economies have created a range of opportunities for seafood takeout restaurants, Asia Pacific has grown into a leading market for food service restaurants in recent years. Additionally, online ordering from restaurants has increased at an astonishing rate since the mid-2000s, which has afforded restaurants the opportunity to maximize their sales channels & revenues, propelling growth opportunities for the seafood takeout market.
Attributes | Details |
---|---|
Seafood Takeout Market CAGR (2022 to 2032) | 6.50% |
Seafood Takeout Market Size (2022) | US$ 31.1 Billion |
Seafood Takeout Market Size (2032) | US$ 51.3 Billion |
Don't pay for what you don't need
Customize your report by selecting specific countries or regions and save 30%!
Consumer awareness of the health benefits of seafood and changes in lifestyle have contributed to the growth of the seafood market. Non-vegetarian consumers are slowly changing their lifestyles, and pescetarians are consuming seafood along with vegetarian foods. Pescetarianism refers to a diet consisting of fish and vegetarian foods, without the consumption of meat such as beef, pork, or poultry.
Increasing consumer expenditure on various seafood dishes like sushi and consumer preference for fish dishes like pescetarianism are some key factors leading to the growth of the market. Foods that come in fresh form are highly preferred by consumers owing to their health benefits. Various factors, such as sedentary lifestyle habits, an increase in income levels and an increase in chronic diseases have resulted in a shift in individuals' consumption habits.
The improvement in economic conditions and the growth of disposable income propel market growth, and middle-income groups and high-income consumers, in combination, add to the middle-class population. In addition, North America and the Asia-Pacific are experiencing increased disposable income as urban consumers shift from essential to premium goods and services. As a result, seafood suppliers & institutions are enhancing their seafood product line and service offerings.
The market is undergoing a change attributed to consumers' preference for a healthy diet. As meat & meat products often contain harmful pesticides and chemicals, their high consumption can be harmful to consumers, causing them to search for alternatives to meat and meat products. Furthermore, an increase in consumer awareness regarding the living conditions of cattle in cattle farms has influenced consumers' preferences for meat products, propelling the growth of the global seafood takeout market.
Currently, the depletion of sea species has restricted the growth of the seafood market, but sustainable fishing may increase the supply of seafood takeout to meet the emerging demand.
Collaboration of fishermen and fish farmers with processors, distributors, retailers, restaurants, and foodservice providers is expected to resolve the environmental issues and help in advancing the market's sustainability on many levels, including economically, ecologically, and socially.
Many seafood restaurants focus on providing only sustainable seafood options today, such as Miya's in the United States and Fisheries Innovation in Scotland.
These restaurants & seafood service providers focus on sustainable seafood options such as catfish and tilapia. All of these factors work in tandem to propel the growth of the global seafood takeout market.
Over 79% of households in India prefer instant food, a result of changing standards of living, the increase in disposable incomes, and an increase in disposable incomes, according to a recent survey conducted by the Associated Chamber of Commerce and Industry of India.
In addition to consumers' interest in pescetarian cuisine and the presence of a higher nutritional value, a rise in consumer expenditures on seafood dishes like sushi is one of the major factors for the growth of the seafood takeout market, boosting the demand for seafood takeout.
Owing to this increase in demand, the market is expected to grow in the future, providing opportunities for the seafood takeout market.
In an effort to increase consumer appeal, chefs have developed recipes and dishes that include fish, trout, and prawns. The popularity of these recipes has aided in the growth of the seafood takeout market.
The food industry must recognize seafood as an important part of their offerings; responding to the needs of consumers of all ages and preferences has popularized seafood around the world, in turn, driving the market growth.
A seafood market segmentation based on the distribution channel consists of supermarkets and hypermarkets, convenience stores, specialty stores, e-commerce, and other sources.
Supermarkets and hypermarkets are self-serve stores that include a wide variety of products available for purchase. Seafood has a dedicated section in supermarkets and hypermarkets, so consumers have a variety of options to choose from, especially in the freezer section.
A large segment of the seafood market is the market segmented based on product type, which includes fresh, frozen, canned, and others. According to a study by IBISWorld, sedentary lifestyles, rising income levels, escalating prevalence of chronic illnesses, and increased awareness about health and wellness have contributed to the shift in consumer behavior.
A growing number of consumers are reducing their intake of carbohydrates and replacing them with protein-rich food items, such as fish.
Consumers make frequent use of seafood, such as tuna and salmon, to create pasta dishes, burgers, salads, tartar sauce, and other dishes that are regularly consumed. In addition, hotels and restaurants have increased their offerings of seafood dishes as a result of consumers' increasing seafood consumption & creating a high demand for seafood takeout.
Authentic and delectable recipes using fish, trout, and prawns have gained consumers' attention; the popularity of these recipes has fed the growth of the seafood takeout market; the food industry must encapsulate seafood as a critical ingredient. The need to appeal to consumers of all ages and preferences has popularized seafood all over the world.
Get the data you need at a Fraction of the cost
Personalize your report by choosing insights you need
and save 40%!
The U.S. Commercial Fisheries and Seafood Industry estimate that roughly 80% of aggregate catch seafood, that is, fresh and frozen, is consumed as human food, proving the high demand for seafood takeout in the country.
Furthermore, apart from manufacturers, retailers like Walmart Corporation have started their own seafood brands due to the high demand across the country.
The Asia Pacific is a region where developing economies like China and India have become the centers of some of the most popular fish-related cuisines in the world.
Plus, the country has a strong tradition of producing and consuming authentic fish-related dishes, which is evident by the sheer range of offerings on restaurant menus across the region; numerous producers & sellers are cashing in on the seafood takeout market key trends & opportunities.
Furthermore, the development of organized food service outlets and the trend toward out-of-home dining in the market are forecast to boost the sale of seafood takeout, as well as premium servings, including crustaceans, across quick service and full-service outlets.
Among the leading markets for restaurants in the Asia Pacific over the past few years have been the developing economies, which have provided new opportunities for the seafood takeout market to scale up their sales channels and revenues. Furthermore, online ordering from restaurants has exploded at a remarkable rate in recent years, giving restaurants even more opportunities to scale up their sales channels and revenues.
Seafood takeouts are manufactured and marketed by P.F. Changs, Sizzler, Bahama Breeze Island Grille, Rubio's, Long John Silver's, Red Lobster, Captain D's Seafood Kitchen, Bonefish Grill, Joe's Crab Shack, Bubba Gump Shrimp Co., Arthur Treacher's, Landry's Seafood House, Chart House, King's Fish House, Ocean Prime, Eddie V's Prime Seafood, McCormick & Schmick's, Captain D's Seafood Kitchen, Legal Sea Foods, Truluck's, Pappadeaux Seafood Kitchen, and Other Players (On Additional Requests).
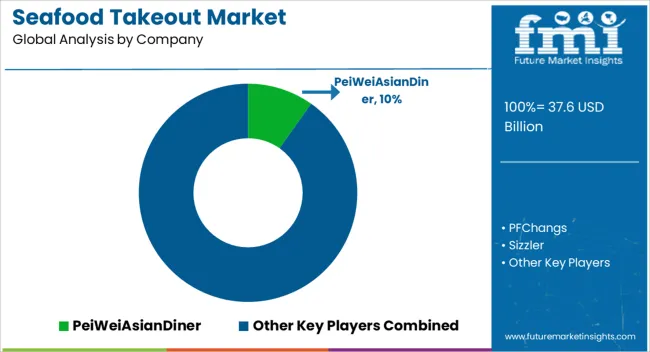
Companies that have developed new products to increase their market share among consumers are also adopted by leading companies. It is these strategies that have led to the development of the seafood takeout market.
Key players are focusing on expanding their product offering, thus producing a bigger selection of seafood products, such as fillets, portions, rings, and others. Furthermore, the main product range of key players is dominated by fillets and portions, due to their high consumer demand for seafood takeout in these countries because they are used for both foodservice and retail markets.
Additionally, some companies are also collaborating with digital marketing and other companies to improve their supply chain and marketing efficiency, as well as securing the farming for long-term industry growth. Mergers and acquisitions are some of the most preferred strategies globally for the emerging trends in the seafood takeout market.
Seafood takeout account for large shares in the takeout market, some of the prominent players within the market include P.F. Changs, Sizzler, Bahama Breeze Island Grille, Rubio's, Long John Silver's, Red Lobster, Captain D's Seafood Kitchen, Bonefish Grill, Joe's Crab Shack, Bubba Gump Shrimp Co., and Arthur Treacher's.
Recent Developments in the Seafood Takeout Market:
The seafood takeout market is projected to have a CAGR of 6.50% during the forecast period.
The US is the leading region, with an anticipated CAGR of 39.8% through 2032.
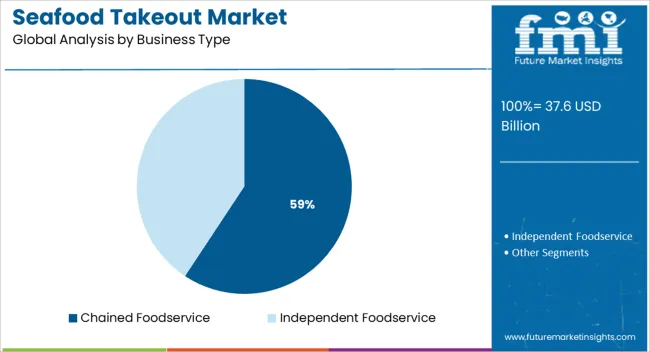
Independent foodservice leads the market with the projected CAGR of 62.5% through 2032.
The seafood takeout market is predicted to grow to US$ 51.3 Billion by 2032.
1. Executive Summary
1.1. Global Market Outlook
1.2. Demand Side Trends
1.3. Supply Side Trends
1.4. Technology Roadmap
1.5. Analysis and Recommendations
2. Market Overview
2.1. Market Coverage / Taxonomy
2.2. Market Definition
2.2.1. Influx of Brands
2.2.2. Innovative Distribution & Marketing Strategies
3. Market Dynamics
3.1. Drivers
3.1.1. Supply Side Drivers
3.1.2. Demand Side drivers
3.1.3. Economic Side Drivers
3.2. Restraints
3.3. Opportunity
3.4. Market trends By Region
3.5. Macro-Economic Factors
3.6. Forecast Factors - Relevance & Impact
3.7. Industry Value and Supply Chain Analysis
3.7.1. Profit Margin Analysis at Each Sales Point
3.7.2. List & Role of Key Participants
3.7.2.1. Manufacturers
3.7.2.2. Distributors/e-Retailers
4. Global Seafood Takeout Market Size (in Value (US$ Mn) Analysis 2017–2021 and Forecast, 2022–2032
4.1. Historical Market Size (in Value (US$ Mn) Analysis, 2017–2021
4.2. Current and Future Market Size (in Value (US$ Mn) Analysis, 2022–2032
4.2.1. Y-o-Y Growth Trend Analysis
4.2.2. Absolute $ Opportunity Analysis
5. Global Seafood Takeout Market Analysis 2017–2021 and Forecast 2022–2032, By Product Type
5.1. Introduction / Key Findings
5.2. Historical Market Size (in Value (US$ Mn) Analysis By Product Type, 2017–2021
5.3. Current and Future Market Size (in Value (US$ Mn) Analysis and Forecast By Product Type, 2022–2032
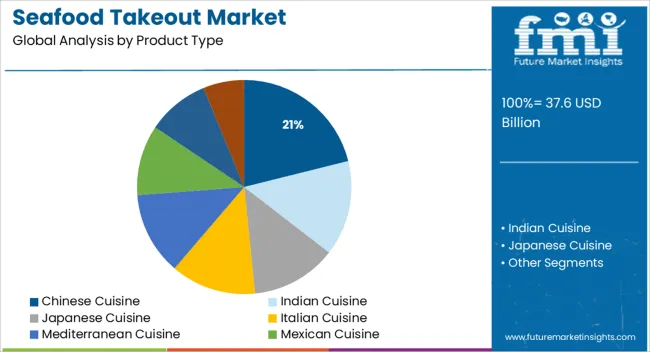
5.3.1. Chinese cuisine
5.3.2. Indian cuisine
5.3.3. Japanese Cuisine
5.3.4. Italian Cuisine
5.3.5. Mediterranean Cuisine
5.3.6. Mexican Cuisine
5.3.7. Turkish Cuisine
5.3.8. Others( Greek, Spanish, Korean)
5.4. Market Attractiveness Analysis By Product Type
6. Global Seafood Takeout Market Analysis 2017–2021 and Forecast 2022–2032, By Restaurants Type
6.1. Introduction / Key Findings
6.2. Historical Market Size (in Value (US$ Mn) Analysis By Restaurants Type, 2017–2021
6.3. Current and Future Market Size (in Value (US$ Mn) Analysis and Forecast By Restaurants Type, 2022–2032
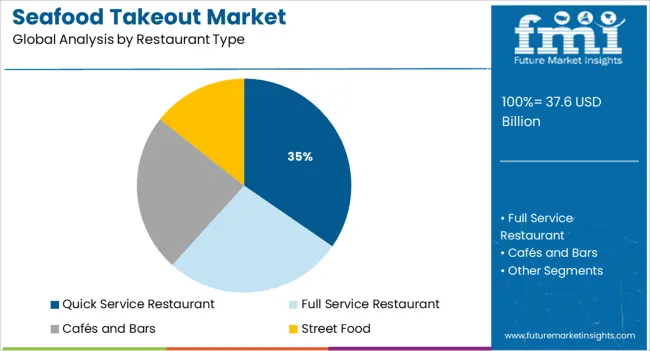
6.3.1. Quick service restaurant
6.3.1.1. Self service restaurants
6.3.1.2. Assisted service restaurants
6.3.2. Full service restaurant
6.3.2.1. Fine Dining
6.3.2.2. Casual Dining
6.3.3. Cafés and bars
6.3.4. Street food
6.4. Market Attractiveness Analysis By Restaurants Type
7. Global Seafood Takeout Market Analysis 2017–2021 and Forecast 2022–2032, By Business Type
7.1. Introduction / Key Findings
7.2. Historical Market Size (in Value (US$ Mn) Analysis By Business Type, 2017–2021
7.3. Current and Future Market Size (in Value (US$ Mn) Analysis and Forecast By Business Type, 2022–2032
7.3.1. Chained foodservice
7.3.2. Independent foodservice
7.4. Market Attractiveness Analysis By Business Type
8. Global Seafood Takeout Market Analysis 2017–2021 and Forecast 2022–2032, By Purchase Model
8.1. Introduction / Key Findings
8.2. Historical Market Size (in Value (US$ Mn) Analysis By Purchase Model, 2017–2021
8.3. Current and Future Market Size (in Value (US$ Mn) Analysis and Forecast By Purchase Model, 2022–2032
8.3.1. Direct-to-consumer
8.3.2. platform-to-consumer
8.4. Market Attractiveness Analysis By Purchase Model
9. Global Seafood Takeout Market Analysis 2017–2021 and Forecast 2022–2032, By Payment Type
9.1. Introduction / Key Findings
9.2. Historical Market Size (in Value (US$ Mn) Analysis By Payment Type, 2017–2021
9.3. Current and Future Market Size (in Value (US$ Mn) Analysis and Forecast By Payment Type, 2022–2032
9.3.1. Cash
9.3.2. Debit cards
9.3.3. Credit cards
9.3.4. Digital Wallets
9.3.5. Electronic bank transfers
9.4. Market Attractiveness Analysis By Payment Type
10. Global Seafood Takeout Market Analysis 2017–2021 and Forecast 2022–2032, by Region
10.1. Introduction
10.2. Historical Market Size (in Value (US$ Mn) Analysis By Region, 2017–2021
10.3. Current Market Size (in Value (US$ Mn) Analysis and Forecast By Region, 2022–2032
10.3.1. North America
10.3.2. Latin America
10.3.3. Europe
10.3.4. East Asia
10.3.5. South Asia
10.3.6. Oceania
10.3.7. Middle East & Africa
10.4. Market Attractiveness Analysis By Region
11. North America Seafood Takeout Market Analysis 2017–2021 and Forecast 2022–2032
11.1. Introduction
11.2. Pricing Analysis
11.3. Historical Market Size (US$ Mn) and Volume Trend Analysis By Market Taxonomy, 2017–2021
11.4. Market Size (US$ Mn) and Volume Forecast By Market Taxonomy, 2022–2032
11.4.1. By Country
11.4.1.1. U.S.
11.4.1.2. Canada
11.4.2. By Product Type
11.4.3. By Restaurants Type
11.4.4. By Business Type
11.4.5. By Purchase Model
11.4.6. By Payment Type
11.5. Market Attractiveness Analysis
11.5.1. By Country
11.5.2. By Product Type
11.5.3. By Restaurants Type
11.5.4. By Business Type
11.5.5. By Purchase Model
11.5.6. By Payment Type
11.6. Market Trends
11.7. Key Market Participants - Intensity Mapping
11.8. Drivers and Restraints - Impact Analysis
12. Latin America Seafood Takeout Market Analysis 2017–2021 and Forecast 2022–2032
12.1. Introduction
12.2. Pricing Analysis
12.3. Historical Market Size (US$ Mn) and Volume Trend Analysis By Market Taxonomy, 2017–2021
12.4. Market Size (US$ Mn) and Volume Forecast By Market Taxonomy, 2022–2032
12.4.1. By Country
12.4.1.1. Brazil
12.4.1.2. Mexico
12.4.1.3. Colombia
12.4.1.4. Argentina
12.4.1.5. Rest of Latin America
12.4.2. By Product Type
12.4.3. By Restaurants Type
12.4.4. By Business Type
12.4.5. By Purchase Model
12.4.6. By Payment Type
12.5. Market Attractiveness Analysis
12.5.1. By Country
12.5.2. By Product Type
12.5.3. By Restaurants Type
12.5.4. By Business Type
12.5.5. By Purchase Model
12.5.6. By Payment Type
12.6. Market Trends
12.7. Key Market Participants - Intensity Mapping
12.8. Drivers and Restraints - Impact Analysis
13. Europe Seafood Takeout Market Analysis 2017–2021 and Forecast 2022–2032
13.1. Introduction
13.2. Pricing Analysis
13.3. Historical Market Size (US$ Mn) and Volume Trend Analysis By Market Taxonomy, 2017–2021
13.4. Market Size (US$ Mn) and Volume Forecast By Market Taxonomy, 2022–2032
13.4.1. By Country
13.4.1.1. Germany
13.4.1.2. U.K.
13.4.1.3. France
13.4.1.4. Italy
13.4.1.5. Spain
13.4.1.6. BENELUX
13.4.1.7. Nordic
13.4.1.8. Russia
13.4.1.9. Poland
13.4.1.10. Rest of Europe
13.4.2. By Product Type
13.4.3. By Restaurants Type
13.4.4. By Business Type
13.4.5. By Purchase Model
13.4.6. By Payment Type
13.5. Market Attractiveness Analysis
13.5.1. By Country
13.5.2. By Product Type
13.5.3. By Restaurants Type
13.5.4. By Business Type
13.5.5. By Purchase Model
13.5.6. By Payment Type
13.6. Market Trends
13.7. Key Market Participants - Intensity Mapping
13.8. Drivers and Restraints - Impact Analysis
14. East Asia Seafood Takeout Market Analysis 2017–2021 and Forecast 2022–2032
14.1. Introduction
14.2. Pricing Analysis
14.3. Historical Market Size (US$ Mn) and Volume Trend Analysis By Market Taxonomy, 2017–2021
14.4. Market Size (US$ Mn) and Volume Forecast By Market Taxonomy, 2022–2032
14.4.1. By Country
14.4.1.1. China
14.4.1.2. Japan
14.4.1.3. South Korea
14.4.2. By Product Type
14.4.3. By Restaurants Type
14.4.4. By Business Type
14.4.5. By Purchase Model
14.4.6. By Payment Type
14.5. Market Attractiveness Analysis
14.5.1. By Country
14.5.2. By Product Type
14.5.3. By Restaurants Type
14.5.4. By Business Type
14.5.5. By Purchase Model
14.5.6. By Payment Type
14.6. Market Trends
14.7. Key Market Participants - Intensity Mapping
14.8. Drivers and Restraints - Impact Analysis
15. South Asia Seafood Takeout Market Analysis 2017–2021 and Forecast 2022–2032
15.1. Introduction
15.2. Pricing Analysis
15.3. Historical Market Size (US$ Mn) and Volume Trend Analysis By Market Taxonomy, 2017–2021
15.4. Market Size (US$ Mn) and Volume Forecast By Market Taxonomy, 2022–2032
15.4.1. By Country
15.4.1.1. India
15.4.1.2. Thailand
15.4.1.3. Malaysia
15.4.1.4. Indonesia
15.4.1.5. Singapore
15.4.1.6. Rest of South Asia
15.4.2. By Product Type
15.4.3. By Restaurants Type
15.4.4. By Business Type
15.4.5. By Purchase Model
15.4.6. By Payment Type
15.5. Market Attractiveness Analysis
15.5.1. By Country
15.5.2. B By Product Type
15.5.3. By Restaurants Type
15.5.4. By Business Type
15.5.5. By Purchase Model
15.5.6. By Payment Type
15.5.7. Market Trends
15.6. Key Market Participants - Intensity Mapping
15.7. Drivers and Restraints - Impact Analysis
16. Oceania Seafood Takeout Market Analysis 2017–2021 and Forecast 2022–2032
16.1. Introduction
16.2. Pricing Analysis
16.3. Historical Market Size (US$ Mn) and Volume Trend Analysis By Market Taxonomy, 2017–2021
16.4. Market Size (US$ Mn) and Volume Forecast By Market Taxonomy, 2022–2032
16.4.1. By Country
16.4.1.1. Australia
16.4.1.2. New Zealand
16.4.2. By Product Type
16.4.3. By Restaurants Type
16.4.4. By Business Type
16.4.5. By Purchase Model
16.4.6. By Payment Type
16.5. Market Attractiveness Analysis
16.5.1. By Country
16.5.2. By Product Type
16.5.3. By Restaurants Type
16.5.4. By Business Type
16.5.5. By Purchase Model
16.5.6. By Payment Type
16.6. Market Trends
16.7. Key Market Participants - Intensity Mapping
16.8. Drivers and Restraints - Impact Analysis
17. MEA Seafood Takeout Market Analysis 2017–2021 and Forecast 2022–2032
17.1. Introduction
17.2. Pricing Analysis
17.3. Historical Market Size (US$ Mn) and Volume Trend Analysis By Market Taxonomy, 2017–2021
17.4. Market Size (US$ Mn) and Volume Forecast By Market Taxonomy, 2022–2032
17.4.1. By Country
17.4.1.1. UAE
17.4.1.2. Saudi Arabia
17.4.1.3. Other GCC Countries
17.4.1.4. North Africa
17.4.1.5. South Africa
17.4.1.6. Central Africa
17.4.2. By Product Type
17.4.3. By Restaurants Type
17.4.4. By Business Type
17.4.5. By Purchase Model
17.4.6. By Payment Type
17.5. Market Attractiveness Analysis
17.5.1. By Country
17.5.2. By Product Type
17.5.3. By Restaurants Type
17.5.4. By Business Type
17.5.5. By Purchase Model
17.5.6. By Payment Type
17.6. Market Trends
17.7. Key Market Participants - Intensity Mapping
17.8. Drivers and Restraints - Impact Analysis
18. Country-level Seafood Takeout Market Analysis (2017–2021 and Forecast 2022–2032)
18.1. U.S. Seafood Takeout Market Analysis
18.1.1. By Product Type
18.1.2. By Restaurants Type
18.1.3. By Business Type
18.1.4. By Purchase Model
18.1.5. By Payment Type
18.2. Canada Seafood Takeout Market Analysis
18.2.1. By Product Type
18.2.2. By Restaurants Type
18.2.3. By Business Type
18.2.4. By Purchase Model
18.2.5. By Payment Type
18.3. Brazil Seafood Takeout Market Analysis
18.3.1. By Product Type
18.3.2. By Restaurants Type
18.3.3. By Business Type
18.3.4. By Purchase Model
18.3.5. By Payment Type
18.4. Mexico Seafood Takeout Market Analysis
18.4.1. By Product Type
18.4.2. By Restaurants Type
18.4.3. By Business Type
18.4.4. By Purchase Model
18.4.5. By Payment Type
18.5. Colombia Seafood Takeout Market Analysis
18.5.1. By Product Type
18.5.2. By Restaurants Type
18.5.3. By Business Type
18.5.4. By Purchase Model
18.5.5. By Payment Type
18.6. Argentina Seafood Takeout Market Analysis
18.6.1. By Product Type
18.6.2. By Restaurants Type
18.6.3. By Business Type
18.6.4. By Purchase Model
18.6.5. By Payment Type
18.7. Germany Seafood Takeout Market Analysis
18.7.1. By Product Type
18.7.2. By Restaurants Type
18.7.3. By Business Type
18.7.4. By Purchase Model
18.7.5. By Payment Type
18.8. U.K. Seafood Takeout Market Analysis
18.8.1. By Product Type
18.8.2. By Restaurants Type
18.8.3. By Business Type
18.8.4. By Purchase Model
18.8.5. By Payment Type
18.9. France Seafood Takeout Market Analysis
18.9.1. By Product Type
18.9.2. By Restaurants Type
18.9.3. By Business Type
18.9.4. By Purchase Model
18.9.5. By Payment Type
18.10. Italy Seafood Takeout Market Analysis
18.10.1. By Product Type
18.10.2. By Restaurants Type
18.10.3. By Business Type
18.10.4. By Purchase Model
18.10.5. By Payment Type
18.11. Spain Seafood Takeout Market Analysis
18.11.1. By Product Type
18.11.2. By Restaurants Type
18.11.3. By Business Type
18.11.4. By Purchase Model
18.11.5. By Payment Type
18.12. Belgium Seafood Takeout Market Analysis
18.12.1. By Product Type
18.12.2. By Restaurants Type
18.12.3. By Business Type
18.12.4. By Purchase Model
18.12.5. By Payment Type
18.13. Netherlands Seafood Takeout Market Analysis
18.13.1. By Product Type
18.13.2. By Restaurants Type
18.13.3. By Business Type
18.13.4. By Purchase Model
18.13.5. By Payment Type
18.14. Nordic Seafood Takeout Market Analysis
18.14.1. By Product Type
18.14.2. By Restaurants Type
18.14.3. By Business Type
18.14.4. By Purchase Model
18.14.5. By Payment Type
18.15. Russia Region Seafood Takeout Market Analysis
18.15.1. By Product Type
18.15.2. By Restaurants Type
18.15.3. By Business Type
18.15.4. By Purchase Model
18.15.5. By Payment Type
18.16. Poland Seafood Takeout Market Analysis
18.16.1. By Product Type
18.16.2. By Restaurants Type
18.16.3. By Business Type
18.16.4. By Purchase Model
18.16.5. By Payment Type
18.17. Ukraine Seafood Takeout Market Analysis
18.17.1. By Product Type
18.17.2. By Restaurants Type
18.17.3. By Business Type
18.17.4. By Purchase Model
18.17.5. By Payment Type
18.18. China Seafood Takeout Market Analysis
18.18.1. By Product Type
18.18.2. By Restaurants Type
18.18.3. By Business Type
18.18.4. By Purchase Model
18.18.5. By Payment Type
18.19. Japan Seafood Takeout Market Analysis
18.19.1. By Product Type
18.19.2. By Restaurants Type
18.19.3. By Business Type
18.19.4. By Purchase Model
18.19.5. By Payment Type
18.20. China Seafood Takeout Market Analysis
18.20.1. By Product Type
18.20.2. By Restaurants Type
18.20.3. By Business Type
18.20.4. By Purchase Model
18.20.5. By Payment Type
18.21. S Korea Seafood Takeout Market Analysis
18.21.1. By Product Type
18.21.2. By Restaurants Type
18.21.3. By Business Type
18.21.4. By Purchase Model
18.21.5. By Payment Type
18.22. India Seafood Takeout Market Analysis
18.22.1. By Product Type
18.22.2. By Restaurants Type
18.22.3. By Business Type
18.22.4. By Purchase Model
18.22.5. By Payment Type
18.23. Thailand Seafood Takeout Market Analysis
18.23.1. By Product Type
18.23.2. By Restaurants Type
18.23.3. By Business Type
18.23.4. By Purchase Model
18.23.5. By Payment Type
18.24. Malaysia Seafood Takeout Market Analysis
18.24.1. By Product Type
18.24.2. By Restaurants Type
18.24.3. By Business Type
18.24.4. By Purchase Model
18.24.5. By Payment Type
18.25. Indonesia Seafood Takeout Market Analysis
18.25.1. By Product Type
18.25.2. By Restaurants Type
18.25.3. By Business Type
18.25.4. By Purchase Model
18.25.5. By Payment Type
18.26. Singapore Seafood Takeout Market Analysis
18.26.1. By Product Type
18.26.2. By Restaurants Type
18.26.3. By Business Type
18.26.4. By Purchase Model
18.26.5. By Payment Type
18.27. Australia Seafood Takeout Market Analysis
18.27.1. By Product Type
18.27.2. By Restaurants Type
18.27.3. By Business Type
18.27.4. By Purchase Model
18.27.5. By Payment Type
18.28. New Zealand Seafood Takeout Market Analysis
18.28.1. By Product Type
18.28.2. By Restaurants Type
18.28.3. By Business Type
18.28.4. By Purchase Model
18.28.5. By Payment Type
18.29. UAE Seafood Takeout Market Analysis
18.29.1. By Product Type
18.29.2. By Restaurants Type
18.29.3. By Business Type
18.29.4. By Purchase Model
18.29.5. By Payment Type
18.30. Saudi Arabia Seafood Takeout Market Analysis
18.30.1. By Product Type
18.30.2. By Restaurants Type
18.30.3. By Business Type
18.30.4. By Purchase Model
18.30.5. By Payment Type
19. Market Structure Analysis
19.1. Global Seafood Takeout Market Competition - a Dashboard View
19.2. Industry Structure Analysis
19.2.1. % tier 1 market players
19.2.2. % tier 2 market players
19.2.3. % tier 3 market players
19.3. Global Seafood Takeout Market Company Share Analysis
19.3.1. For Tier 1 Market Players, 2022
19.3.2. Company Market Share Analysis of Top 5 Players, By Region
19.4. Key Participants Market Presence (Intensity Mapping) by Region
20. Competition Analysis
20.1. Competition Dashboard
20.2. Competition Benchmarking
20.3. Competition Deep Dive
20.3.1. Pei Wei Asian Diner
20.3.1.1. Product Portfolio
20.3.1.2. Product Claim
20.3.1.3. Revenue by Market Segments (Product/Channel/Region)
20.3.1.4. Sales Footprint
20.3.1.5. Strategy Overview
20.3.1.5.1. Marketing Strategy
20.3.1.5.2. Product Strategy
20.3.1.5.3. Channel Strategy
20.3.1.6. SWOT Analysis
20.3.2. P.F. Changs
20.3.2.1. Product Portfolio
20.3.2.2. Product Claim
20.3.2.3. Revenue by Market Segments (Product/Channel/Region)
20.3.2.4. Sales Footprint
20.3.2.5. Strategy Overview
20.3.2.5.1. Marketing Strategy
20.3.2.5.2. Product Strategy
20.3.2.5.3. Channel Strategy
20.3.2.6. SWOT Analysis
20.3.3. Sizzler
20.3.3.1. Product Portfolio
20.3.3.2. Product Claim
20.3.3.3. Revenue by Market Segments (Product/Channel/Region)
20.3.3.4. Sales Footprint
20.3.3.5. Strategy Overview
20.3.3.5.1. Marketing Strategy
20.3.3.5.2. Product Strategy
20.3.3.5.3. Channel Strategy
20.3.3.6. SWOT Analysis
20.3.4. Bahama Breeze Island Grille
20.3.4.1. Product Portfolio
20.3.4.2. Product Claim
20.3.4.3. Revenue by Market Segments (Product/Channel/Region)
20.3.4.4. Sales Footprint
20.3.4.5. Strategy Overview
20.3.4.5.1. Marketing Strategy
20.3.4.5.2. Product Strategy
20.3.4.5.3. Channel Strategy
20.3.4.6. SWOT Analysis
20.3.5. Rubio's
20.3.5.1. Product Portfolio
20.3.5.2. Product Claim
20.3.5.3. Revenue by Market Segments (Product/Channel/Region)
20.3.5.4. Sales Footprint
20.3.5.5. Strategy Overview
20.3.5.5.1. Marketing Strategy
20.3.5.5.2. Product Strategy
20.3.5.5.3. Channel Strategy
20.3.5.6. SWOT Analysis
20.3.6. Long John Silver's
20.3.6.1. Product Portfolio
20.3.6.2. Product Claim
20.3.6.3. Revenue by Market Segments (Product/Channel/Region)
20.3.6.4. Sales Footprint
20.3.6.5. Strategy Overview
20.3.6.5.1. Marketing Strategy
20.3.6.5.2. Product Strategy
20.3.6.5.3. Channel Strategy
20.3.6.6. SWOT Analysis
20.3.7. Red Lobster
20.3.7.1. Product Portfolio
20.3.7.2. Product Claim
20.3.7.3. Revenue by Market Segments (Product/Channel/Region)
20.3.7.4. Sales Footprint
20.3.7.5. Strategy Overview
20.3.7.5.1. Marketing Strategy
20.3.7.5.2. Product Strategy
20.3.7.5.3. Channel Strategy
20.3.7.6. SWOT Analysis
20.3.8. Captain D's Seafood Kitchen
20.3.8.1. Product Portfolio
20.3.8.2. Product Claim
20.3.8.3. Revenue by Market Segments (Product/Channel/Region)
20.3.8.4. Sales Footprint
20.3.8.5. Strategy Overview
20.3.8.5.1. Marketing Strategy
20.3.8.5.2. Product Strategy
20.3.8.5.3. Channel Strategy
20.3.8.6. SWOT Analysis
20.3.9. Bonefish Grill
20.3.9.1. Product Portfolio
20.3.9.2. Product Claim
20.3.9.3. Revenue by Market Segments (Product/Channel/Region)
20.3.9.4. Sales Footprint
20.3.9.5. Strategy Overview
20.3.9.5.1. Marketing Strategy
20.3.9.5.2. Product Strategy
20.3.9.5.3. Channel Strategy
20.3.9.6. SWOT Analysis
20.3.10. Joe's Crab Shack
20.3.10.1. Product Portfolio
20.3.10.2. Product Claim
20.3.10.3. Revenue by Market Segments (Product/Channel/Region)
20.3.10.4. Sales Footprint
20.3.10.5. Strategy Overview
20.3.10.5.1. Marketing Strategy
20.3.10.5.2. Product Strategy
20.3.10.5.3. Channel Strategy
20.3.10.6. SWOT Analysis
20.3.11. Bubba Gump Shrimp Co.
20.3.11.1. Product Portfolio
20.3.11.2. Product Claim
20.3.11.3. Revenue by Market Segments (Product/Channel/Region)
20.3.11.4. Sales Footprint
20.3.11.5. Strategy Overview
20.3.11.5.1. Marketing Strategy
20.3.11.5.2. Product Strategy
20.3.11.5.3. Channel Strategy
20.3.11.6. SWOT Analysis
20.3.12. Arthur Treacher's
20.3.12.1. Product Portfolio
20.3.12.2. Product Claim
20.3.12.3. Revenue by Market Segments (Product/Channel/Region)
20.3.12.4. Sales Footprint
20.3.12.5. Strategy Overview
20.3.12.5.1. Marketing Strategy
20.3.12.5.2. Product Strategy
20.3.12.5.3. Channel Strategy
20.3.12.6. SWOT Analysis
20.3.13. Landry's Seafood House
20.3.13.1. Product Portfolio
20.3.13.2. Product Claim
20.3.13.3. Revenue by Market Segments (Product/Channel/Region)
20.3.13.4. Sales Footprint
20.3.13.5. Strategy Overview
20.3.13.5.1. Marketing Strategy
20.3.13.5.2. Product Strategy
20.3.13.5.3. Channel Strategy
20.3.13.6. SWOT Analysis
20.3.14. Chart House
20.3.14.1. Product Portfolio
20.3.14.2. Product Claim
20.3.14.3. Revenue by Market Segments (Product/Channel/Region)
20.3.14.4. Sales Footprint
20.3.14.5. Strategy Overview
20.3.14.5.1. Marketing Strategy
20.3.14.5.2. Product Strategy
20.3.14.5.3. Channel Strategy
20.3.14.6. SWOT Analysis
20.3.15. King's Fish House
20.3.15.1. Product Portfolio
20.3.15.2. Product Claim
20.3.15.3. Revenue by Market Segments (Product/Channel/Region)
20.3.15.4. Sales Footprint
20.3.15.5. Strategy Overview
20.3.15.5.1. Marketing Strategy
20.3.15.5.2. Product Strategy
20.3.15.5.3. Channel Strategy
20.3.15.6. SWOT Analysis
20.3.16. Ocean Prime
20.3.16.1. Product Portfolio
20.3.16.2. Product Claim
20.3.16.3. Revenue by Market Segments (Product/Channel/Region)
20.3.16.4. Sales Footprint
20.3.16.5. Strategy Overview
20.3.16.5.1. Marketing Strategy
20.3.16.5.2. Product Strategy
20.3.16.5.3. Channel Strategy
20.3.16.6. SWOT Analysis
20.3.17. Eddie V's Prime Seafood
20.3.17.1. Product Portfolio
20.3.17.2. Product Claim
20.3.17.3. Revenue by Market Segments (Product/Channel/Region)
20.3.17.4. Sales Footprint
20.3.17.5. Strategy Overview
20.3.17.5.1. Marketing Strategy
20.3.17.5.2. Product Strategy
20.3.17.5.3. Channel Strategy
20.3.17.6. SWOT Analysis
20.3.18. McCormick & Schmick's
20.3.18.1. Product Portfolio
20.3.18.2. Product Claim
20.3.18.3. Revenue by Market Segments (Product/Channel/Region)
20.3.18.4. Sales Footprint
20.3.18.5. Strategy Overview
20.3.18.5.1. Marketing Strategy
20.3.18.5.2. Product Strategy
20.3.18.5.3. Channel Strategy
20.3.18.6. SWOT Analysis
20.3.19. Captain D's Seafood Kitchen
20.3.19.1. Product Portfolio
20.3.19.2. Product Claim
20.3.19.3. Revenue by Market Segments (Product/Channel/Region)
20.3.19.4. Sales Footprint
20.3.19.5. Strategy Overview
20.3.19.5.1. Marketing Strategy
20.3.19.5.2. Product Strategy
20.3.19.5.3. Channel Strategy
20.3.19.6. SWOT Analysis
20.3.20. Legal Sea Foods
20.3.20.1. Product Portfolio
20.3.20.2. Product Claim
20.3.20.3. Revenue by Market Segments (Product/Channel/Region)
20.3.20.4. Sales Footprint
20.3.20.5. Strategy Overview
20.3.20.5.1. Marketing Strategy
20.3.20.5.2. Product Strategy
20.3.20.5.3. Channel Strategy
20.3.20.6. SWOT Analysis
20.3.21. Truluck's
20.3.21.1. Product Portfolio
20.3.21.2. Product Claim
20.3.21.3. Revenue by Market Segments (Product/Channel/Region)
20.3.21.4. Sales Footprint
20.3.21.5. Strategy Overview
20.3.21.5.1. Marketing Strategy
20.3.21.5.2. Product Strategy
20.3.21.5.3. Channel Strategy
20.3.21.6. SWOT Analysis
20.3.22. Pappadeaux Seafood Kitchen
20.3.22.1. Product Portfolio
20.3.22.2. Product Claim
20.3.22.3. Revenue by Market Segments (Product/Channel/Region)
20.3.22.4. Sales Footprint
20.3.22.5. Strategy Overview
20.3.22.5.1. Marketing Strategy
20.3.22.5.2. Product Strategy
20.3.22.5.3. Channel Strategy
20.3.22.6. SWOT Analysis
20.3.23. Other Players (On Additional Requests)
20.3.23.1. Product Portfolio
20.3.23.2. Product Claim
20.3.23.3. Revenue by Market Segments (Product/Channel/Region)
20.3.23.4. Sales Footprint
20.3.23.5. Strategy Overview
20.3.23.5.1. Marketing Strategy
20.3.23.5.2. Product Strategy
20.3.23.5.3. Channel Strategy
20.3.23.6. SWOT Analysis
21. Assumptions and Acronyms Used
22. Research Methodology
Explore Food and Beverage Insights
View Reports