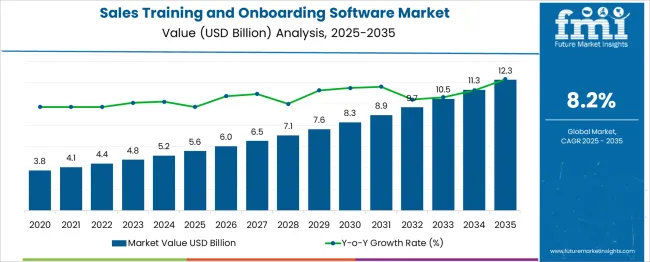
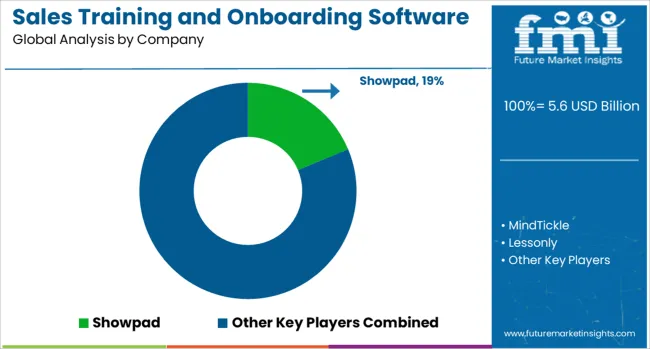
The Sales Training and Onboarding Software Market is estimated to be valued at USD 5.6 billion in 2025 and is projected to reach USD 12.3 billion by 2035, registering a compound annual growth rate (CAGR) of 8.2% over the forecast period.

| Metric | Value |
|---|---|
| Sales Training and Onboarding Software Market Estimated Value in (2025 E) | USD 5.6 billion |
| Sales Training and Onboarding Software Market Forecast Value in (2035 F) | USD 12.3 billion |
| Forecast CAGR (2025 to 2035) | 8.2% |
Employee onboarding software is a tool for coordinating new employee onboarding and streamlining administrative tasks. Everything simplifies the process by removing paperwork and combining it into a single system.
The sales training and onboarding software market expansion is being fuelled by increased demand for lowering time spent on repetitive work, increasing time spent on employee relationship-building and engagement initiatives, and increasing acceptance of the newest technologies in companies.
The demand for sales training and onboarding software is being driven by the software's smooth transition for new hires. During the forecast period, the tool's integration with other enterprise resource planning software (ERPS), such as recruiting processes, training tools, and so on, is expected to boost demand for employee onboarding software.
Paper costs and waste are significantly reduced while using employee onboarding software. The sustainability aspect linked with the sales training and onboarding software is predicted to significantly stimulate the sales training and onboarding software market adoption trends as the planet is facing persistent and extensive dangers of climate change.
The sales training and onboarding software market may be hampered by the poor adoption rate of this software among small and medium-sized businesses due to inept budgeting.
While the sales training and onboarding software market has recovered significantly from the negative influence of the pandemic, the high competitiveness among the market players is getting difficult to manage.
As per the sales training and onboarding software market analysis, sales training is becoming increasingly popular among firms because it gives information in bite-sized chunks. Learners can obtain just-in-time training in specific skills or topics, ensuring that they have the right product knowledge at the right time.
Due to increased corporate competition and changing business needs, MNCs and SMBs have been encouraged to introduce new things regularly. New things must be taught to salespeople in such organizations in a short period of time before they are released to the market. This is helping the players carve out new trends in the sales training and onboarding software market.
Large enterprises and SMEs are the two segmentation areas in the sales training and onboarding software market. This classification is made on the basis of the application of sales training and onboarding software.
By region, the sales training and onboarding software market is divided into North America, Latin America, Europe, Asia Pacific, the Middle East, and Africa.
The cloud-based segment is projected to lead the sales training and onboarding software market with a CAGR of 8.1% throughout the forecast period.
Employee onboarding software allows employees to be more productive and integrate more quickly into their teams. It also enables the employees and the recruiting manager to keep track of paperwork and training. This has positively impacted the sales training and onboarding software market trends.
The rising adoption of the cloud-based deployment model is propelling the demand for sales training and onboarding software at a rapid pace.
| Regions | CAGR (2025 to 2035) |
|---|---|
| United States | 8% |
| United Kingdom | 7.2% |
| China | 7.7% |
| Japan | 6.7% |
| South Korea | 5.8% |
The sales training and onboarding software market is divided into four regions: North America, Europe, Asia Pacific, and the Rest of the World. North America led the sales training and onboarding software market, followed by Europe, APAC, South America, and MEA.
The APAC region, on the other hand, is expected to witness the largest incremental growth in the sales training and onboarding software market adoption over the forecast period due to factors such as rising acceptance of cost-effective training and an increase in the number of SMBs and MNCs.
As most vendors operating in the sales training and onboarding software market are situated in the USA, the market is likely to grow at a high rate. Furthermore, the region is at the forefront of sophisticated technology usage.
Many growing Asian Pacific countries, such as India and China, are becoming more digital. Furthermore, enhanced technology use is propelling the sales training and onboarding software market in the Middle East and Africa (MEA) and South America. The key players attempt to achieve a significant impact by bridging the gap between technology and the market.
Employee onboarding solutions are predicted to grow in popularity across practically all industrial verticals, propelling the market in these areas over the forecast period.

Due to the changing sales training and onboarding software market outlook, several companies prioritize new launches, product approvals, and other sustainable growth techniques, including patents and events.
Acquisitions, partnerships, & collaborations were two inorganic growth tactics seen in the sector to improve sales training and onboarding software adoption. These initiatives have paved the road for market players to expand their businesses and challenge incumbent players to develop their client base.
With the increased demand for sales training and onboarding software in the worldwide market, market participants in the sales training and onboarding software market are expected to benefit from lucrative growth prospects in the future.
The global sales training and onboarding software market is estimated to be valued at USD 5.6 billion in 2025.
The market size for the sales training and onboarding software market is projected to reach USD 12.3 billion by 2035.
The sales training and onboarding software market is expected to grow at a 8.2% CAGR between 2025 and 2035.
The key product types in sales training and onboarding software market are on-premises and cloud based.
In terms of application, large enterprises segment to command 64.1% share in the sales training and onboarding software market in 2025.


Our Research Products

The "Full Research Suite" delivers actionable market intel, deep dives on markets or technologies, so clients act faster, cut risk, and unlock growth.

The Leaderboard benchmarks and ranks top vendors, classifying them as Established Leaders, Leading Challengers, or Disruptors & Challengers.

Locates where complements amplify value and substitutes erode it, forecasting net impact by horizon

We deliver granular, decision-grade intel: market sizing, 5-year forecasts, pricing, adoption, usage, revenue, and operational KPIs—plus competitor tracking, regulation, and value chains—across 60 countries broadly.

Spot the shifts before they hit your P&L. We track inflection points, adoption curves, pricing moves, and ecosystem plays to show where demand is heading, why it is changing, and what to do next across high-growth markets and disruptive tech

Real-time reads of user behavior. We track shifting priorities, perceptions of today’s and next-gen services, and provider experience, then pace how fast tech moves from trial to adoption, blending buyer, consumer, and channel inputs with social signals (#WhySwitch, #UX).

Partner with our analyst team to build a custom report designed around your business priorities. From analysing market trends to assessing competitors or crafting bespoke datasets, we tailor insights to your needs.
Supplier Intelligence
Discovery & Profiling
Capacity & Footprint
Performance & Risk
Compliance & Governance
Commercial Readiness
Who Supplies Whom
Scorecards & Shortlists
Playbooks & Docs
Category Intelligence
Definition & Scope
Demand & Use Cases
Cost Drivers
Market Structure
Supply Chain Map
Trade & Policy
Operating Norms
Deliverables
Buyer Intelligence
Account Basics
Spend & Scope
Procurement Model
Vendor Requirements
Terms & Policies
Entry Strategy
Pain Points & Triggers
Outputs
Pricing Analysis
Benchmarks
Trends
Should-Cost
Indexation
Landed Cost
Commercial Terms
Deliverables
Brand Analysis
Positioning & Value Prop
Share & Presence
Customer Evidence
Go-to-Market
Digital & Reputation
Compliance & Trust
KPIs & Gaps
Outputs
Full Research Suite comprises of:
Market outlook & trends analysis
Interviews & case studies
Strategic recommendations
Vendor profiles & capabilities analysis
5-year forecasts
8 regions and 60+ country-level data splits
Market segment data splits
12 months of continuous data updates
DELIVERED AS:
PDF EXCEL ONLINE
Salesforce Services Market Size and Share Forecast Outlook 2025 to 2035
Sales Analysis of Tourism Industry in the Middle East Size and Share Forecast Outlook 2025 to 2035
Sales of Sports Nutrition Products in Latin America Analysis Size and Share Forecast Outlook 2025 to 2035
Sales of Plant‑based Ready Meals in US Analysis - Size, Share & Forecast 2025 to 2035
Sales Enablement Platform Market Analysis - Size, Share, and Forecast 2025 to 2035
Sales Intelligence Market Size and Share Forecast Outlook 2025 to 2035
Sales of Used Bikes through Bike Marketplaces Market- Growth & Demand 2025 to 2035
Sales Coaching Software Market Size and Share Forecast Outlook 2025 to 2035
Sales Platforms Software Market Size and Share Forecast Outlook 2025 to 2035
Sales Compensation Software Market Size and Share Forecast Outlook 2025 to 2035
Sales Intelligence Software Market Size and Share Forecast Outlook 2025 to 2035
Sales Performance Management (SPM) Software Market Size and Share Forecast Outlook 2025 to 2035
Salesforce CRM Document Generation Software Market Size and Share Forecast Outlook 2025 to 2035
Retail Sales of Legume Snacks in the UK Analysis - Size, Share & Forecast 2025 to 2035
Retail Sales of Layered Verrine‑Style Desserts in France Analysis - Size, Share & Forecast 2025 to 2035
US Convenience Confectionery Retail Sales Analysis - Size, Share & Forecast 2025 to 2035
Retail Sales of Bergamot from Calabria in Italy Analysis - Size, Share & Forecast 2025 to 2035
Retail Sales of Kvass in Russia and CIS countries Analysis - Size, Share & Forecast 2025 to 2035
Generator Sales Market Size and Share Forecast Outlook 2025 to 2035
Demand and Sales Analysis of Paper Cup in Japan Size and Share Forecast Outlook 2025 to 2035

Thank you!
You will receive an email from our Business Development Manager. Please be sure to check your SPAM/JUNK folder too.
Chat With
MaRIA