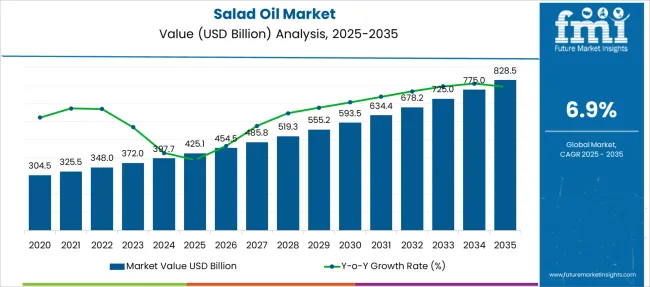
The global salad oil market is anticipated to garner a revenue of about US$ 348 billion by 2032, up from US$ 177 billion in 2022, advancing at a CAGR of 6.9% during the forecast period (2022 to 2032).
The demand for salad oil is gaining momentum due to a shift in consumer behaviour and eating habits from the same number of dishes towards exploring new food varieties and experiencing a wide range of flavours.
The growing number of health-conscious consumers who enjoy salads with their meals has encouraged hotels and restaurants to serve salads by making them look more appealing and taste delicious, resulting in soaring sales of salad oil in the hotel industry.
Report Attribute | Details |
---|---|
Salad Oil Market Value (2022) | US$ 177 Billion |
Salad Oil Market Anticipated Forecast Value (2032) | US$ 348 Billion |
Salad Oil Market Projected Growth Rate (2022 to 2032) | 6.9% |
Salad oil is a light-tasting vegetable oil used for salad dressing and to impart a specific flavour and consistency to the salad, due to which many from around the world are opting for the same thereby surging the demand for salad oil.
Salad oil is extracted mainly by cold pressing method from vegetable sources such as nuts, seeds, and fruits., which are considered to be a nutrient reserve. Hence, people, worldwide, who are switching to healthy diets spike the sales of salad oil.
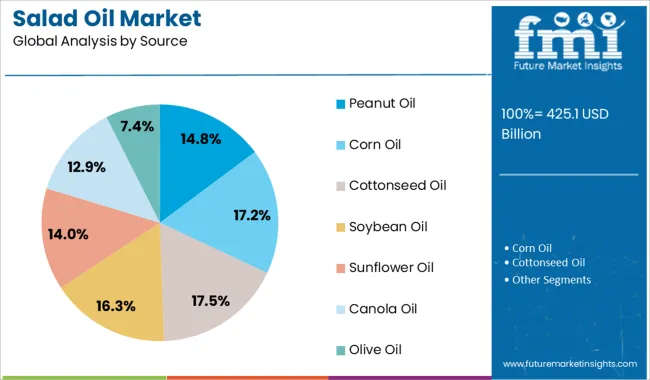
Salad oil is considered to be the best oil for salad dressing as the most common sources include peanut, corn, soybean, sunflower, canola, olive, etc., which cater to the health of many.
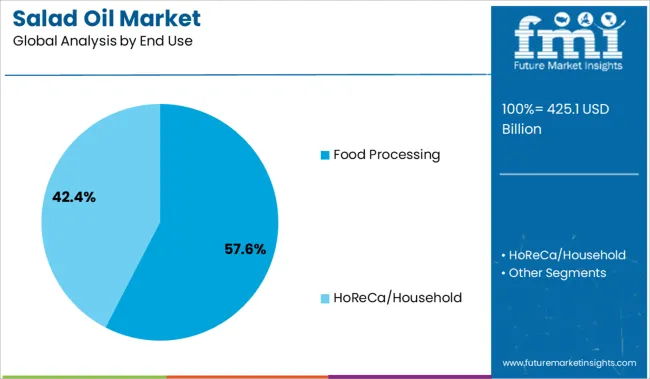
The demand for salad oil is on the rise as salad oil is used in the food processing industry mainly, in the preparation of salad dressing, bakery mixes, mayonnaise, and also for pizza crust.
In households, hotels, and restaurants, salad oil is used for salad dressing preparation as well as preparing cold dishes, such as bread dips and drizzling over food, providing impetus to the overall sales of salad oil.
The rising demand for salad oil can also be attributed to the fact that customers who have been dealing with various lifestyle-related issues such as diabetes, obesity, etc. since a young age are paying heed to where the food ingredients come from, and the quality of the ingredients used.
Consumers have demanded transparency as a result of increased chemical use in manufacturing and increased awareness of the health risks associated with tainted foods thereby surging the sales of salad oil as they are choosing the food with more nutritive value.
Don't pay for what you don't need
Customize your report by selecting specific countries or regions and save 30%!
The demand for salad oil is mainly driven by the increasing consumption of processed food products such as mayonnaise, salad dressings, etc.
Mayonnaise and salad dressing products first originated in the European region and are consumed on a large scale in European countries, in turn, spurring the sales of salad oil as well.
And the demand for salad oil as well as sales of salad oil is greatly pushed forward by the growing adoption of European food culture worldwide, such as the consumption of salad and introduction, such as antipasto.
Salad oil from vegetable sources is healthy due to the high content of monounsaturated fats and polyphenols, encouraging many to go for it thereby soaring the sales of salad oil.
The rising sales of salad oil are also on account of the fact that salad oil is low in saturated fat content and is trans-fat free that are unhealthy.
The Benefits associated with salad oil in connection with weight loss, inflammation reduction, and risk of heart disease reduction further augment the demand for salad oil around the world.
The demand for salad oil is likely to go up as polyphenols have antioxidant properties, and have been discussed to reduce the risk of diabetes, cardiovascular problems, and neurodegenerative diseases.
The rise in the health consciousness around the globe is increasing the opportunity for healthy products, including salad oil and the same is expected to greatly aid the global sales of salad oil.
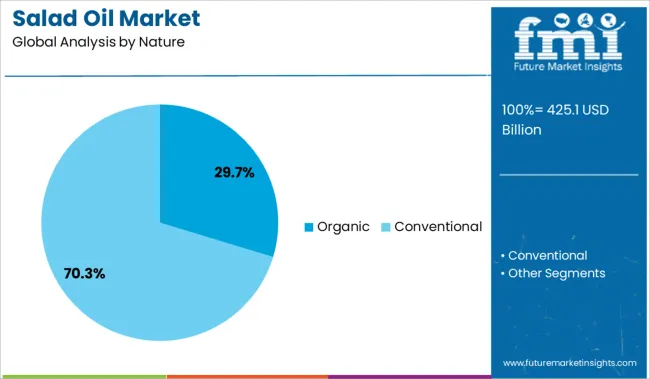
The salad oil market share is likely to expand as manufacturers of salad oil are providing organic, non-GMO, Kosher, Halal, and SQF-certified products.
And considering the current consumer perception and demand for such products, manufacturers offering salad oil with these claims have increased the overall demand for salad oil.
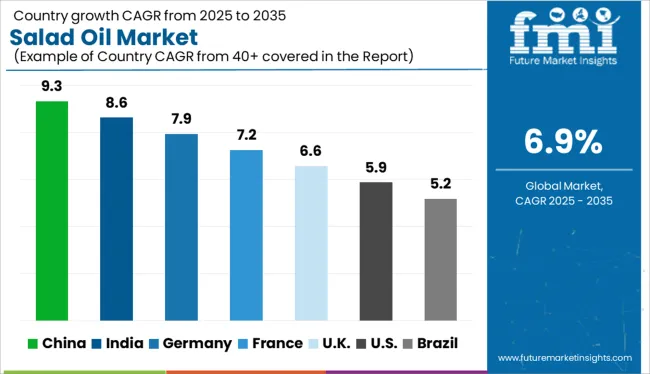
Currently, the global salad oil market share is dominated by the North American and European regions due to the regular consumption of salad and salad dressing products such as salad oil.
In the Asia Pacific and the Middle East and African region, due to the changing food culture and eating habits, demand for salad oil is on the surge.
The increasing middle-class population and middle-class population income are creating a conducive environment for the overall sales of salad oil since the purchasing power of the customer is increasing in these regions.
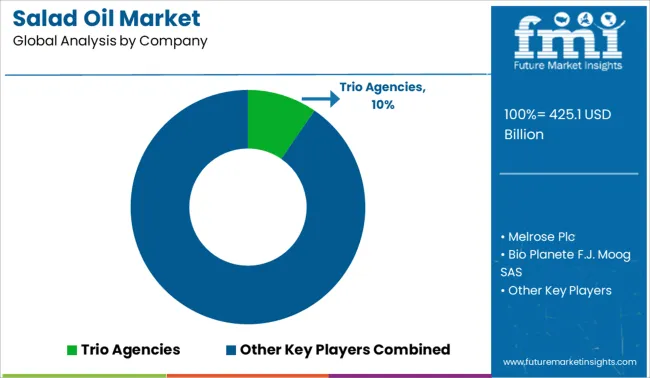
Some of the key players in the salad oil market include Trio Agencies, Melrose Plc, Bio Planete F.J. Moog SAS, Salad Oils International Corporation, Cargill Inc., PYCO Industries, Avatar Corporation, COFCO Corporation, Sovena Group, Stratas Foods,
A few other key players are Maeva Group International, Archer Daniels Midland Company, California Rice Oil Company, AG Processing Inc., and Columbus Vegetable Oils.
Manufacturers are innovating new products to have improvised properties to consolidate their market position by expanding their salad oil market share.
One such recent development in the salad oil market is the blend of vegetable oil and omega-3 derived from marine sources that have increased health benefits.
Report Attribute | Details |
---|---|
Growth Rate | CAGR of 6.9% from 2022 to 2032 |
Base Year for Estimation | 2021 |
Historical Data | 2014 to 2020 |
Forecast Period | 2022 to 2032 |
Quantitative Units | Revenue in USD Million, Volume in Kilotons, and CAGR from 2022 to 2032 |
Report Coverage | Revenue Forecast, Volume Forecast, Company Ranking, Competitive Landscape, Growth Factors, Trends, and Pricing Analysis |
Segments Covered |
|
Regions Covered |
|
Key Countries Profiled |
|
Key Companies Profiled |
|
Customization | Available Upon Request |
Get the data you need at a Fraction of the cost
Personalize your report by choosing insights you need
and save 40%!
The global salad oil market is projected to move ahead with a CAGR of 6.9% during the forecast period (2022 to 2032).
The salad oil market share is mainly driven by the increasing consumption of processed food products such as mayonnaise, salad dressings, etc.
Some of the key players in the global salad oil market are Trio Agencies, Melrose Plc, Bio Planete F.J. Moog SAS, Salad Oils International Corporation, and Cargill Inc.
1. Executive Summary | Salad Oil Market
1.1. Key Findings
1.1.1. Overall Market
1.1.2. Segment Overview
1.1.3. Regional Overview
1.1.4. Competitor’s Focus
1.1.5. Consumer’s Perception
1.2. Summary of Statistics
1.3. Market Characteristics and Attributes
2. Market Overview
2.1. Introduction and Definition
2.2. Research Scope
3. COVID 19 Impact Assessment
3.1. Demand in Market
3.1.1. Global Market Quarterly Market Value Analysis (US$ Thousand), 2021
3.1.2. Global Market Value Y-o-Y Growth Pre and Post-Crisis Projection
3.1.3. Global Market Recalibrated Growth Projection (US$ Thousand), 2021 & 2021
3.2. Market Shrink and Recovery Trend Assessment, by Region
3.3. Market Recalibrated Market and Growth Assessment, by Region
4. Market Background
4.1. Country-wise Market Attractiveness Index
4.2. Market Scenario-based Forecast
4.3. Value Chain Analysis
4.3.1. List of Manufacturers
4.3.2. List of Online Retailers
4.3.3. List of End-Use Industries
4.4. Investment Feasibility Assessment
4.4.1. Investment Feasibility for Market
4.5. Porter’s Five Forces Analysis
4.5.1. Bargaining Power of Buyers
4.5.2. Bargaining Power of Suppliers
4.5.3. Threat of Substitute End Uses
4.5.4. Threat of New Entrants
4.5.5. Intensity of Rivalry
4.5.6. 5 Forces Acting Upon Market
4.6. PESTEL Analysis
4.7. Forecast Factors
4.7.1. Increasing Government Regulations
4.7.2. Expansion of Industry
4.7.3. Compliance with Insurance Regulations
4.7.4. Advancements in Market
4.7.5. Increasing Global Temperature
4.7.6. Technological Advancements
4.8. Market Dynamics
4.8.1. Market Drivers
4.8.2. Market Restraints
4.8.3. Opportunity Windows
4.8.4. Key Trends
5. Global Market Pricing Analysis
5.1. Price Point Assessment
5.1.1. Weighted Average Pricing (2020), by Region
5.1.2. Key Factors Influencing Pricing
5.1.3. Price Benchmark by Region
5.1.4. Price Benchmark by Nature
6. Global Market Analysis (2017 to 2021) and Forecast (2022 to 2032)
6.1. Market Overview
6.2. Introduction to Market Statistics
6.2.1. Global Market Volume (Units)
6.2.2. Global Market Value (US$ Thousand)
6.2.3. Global Cumulative Historical Market and Absolute $ Opportunity
6.3. Y-o-Y Growth and Incremental Opportunity
6.4. Absolute Dollar Historical Market and Absolute Dollar Opportunity
7. Global Market Analysis (2017 to 2021) and Forecast (2022 to 2032), by Nature
7.1. Introduction
7.1.1. Nature Definition
7.1.1.1. Organic
7.1.1.2. Conventional
7.1.2. Market Key Findings, by Nature
7.1.2.1. Absolute $ Opportunity (2022 to 2032)
7.1.2.2. Market Share and BPS Analysis
7.1.2.3. Y-o-Y Growth Projections
7.1.2.4. Market Attractiveness Analysis
7.2. Global Market Regional Market Share Comparison, by Nature
8. Global Market Analysis (2017 to 2021) and Forecast (2022 to 2032), by End Use
8.1. Introduction
8.1.1. End Use Definition
8.1.1.1. Food Processing
8.1.1.2. HoReCa/Household
8.1.2. Market Key Findings, by End Use
8.1.2.1. Absolute $ Opportunity (2022 to 2032)
8.1.2.2. Market Share and BPS Analysis
8.1.2.3. Y-o-Y Growth Projections
8.1.2.4. Market Attractiveness Analysis
8.2. Global Market Regional Market Share Comparison, by End Use
9. Global Market Analysis (2017 to 2021) and Forecast (2022 to 2032), by Source
9.1. Introduction
9.1.1. End Use Definition
9.1.1.1. Peanut Oil
9.1.1.2. Corn Oil
9.1.1.3. Cottonseed Oil
9.1.1.4. Soybean Oil
9.1.1.5. Sunflower Oil
9.1.1.6. Canola Oil
9.1.1.7. Olive Oil
9.1.2. Market Key Findings, by Source
9.1.2.1. Absolute $ Opportunity (2022 to 2032)
9.1.2.2. Market Share and BPS Analysis
9.1.2.3. Y-o-Y Growth Projections
9.1.2.4. Market Attractiveness Analysis
9.2. Global Market Regional Market Share Comparison, by Source
10. Global Market Analysis (2017 to 2021) and Forecast (2022 to 2032), by Distribution Channel
10.1. Introduction
10.1.1. Distribution Channel Definition
10.1.1.1. Direct Sales/B2B
10.1.1.2. Indirect Sales/B2C
10.1.1.3. Supermarket/Hypermarket
10.1.1.4. Online Retail
10.1.1.5. Specialty Stores
10.1.1.6. General Grocery Stores
10.1.1.7. Online Stores
10.1.2. Market Key Findings, by Distribution Channel
10.1.2.1. Absolute $ Opportunity (2022 to 2032)
10.1.2.2. Market Share and BPS Analysis
10.1.2.3. Y-o-Y Growth Projections
10.1.2.4. Market Attractiveness Analysis
10.2. Global Market Regional Market Share Comparison, by Distribution Channel
11. Global Market Analysis (2017 to 2021) and Forecast (2022 to 2032), by Region
11.1. Introduction
11.1.1. Regional Coverage
11.1.1.1. North America
11.1.1.2. Europe
11.1.1.3. East Asia
11.1.1.4. South Asia
11.1.1.5. Latin America
11.1.1.6. Middle East & Africa (MEA)
11.1.1.7. Oceania
11.1.2. Market Key Findings, by Region
11.1.2.1. Absolute $ Opportunity (2022 to 2032)
11.1.2.2. Market Share and BPS Analysis
11.1.2.3. Y-o-Y Growth Projections
11.1.2.4. Market Attractiveness Analysis
11.2. Global Market Regional Market Share Comparison, by Region
12. North America Market Analysis and Forecast
12.1. Overview
12.1.1. North America Share in Global Market
12.2. Market Value & Volume Forecast and Analysis
12.2.1. By Country
12.2.1.1. USA
12.2.1.2. Canada
12.2.2. By Nature
12.2.3. By End Use
12.2.4. By Application
12.2.5. By Distribution Channel
12.3. Market Attractiveness Analysis
12.3.1. By Country
12.3.1.1. USA
12.3.1.2. Canada
12.3.2. By Nature
12.3.3. By End Use
12.3.4. By Application
12.3.5. By Distribution Channel
12.4. Y-o-Y Growth Comparison
13. Europe Market Analysis and Forecast
13.1. Overview
13.1.1. Europe's Share in Global Market
13.2. Market Value & Volume Forecast and Analysis
13.2.1. By Country
13.2.1.1. Germany
13.2.1.2. United Kingdom
13.2.1.3. France
13.2.1.4. Russia
13.2.1.5. Spain
13.2.1.6. Italy
13.2.1.7. Rest of Europe
13.2.2. By Nature
13.2.3. By End Use
13.2.4. By Application
13.2.5. By Distribution Channel
13.3. Market Attractiveness Analysis
13.3.1. By Country
13.3.1.1. Germany
13.3.1.2. United Kingdom
13.3.1.3. France
13.3.1.4. Russia
13.3.1.5. Spain
13.3.1.6. Italy
13.3.1.7. Rest of Europe
13.3.2. By Nature
13.3.3. By End Use
13.3.4. By Application
13.3.5. By Distribution Channel
13.4. Y-o-Y Growth Comparison
14. East Asia Market Analysis and Forecast
14.1. Overview
14.1.1. East Asia Share in Global Market
14.2. Market Value & Volume Forecast and Analysis
14.2.1. By Country
14.2.1.1. China
14.2.1.2. Japan
14.2.1.3. South Korea
14.2.2. By Nature
14.2.3. By End Use
14.2.4. By Application
14.2.5. By Distribution Channel
14.3. Market Attractiveness Analysis
14.3.1. By Country
14.3.1.1. China
14.3.1.2. Japan
14.3.1.3. South Korea
14.3.2. By Nature
14.3.3. By End Use
14.3.4. By Application
14.3.5. By Distribution Channel
14.4. Y-o-Y Growth Comparison
15. South Asia Market Analysis and Forecast
15.1. Overview
15.1.1. South Asia Share in Global Market
15.2. Market Value & Volume Forecast and Analysis
15.2.1. By Country
15.2.1.1. India
15.2.1.2. Singapore
15.2.1.3. Indonesia
15.2.1.4. Thailand
15.2.1.5. Rest of South Asia
15.2.2. By Nature
15.2.3. By End Use
15.2.4. By Application
15.2.5. By Distribution Channel
15.3. Market Attractiveness Analysis
15.3.1. By Country
15.3.1.1. India
15.3.1.2. Singapore
15.3.1.3. Indonesia
15.3.1.4. Thailand
15.3.1.5. Rest of South Asia
15.3.2. By Nature
15.3.3. By End Use
15.3.4. By Application
15.3.5. By Distribution Channel
15.4. Y-o-Y Growth Comparison
16. Latin America Market Analysis and Forecast
16.1. Overview
16.1.1. Latin America Share in Global Market
16.2. Market Value & Volume Forecast and Analysis
16.2.1. By Country
16.2.1.1. Brazil
16.2.1.2. Mexico
16.2.1.3. Rest of LATAM
16.2.2. By Nature
16.2.3. By End Use
16.2.4. By Application
16.2.5. By Distribution Channel
16.3. Market Attractiveness Analysis
16.3.1. By Country
16.3.1.1. Brazil
16.3.1.2. Mexico
16.3.1.3. Rest of LATAM
16.3.2. By Nature
16.3.3. By End Use
16.3.4. By Application
16.3.5. By Distribution Channel
16.4. Y-o-Y Growth Comparison
17. Middle East & Africa Market Analysis and Forecast
17.1. Overview
17.1.1. Middle East & Africa Share in Global Market
17.2. Market Value & Volume Forecast and Analysis
17.2.1. By Country
17.2.1.1. Turkey
17.2.1.2. GCC Countries
17.2.1.3. South Asia
17.2.1.4. Rest of Middle East and Africa
17.2.2. By Nature
17.2.3. By End Use
17.2.4. By Application
17.2.5. By Distribution Channel
17.3. Market Attractiveness Analysis
17.3.1. By Country
17.3.1.1. Turkey
17.3.1.2. GCC Countries
17.3.1.3. South Asia
17.3.1.4. Rest of Middle East and Africa
17.3.2. By Nature
17.3.3. By End Use
17.3.4. By Application
17.3.5. By Distribution Channel
17.4. Y-o-Y Growth Comparison
18. Oceania Market Analysis and Forecast
18.1. Overview
18.1.1. Oceania's Share in Global Market
18.2. Market Value & Volume Forecast and Analysis
18.2.1. By Country
18.2.1.1. Australia
18.2.1.2. New Zealand
18.2.2. By Nature
18.2.3. By End Use
18.2.4. By Application
18.2.5. By Distribution Channel
18.3. Market Attractiveness Analysis
18.3.1. By Country
18.3.1.1. Australia
18.3.1.2. New Zealand
18.3.2. By Nature
18.3.3. By End Use
18.3.4. By Application
18.3.5. By Distribution Channel
18.4. Y-o-Y Growth Comparison
19. Global Market Analysis Key Countries
19.1.1. USA
19.1.1.1. Share of North American Market
19.1.1.2. Market Share, by Nature, 2021
19.1.1.3. Market Share, by End Use, 2021
19.1.1.4. Market Value (US$ Thousand) and Forecast 2022 to 2032
19.1.1.5. Market Share, by Distribution Channel, 2021
19.1.2. Canada
19.1.2.1. Share of North American Market
19.1.2.2. Market Share, by Nature, 2021
19.1.2.3. Market Share, by End Use, 2021
19.1.2.4. Market Value (US$ Thousand) and Forecast 2022 to 2032
19.1.2.5. Market Share, by Distribution Channel, 2021
19.1.3. Germany
19.1.3.1. Share of the European Market
19.1.3.2. Market Share, by Nature, 2021
19.1.3.3. Market Share, by End Use, 2021
19.1.3.4. Market Value (US$ Thousand) and Forecast 2022 to 2032
19.1.3.5. Market Share, by Distribution Channel, 2021
19.1.4. United Kingdom
19.1.4.1. Share of the European Market
19.1.4.2. Market Share, by Nature, 2021
19.1.4.3. Market Share, by End Use, 2021
19.1.4.4. Market Value (US$ Thousand) and Forecast 2022 to 2032
19.1.4.5. Market Share, by Distribution Channel, 2021
19.1.5. France
19.1.5.1. Share of the European Market
19.1.5.2. Market Share, by Nature, 2021
19.1.5.3. Market Share, by End Use, 2021
19.1.5.4. Market Value (US$ Thousand) and Forecast 2022 to 2032
19.1.5.5. Market Share, by Distribution Channel, 2021
19.1.6. Russia
19.1.6.1. Share of the European Market
19.1.6.2. Market Share, by Nature, 2021
19.1.6.3. Market Share, by End Use, 2021
19.1.6.4. Market Value (US$ Thousand) and Forecast 2022 to 2032
19.1.6.5. Market Share, by Distribution Channel, 2021
19.1.7. Spain
19.1.7.1. Share of the European Market
19.1.7.2. Market Share, by Nature, 2021
19.1.7.3. Market Share, by End Use, 2021
19.1.7.4. Market Value (US$ Thousand) and Forecast 2022 to 2032
19.1.7.5. Market Share, by Distribution Channel, 2021
19.1.8. Italy
19.1.8.1. Share of the European Market
19.1.8.2. Market Share, by Nature, 2021
19.1.8.3. Market Share, by End Use, 2021
19.1.8.4. Market Value (US$ Thousand) and Forecast 2022 to 2032
19.1.8.5. Market Share, by Distribution Channel, 2021
19.1.9. China
19.1.9.1. Share of East Asian Market
19.1.9.2. Market Share, by Nature, 2021
19.1.9.3. Market Share, by End Use, 2021
19.1.9.4. Market Value (US$ Thousand) and Forecast 2022 to 2032
19.1.9.5. Market Share, by Distribution Channel, 2021
19.1.10. Japan
19.1.10.1. Share of East Asian Market
19.1.10.2. Market Share, by Nature, 2021
19.1.10.3. Market Share, by End Use, 2021
19.1.10.4. Market Value (US$ Thousand) and Forecast 2022 to 2032
19.1.10.5. Market Share, by Distribution Channel, 2021
19.1.11. South Korea
19.1.11.1. Share of East Asian Market
19.1.11.2. Market Share, by Nature, 2021
19.1.11.3. Market Share, by End Use, 2021
19.1.11.4. Market Value (US$ Thousand) and Forecast 2022 to 2032
19.1.11.5. Market Share, by Distribution Channel, 2021
19.1.12. India
19.1.12.1. Share of the South Asian Market
19.1.12.2. Market Share, by Nature, 2021
19.1.12.3. Market Share, by End Use, 2021
19.1.12.4. Market Value (US$ Thousand) and Forecast 2022 to 2032
19.1.12.5. Market Share, by Distribution Channel, 2021
19.1.13. Singapore
19.1.13.1. Share of the South Asian Market
19.1.13.2. Market Share, by Nature, 2021
19.1.13.3. Market Share, by End Use, 2021
19.1.13.4. Market Value (US$ Thousand) and Forecast 2022 to 2032
19.1.13.5. Market Share, by Distribution Channel, 2021
19.1.14. Indonesia
19.1.14.1. Share of the South Asian Market
19.1.14.2. Market Share, by Nature, 2021
19.1.14.3. Market Share, by End Use, 2021
19.1.14.4. Market Value (US$ Thousand) and Forecast 2022 to 2032
19.1.14.5. Market Share, by Distribution Channel, 2021
19.1.15. Thailand
19.1.15.1. Share of the South Asian Market
19.1.15.2. Market Share, by Nature, 2021
19.1.15.3. Market Share, by End Use, 2021
19.1.15.4. Market Value (US$ Thousand) and Forecast 2022 to 2032
19.1.15.5. Market Share, by Distribution Channel, 2021
19.1.16. Brazil
19.1.16.1. Share of the Latin American Market
19.1.16.2. Market Share, by Nature, 2021
19.1.16.3. Market Share, by End Use, 2021
19.1.16.4. Market Value (US$ Thousand) and Forecast 2022 to 2032
19.1.16.5. Market Share, by Distribution Channel, 2021
19.1.17. Mexico
19.1.17.1. Share of the Latin American Market
19.1.17.2. Market Share, by Nature, 2021
19.1.17.3. Market Share, by End Use, 2021
19.1.17.4. Market Value (US$ Thousand) and Forecast 2022 to 2032
19.1.17.5. Market Share, by Distribution Channel, 2021
19.1.18. Turkey
19.1.18.1. Share of Middle East and Africa Market
19.1.18.2. Market Share, by Nature, 2021
19.1.18.3. Market Share, by End Use, 2021
19.1.18.4. Market Value (US$ Thousand) and Forecast 2022 to 2032
19.1.18.5. Market Share, by Distribution Channel, 2021
19.1.19. GCC Countries
19.1.19.1. Share of Middle East and Africa Market
19.1.19.2. Market Share, by Nature, 2021
19.1.19.3. Market Share, by End Use, 2021
19.1.19.4. Market Value (US$ Thousand) and Forecast 2022 to 2032
19.1.19.5. Market Share, by Distribution Channel, 2021
19.1.20. South Africa
19.1.20.1. Share of Middle East and Africa Market
19.1.20.2. Market Share, by Nature, 2021
19.1.20.3. Market Share, by End Use, 2021
19.1.20.4. Market Value (US$ Thousand) and Forecast 2022 to 2032
19.1.20.5. Market Share, by Distribution Channel, 2021
19.1.21. Australia
19.1.21.1. Share of Oceania Market
19.1.21.2. Market Share, by Nature, 2021
19.1.21.3. Market Share, by End Use, 2021
19.1.21.4. Market Value (US$ Thousand) and Forecast 2022 to 2032
19.1.21.5. Market Share, by Distribution Channel, 2021
19.1.22. New Zealand
19.1.22.1. Share of Oceania Market
19.1.22.2. Market Share, by Nature, 2021
19.1.22.3. Market Share, by End Use, 2021
19.1.22.4. Market Value (US$ Thousand) and Forecast 2022 to 2032
19.1.22.5. Market Share, by Distribution Channel, 2021
20. Competition Landscape
20.1. Global Market Competition Dashboard
20.2. Global Market Tier Structure
20.2.1. Market Structure in 2020
20.2.2. Anticipated Market Structure in 2032
20.3. Global Market Share Analysis
21. Competition Analysis
21.1. Trio Agencies
21.1.1. Company Overview
21.1.2. End Use Portfolio
21.1.3. Key Strategies
21.1.4. Regional Presence
21.1.5. Key Developments
21.1.6. SWOT Analysis
21.2. Melrose Plc
21.2.1. Company Overview
21.2.2. End Use Portfolio
21.2.3. Key Strategies
21.2.4. Regional Presence
21.2.5. Key Developments
21.2.6. SWOT Analysis
21.3. Bio Planete F.J. Moog SAS
21.3.1. Company Overview
21.3.2. End Use Portfolio
21.3.3. Key Strategies
21.3.4. Regional Presence
21.3.5. Key Developments
21.3.6. SWOT Analysis
21.4. Salad Oils International Corporation
21.4.1. Company Overview
21.4.2. End Use Portfolio
21.4.3. Key Strategies
21.4.4. Regional Presence
21.4.5. Key Developments
21.4.6. SWOT Analysis
21.5. Cargill Inc.
21.5.1. Company Overview
21.5.2. End Use Portfolio
21.5.3. Key Strategies
21.5.4. Regional Presence
21.5.5. Key Developments
21.5.6. SWOT Analysis
21.6. PYCO Industries
21.6.1. Company Overview
21.6.2. End Use Portfolio
21.6.3. Key Strategies
21.6.4. Regional Presence
21.6.5. Key Developments
21.6.6. SWOT Analysis
21.7. Avatar Corporation
21.7.1. Company Overview
21.7.2. End Use Portfolio
21.7.3. Key Strategies
21.7.4. Regional Presence
21.7.5. Key Developments
21.7.6. SWOT Analysis
21.8. COFCO Corporation
21.8.1. Company Overview
21.8.2. End Use Portfolio
21.8.3. Key Strategies
21.8.4. Regional Presence
21.8.5. Key Developments
21.8.6. SWOT Analysis
21.9. Sovena Group
21.9.1. Company Overview
21.9.2. End Use Portfolio
21.9.3. Key Strategies
21.9.4. Regional Presence
21.9.5. Key Developments
21.9.6. SWOT Analysis
21.10. Stratas Foods
21.10.1. Company Overview
21.10.2. End Use Portfolio
21.10.3. Key Strategies
21.10.4. Regional Presence
21.10.5. Key Developments
21.10.6. SWOT Analysis
21.11. Maeva Group International
21.11.1. Company Overview
21.11.2. End Use Portfolio
21.11.3. Key Strategies
21.11.4. Regional Presence
21.11.5. Key Developments
21.11.6. SWOT Analysis
21.12. Archer Daniels Midland Company
21.12.1. Company Overview
21.12.2. End Use Portfolio
21.12.3. Key Strategies
21.12.4. Regional Presence
21.12.5. Key Developments
21.12.6. SWOT Analysis
21.13. California Rice Oil Company
21.13.1. Company Overview
21.13.2. End Use Portfolio
21.13.3. Key Strategies
21.13.4. Regional Presence
21.13.5. Key Developments
21.13.6. SWOT Analysis
21.14. AG Processing Inc.
21.14.1. Company Overview
21.14.2. End Use Portfolio
21.14.3. Key Strategies
21.14.4. Regional Presence
21.14.5. Key Developments
21.14.6. SWOT Analysis
21.15. Columbus Vegetable Oils
21.15.1. Company Overview
21.15.2. End Use Portfolio
21.15.3. Key Strategies
21.15.4. Regional Presence
21.15.5. Key Developments
21.15.6. SWOT Analysis
22. Appendix
23. Definitions of Analytical Frameworks
24. Sources and References
Explore Food and Beverage Insights
View Reports