Robotic Palletizers & De-Palletizers Market Outlook 2023 to 2033

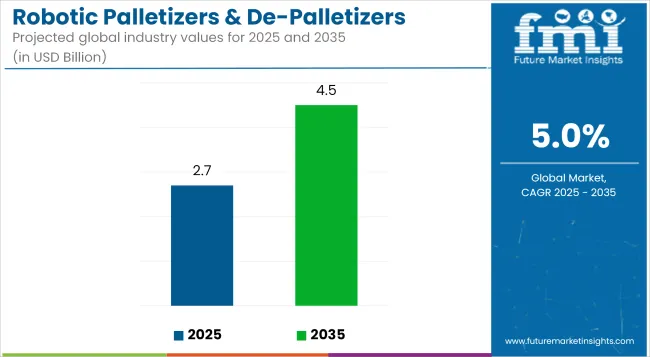
The robotic palletizers & de-palletizers market is expected to strengthen its boundaries at a steady CAGR of 4.7% during the forecast period. The market is expected to hold a share of US$ 2.53 billion in 2023 while it is anticipated to cross a value of US$ 4.0 billion by 2033.

The research report on the robotic palletizers & de-Palletizers market explains that the high penetration of automation in industries is fuelling the demand for robotic palletizers. The properties like enhanced handling of high-SKU counts and aligning the multi-line operations have pushed end users to choose robotic palletizers & de-palletizers over conventional ones. However, both types have their pros and cons, the robotic palletizers work efficiently and are good at manipulating the product while turning boxes for display. There are other palletizer & depalletizer applications significantly used in the packaging line. Robotic systems are semi- and fully automatic robotic systems that are greatly taking over the manual picking processes as they can be applied in extreme climatic conditions with maximum speed and accuracy.

The robotic palletizers & de-palletizers market outlook states that the increased level of safety with a small number of sprains, strains, tears, and overexertion provided by robotic system are garnering market growth. High demand for robotic palletizers and de-palletizers is due to the factors like increased productivity, better product handling, limited operating costs, and improved workplace safety. The palletizers are helpful as they work 24/7 if maintained properly. Also, the pre-programed robots with enhanced sensors and camera tracking help increasing the overall productivity at a packaging line. Furthermore, the increased number of manufacturing, distribution, and fulfillment plants are also gaining traction for the robotic palletizers & de-palletizers market.

Attributes Details
Robotic Palletizers & De-Palletizers Market CAGR (2023 to 2033) 4.7%
Robotic Palletizers & De-Palletizers Market Size (2023) US$ 2.53 billion
Robotic Palletizers & De-Palletizers Market Size (2033) US$ 4.0 billion

Don't pay for what you don't need

Customize your report by selecting specific countries or regions and save 30%!

How is the Future Outlook (2023 to 2033) for Robotic Palletizers & De-Palletizers Market in Comparison to the Historical Pattern (2018 to 2022)? 

  • Short-term Growth (2023 to 2026): During this period, Consistent demand for robotic palletizers & de-palletizers for tracking logistics of both - industrial and non-industrial applications uplifts market growth. The market is expected to hold US$ 2.53 billion in 2023 while it is anticipated to reach US$ 2.94 billion by 2026
  • Mid-term Growth (2026 to 2029): This period’s growth is likely to be attributed to the planned sustainable and efficient automation of packaging products. South Asia & East Asia are anticipated to dominate with a market value share of almost 48% in the global robotic palletizers & de-palletizers market by the year 2030. From US$ 2.94 in 2026, the market is expected to land at a value of US$ 3.48 billion in 2029.
  • Long-term Growth (2029 to 2033): Growing focus on increasing productivity and efficient operability are likely to garner the market growth. Furthermore, new companies with AI integration and the addition of machine learning are likely to fuel the demand. Thus, the robotic palletizers & de-palletizers market is anticipated to thrive at a steady CAGR of 4.7% between 2023 and 2033.

What’s to drive the Demand for Robotic Palletizers & De-Palletizers?

High Operational Efficiency to Drive the Demand

Manual palletizing is not feasible for large or heavy pallet loads. Also, the probability of mishandling pallets leading to the destruction of products is very high. Furthermore, several allowances are desired by the laborers for job satisfaction and productive working. All these factors lead to the low pace of operation when done manually.

Robotic palletizers and de-palletizers overcome the majority of disadvantages of manual palletizing and de-palletizing, and prove to be a highly productive and economic industrial solution in the long run, despite its high initial investment as compared to wages of labor.

Advancement in technology has reduced the requirement for frequent maintenance of the machinery. Palletizing systems are capable of operating at a high pace without making any error as compared to manual palletizing.

Robotic palletizers and de-palletizers can operate continuously all day long and handle much heavy loads. All these benefits of robotic palletizers and de-palletizers lead to highly productive performance and are therefore driving the demand for palletizing systems over conventional palletizing.

Ismail Sutaria
Ismail Sutaria

Principal Consultant

Talk to Analyst

Find your sweet spots for generating winning opportunities in this market.

How do Medium and Low Output Manufacturers Get Benefited?

Easy Availability of Economical Robotic Palletizers to Help

The prominent barrier to the sales of robotic palletizers used to be the high price of the advanced technology. Moreover, palletizers with high specifications cost high and exclude the requirement of medium and low-output manufacturers.

Various market players have found an opportunity in targeting the requirements oflow-output manufacturers and develop products that can render high efficiency for alow-output manufacturer, as well as catalyze the buying capability of such manufacturers. Although the demand for industrial robots in China is the high, the robot density in China is as low as 68 robots per 10,000 labors.

Millions of manufacturing and warehousing facilities in China and other countries of Asia Pacific, Latin America, and Eastern Europe countries have created a huge opportunity for the palletizers market with the increasing availability of economical palletizers. Besides, a wholly new concept of layer de-palletizing & palletizing introduced by the players is likely to also help small-scale manufacturers to achieve economical automation.

What are the Key Trends?

Shift towards Robotics from Conventional Palletizers to be the Key Trend

Conventional palletizing systems have dominated the market for ages but manufacturers are experiencing a shift toward robotics. Robotic palletizers & de-palletizers provide flexibility and the capability to palletize different stock-keeping units with minimal change over time.

Existing traditional palletizers are going old and manufacturers have been getting many requests from customers to replace traditional structures with robotics. Conventional palletizers cannot manage many stock-keeping units efficiently.

Over the past few years, packaging styles have changed dramatically. It is increasingly difficult for traditional palletizers to accommodate these new packets. To make the product more sought-after for customers, the packaging manufacturers might modifypackaging. Such modifications require versatility, a feature lacking by most obsolete traditional palletizers.

As traditional palletizers make room for robotic palletizers & de-palletizers using small robots, the process is less centralized. The move towards this configuration and a move away from the conventional configuration has already begun.

Get the data you need at a Fraction of the cost

Personalize your report by choosing insights you need
and save 40%!

Robotic Palletizers & De-Palletizers Market Country-wise Insights 

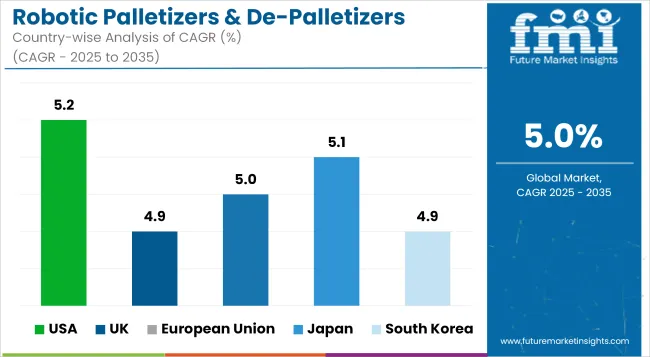
Regions CAGR (2023 to 2033)
The United States 3.4%
China 4.7%
India 6.6%
Germany 2.7%
Canada 4.0%

How does the United States Robotic Palletizers & De-Palletizers Market lead in terms of Market Share?

Increased Number of Manufacturing Hubs along with the Distribution and Fulfillment Facilities are Gaining Traction for the Market

The United States Market CAGR (2023 to 2033) 3.4%
The United States Market Sales Volume (2023) 2948

As per FMI’s analysis, the United States robotic palletizers & de-palletizers market is thriving at an average CAGR of 3.4% between 2023 and 2033. The market is anticipated to hold a sales volume of 2948 units in 2023. The United States was severely affected by COVID-19, which drastically hindered the usage of robotic palletizers & de-palletizers between March 2020 and September 2021.

Moderate shutdowns in production plants coupled with labor strikes and job cuts have slowed down the growth rate for robotic palletizers & de-palletizers in the region. However, the market is getting back to normal in the post-Covid era. The high expenditure on products and services businesses is garnering the sales of robotic solutions from businesses involving a packaging line.

What makes Canada the leading market for Robotic Palletizers & De-Palletizers Solutions in North America in terms of CAGR?

The Presence of E-commerce Spaces along with the Government limiting Accidents in the Packaging line is Flourishing the Demand

Canada Market CAGR (2023 to 2033) 4.0%
Canada Market Sales Volume (2023) 896

Canada robotic palletizers & de-palletizers market thrives at a CAGR of 4.0% between 2023 and 2033 while it is anticipated to hold a sales volume of 896. Demand for robotic palletizers & de-palletizers in North America is expected to be the most prominent on a global scale. The growth is attributed to the expansion of the product line, packaging services, and e-commerce businesses. Furthermore, the restoration of manufacturing space along with extended packaging units is gaining traction in Canada market.

Why is India Considered One of the Most Lucrative Markets for Robotic Palletizers & De-Palletizers?

India Market CAGR (2023 to 2033) 6.6%
India Market Sales Volume (2023) (Units) 1947

India is another significant robotic palletizers & de-palletizers market in terms of CAGR in East Asia region. It thrives at a strong CAGR of 6.6% between 2023 and 2033 while it holds a sales volume of 1947 units in 2023.

It is expected to return to supply chain normality due to the availability of bouncing back of the production of raw materials in the region. This regional market is expected to offer potential value-creation opportunities during the forecast period. Manufacturers are seeing sizable innovation by leveraging technology, so as to re-purpose production and packaging lines quickly to deal with the demands of consumers. From that viewpoint, people are also accepting essential technology and automation more than ever before.

Category-wise Insights

Segment Top Product Type
Top Sub-segment De-palletizers
CAGR (2023 to 2033) 4.6%
CAGR (2017 to 2022) 4.7%

Easy and Efficient Unloading, Increased Imports, and a High Number of Warehouses are Flourishing the demand for De-palletizers

Based on the product, De-palletizers are estimated to thrive at a CAGR of 4.6% till the end of the forecast period. The growth is attributed to the high imports and unloading being the tricky part of any packaging line. Furthermore, the decline in the growth of palletizers is due to the consistent increase in production cost. The prominent expansion of the food & beverage and pharmaceutical industries is also expected to create new opportunities for market growth. Previously, the segment thrived at a slightly high CAGR of 4.7% between 2017 and 2022.

The Unique Selling Point: The Vision System

When a pallet of goods is delivered, upon reaching the destination, it needs to be dismantled. Robotics play a vital role in de-palletizing. Because of material changes during transit, the process turns out to be difficult.

Prior to trucking, a carton, or box may not be where it was in comparison with other items on the pallet. Products can travel around on a pallet during transit, which makes it more difficult to de-palletize because integrators have to make the work chamber more adaptive to identify where the product is located.

Integrators have to locate the kit first for de-palletizing. To locate each layer on a pallet at a time, the vision system directs the robot. To pick the case, the vision system could change its de-palletizing program. To successfully carry out de-palletizing, each layer needs to be located.

Cameras are incorporated with the vision system so that the objects are correctly selected. A vision system is used to de-palletize in warehouses and re-distribution centres, where several products are on a pallet, to make it easy to stack for delivery to the next destination.

Competition Scenario

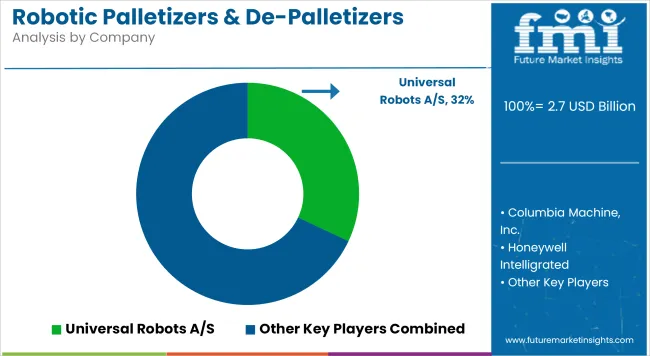
The global robotic palletizers & de-palletizers market is consolidated in nature with key manufacturers focusing on providing tailored solutions as per the end-use industry demand. The leading manufacturers operating in the global robotic palletizers & de-palletizers market also aim at maximizing production volume, thereby expanding their reach globally and diversifying their product portfolio.

Market Developments

  • FANUC has its AI learning functionality in its robots product portfolio in collaboration with Preferred Network Inc.
  • KUKA AG has introduced its automatic palletizing and depalletizing solutions. The brand offers flexible and readily available products for system integrators. These palletizers and de-palletizers are customized, easy-to-integrate, and easy-to-operate palletizing systems.

Key Players

  • ABB Ltd.
  • Mitsubishi Electric Corporation
  • Kawasaki Heavy Industries, Ltd.
  • FANUC Corporation
  • Yaskawa Electric Corporation
  • KUKA AG
  • Krones AG
  • Brenton, LLC
  • Remtec Automation, LLC
  • DAN-Palletiser A/S

Key Segments

By Product Type:

  • Palletizers:

    • Boxes/Cases
    • Bags/Sacks
    • Bundles
    • Others (Pails, Drums, Trays etc.)
  • De-Palletizers:

    • Boxes/Cases
    • Bags/Sacks
    • Bundles
    • Others (Pails, Drums, Trays etc.)

By Place:

  • Factories
  • Distribution Centers (DCs)
  • Fulfilment Centers (FCs)
  • Others

By Machine Type:

  • Articulated Robots
  • Collaborative Robots

By Application:

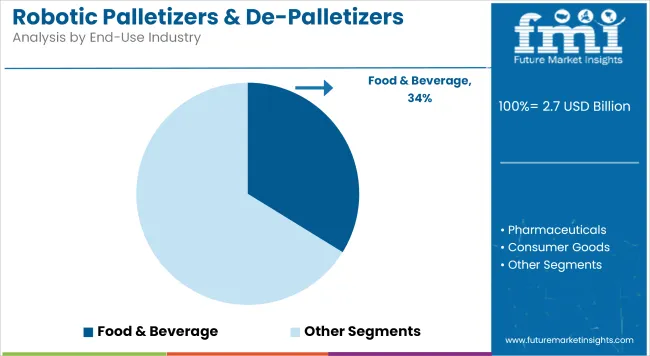
  • Food and Beverages
  • Pharmaceutical
  • Consumer Products
  • Tracking and Logistics
  • Industrial Packaging

Key Regions Covered:

  • North America
    • The United States
    • Canada
  • Latin America
    • Brazil
    • Mexico
    • Rest of Latin America
  • Europe
    • Germany
    • The United Kingdom
    • France
    • Spain
    • Russia
    • Rest of Europe
  • Japan
  • Asia Pacific excluding Japan
    • China
    • India
    • Malaysia
    • Singapore
    • Australia
    • Rest of Asia Pacific excluding Japan
  • The Middle East and Africa
    • GCC Countries
    • Israel
    • South Africa
    • Rest of the Middle East and Africa

Frequently Asked Questions

What is the Present Market Valuation?

The market is valued at US$ 2.53 billion in 2023.

What Makes Canada the Leading Market in North America in terms of CAGR?

The presence of e-commerce spaces makes Canada the leading market in North America.

What is the Growth Forecast for the Market in the United States?

The market in the United States is estimated to record a 3.4% CAGR.

What is the Projected Industry Size?

The industry is estimated to reach US$ 4.0 billion by 2033.

What is the Key Trend in the Market?

The shift toward robotics from conventional palletizers is the key trend.

Table of Content

1. Executive Summary | Robotic Palletizers & De-Palletizers Market

    1.1. Global Market Outlook

    1.2. Demand-side Trends

    1.3. Supply-side Trends

    1.4. Technology Roadmap Analysis

    1.5. Analysis and Recommendations

2. Market Overview

    2.1. Market Coverage / Taxonomy

    2.2. Market Definition / Scope / Limitations

3. Market Background

    3.1. Market Dynamics

        3.1.1. Drivers

        3.1.2. Restraints

        3.1.3. Opportunity

        3.1.4. Trends

    3.2. Scenario Forecast

        3.2.1. Demand in Optimistic Scenario

        3.2.2. Demand in Likely Scenario

        3.2.3. Demand in Conservative Scenario

    3.3. Opportunity Map Analysis

    3.4. Product Life Cycle Analysis

    3.5. Supply Chain Analysis

        3.5.1. Supply Side Participants and their Roles

            3.5.1.1. Producers

            3.5.1.2. Mid-Level Participants (Traders/ Agents/ Brokers)

            3.5.1.3. Wholesalers and Distributors

        3.5.2. Value Added and Value Created at Node in the Supply Chain

        3.5.3. List of Raw Material Suppliers

        3.5.4. List of Existing and Potential Buyer’s

    3.6. Investment Feasibility Matrix

    3.7. Value Chain Analysis

        3.7.1. Profit Margin Analysis

        3.7.2. Wholesalers and Distributors

        3.7.3. Retailers

    3.8. PESTLE and Porter’s Analysis

    3.9. Regulatory Landscape

        3.9.1. By Key Regions

        3.9.2. By Key Countries

    3.10. Regional Parent Market Outlook

    3.11. Production and Consumption Statistics

    3.12. Import and Export Statistics

4. Global Market Analysis 2018 to 2022 and Forecast, 2023 to 2033

    4.1. Historical Market Size Value (US$ Million) & Volume (Units) Analysis, 2018 to 2022

    4.2. Current and Future Market Size Value (US$ Million) & Volume (Units) Projections, 2023 to 2033

        4.2.1. Y-o-Y Growth Trend Analysis

        4.2.2. Absolute $ Opportunity Analysis

5. Global Market Analysis 2018 to 2022 and Forecast 2023 to 2033, By Product Type

    5.1. Introduction / Key Findings

    5.2. Historical Market Size Value (US$ Million) & Volume (Units) Analysis By Product Type, 2018 to 2022

    5.3. Current and Future Market Size Value (US$ Million) & Volume (Units) Analysis and Forecast By Product Type, 2023 to 2033

        5.3.1. Boxes/Cases

        5.3.2. Bags/Sacks

        5.3.3. Bundles

        5.3.4. Others

    5.4. Y-o-Y Growth Trend Analysis By Product Type, 2018 to 2022

    5.5. Absolute $ Opportunity Analysis By Product Type, 2023 to 2033

6. Global Market Analysis 2018 to 2022 and Forecast 2023 to 2033, By Place

    6.1. Introduction / Key Findings

    6.2. Historical Market Size Value (US$ Million) & Volume (Units) Analysis By Place, 2018 to 2022

    6.3. Current and Future Market Size Value (US$ Million) & Volume (Units) Analysis and Forecast By Place, 2023 to 2033

        6.3.1. Factories

        6.3.2. Distribution Centres

        6.3.3. Fulfilment Centres

        6.3.4. Others

    6.4. Y-o-Y Growth Trend Analysis By Place, 2018 to 2022

    6.5. Absolute $ Opportunity Analysis By Place, 2023 to 2033

7. Global Market Analysis 2018 to 2022 and Forecast 2023 to 2033, By Machine Type

    7.1. Introduction / Key Findings

    7.2. Historical Market Size Value (US$ Million) & Volume (Units) Analysis By Machine Type, 2018 to 2022

    7.3. Current and Future Market Size Value (US$ Million) & Volume (Units) Analysis and Forecast By Machine Type, 2023 to 2033

        7.3.1. Articulated Robots

        7.3.2. Collaborative Robots

    7.4. Y-o-Y Growth Trend Analysis By Machine Type, 2018 to 2022

    7.5. Absolute $ Opportunity Analysis By Machine Type, 2023 to 2033

8. Global Market Analysis 2018 to 2022 and Forecast 2023 to 2033, By End Use

    8.1. Introduction / Key Findings

    8.2. Historical Market Size Value (US$ Million) & Volume (Units) Analysis By End Use, 2018 to 2022

    8.3. Current and Future Market Size Value (US$ Million) & Volume (Units) Analysis and Forecast By End Use, 2023 to 2033

        8.3.1. Food & Beverages

        8.3.2. Pharmaceutical

        8.3.3. Consumer Products

        8.3.4. Tracking and Logistics

        8.3.5. Industrial Packaging

    8.4. Y-o-Y Growth Trend Analysis By End Use, 2018 to 2022

    8.5. Absolute $ Opportunity Analysis By End Use, 2023 to 2033

9. Global Market Analysis 2018 to 2022 and Forecast 2023 to 2033, By Region

    9.1. Introduction

    9.2. Historical Market Size Value (US$ Million) & Volume (Units) Analysis By Region, 2018 to 2022

    9.3. Current Market Size Value (US$ Million) & Volume (Units) Analysis and Forecast By Region, 2023 to 2033

        9.3.1. North America

        9.3.2. Latin America

        9.3.3. Europe

        9.3.4. East Asia

        9.3.5. South Asia

        9.3.6. Oceania

        9.3.7. Middle East and Africa

    9.4. Market Attractiveness Analysis By Region

10. North America Market Analysis 2018 to 2022 and Forecast 2023 to 2033, By Country

    10.1. Historical Market Size Value (US$ Million) & Volume (Units) Trend Analysis By Market Taxonomy, 2018 to 2022

    10.2. Market Size Value (US$ Million) & Volume (Units) Forecast By Market Taxonomy, 2023 to 2033

        10.2.1. By Country

            10.2.1.1. USA

            10.2.1.2. Canada

        10.2.2. By Product Type

        10.2.3. By Place

        10.2.4. By Machine Type

        10.2.5. By End Use

    10.3. Market Attractiveness Analysis

        10.3.1. By Country

        10.3.2. By Product Type

        10.3.3. By Place

        10.3.4. By Machine Type

        10.3.5. By End Use

    10.4. Key Takeaways

11. Latin America Market Analysis 2018 to 2022 and Forecast 2023 to 2033, By Country

    11.1. Historical Market Size Value (US$ Million) & Volume (Units) Trend Analysis By Market Taxonomy, 2018 to 2022

    11.2. Market Size Value (US$ Million) & Volume (Units) Forecast By Market Taxonomy, 2023 to 2033

        11.2.1. By Country

            11.2.1.1. Brazil

            11.2.1.2. Mexico

            11.2.1.3. Rest of Latin America

        11.2.2. By Product Type

        11.2.3. By Place

        11.2.4. By Machine Type

        11.2.5. By End Use

    11.3. Market Attractiveness Analysis

        11.3.1. By Country

        11.3.2. By Product Type

        11.3.3. By Place

        11.3.4. By Machine Type

        11.3.5. By End Use

    11.4. Key Takeaways

12. Europe Market Analysis 2018 to 2022 and Forecast 2023 to 2033, By Country

    12.1. Historical Market Size Value (US$ Million) & Volume (Units) Trend Analysis By Market Taxonomy, 2018 to 2022

    12.2. Market Size Value (US$ Million) & Volume (Units) Forecast By Market Taxonomy, 2023 to 2033

        12.2.1. By Country

            12.2.1.1. Germany

            12.2.1.2. Italy

            12.2.1.3. France

            12.2.1.4. United kingdom

            12.2.1.5. Spain

            12.2.1.6. BENELUX

            12.2.1.7. Russia

            12.2.1.8. Rest of Europe

        12.2.2. By Product Type

        12.2.3. By Place

        12.2.4. By Machine Type

        12.2.5. By End Use

    12.3. Market Attractiveness Analysis

        12.3.1. By Country

        12.3.2. By Product Type

        12.3.3. By Place

        12.3.4. By Machine Type

        12.3.5. By End Use

    12.4. Key Takeaways

13. East Asia Market Analysis 2018 to 2022 and Forecast 2023 to 2033, By Country

    13.1. Historical Market Size Value (US$ Million) & Volume (Units) Trend Analysis By Market Taxonomy, 2018 to 2022

    13.2. Market Size Value (US$ Million) & Volume (Units) Forecast By Market Taxonomy, 2023 to 2033

        13.2.1. By Country

            13.2.1.1. China

            13.2.1.2. Japan

            13.2.1.3. South Korea

        13.2.2. By Product Type

        13.2.3. By Place

        13.2.4. By Machine Type

        13.2.5. By End Use

    13.3. Market Attractiveness Analysis

        13.3.1. By Country

        13.3.2. By Product Type

        13.3.3. By Place

        13.3.4. By Machine Type

        13.3.5. By End Use

    13.4. Key Takeaways

14. South Asia Market Analysis 2018 to 2022 and Forecast 2023 to 2033, By Country

    14.1. Historical Market Size Value (US$ Million) & Volume (Units) Trend Analysis By Market Taxonomy, 2018 to 2022

    14.2. Market Size Value (US$ Million) & Volume (Units) Forecast By Market Taxonomy, 2023 to 2033

        14.2.1. By Country

            14.2.1.1. Malaysia

            14.2.1.2. Thailand

            14.2.1.3. India

            14.2.1.4. Rest of South Asia

        14.2.2. By Product Type

        14.2.3. By Place

        14.2.4. By Machine Type

        14.2.5. By End Use

    14.3. Market Attractiveness Analysis

        14.3.1. By Country

        14.3.2. By Product Type

        14.3.3. By Place

        14.3.4. By Machine Type

        14.3.5. By End Use

    14.4. Key Takeaways

15. Oceania Market Analysis 2018 to 2022 and Forecast 2023 to 2033, By Country

    15.1. Historical Market Size Value (US$ Million) & Volume (Units) Trend Analysis By Market Taxonomy, 2018 to 2022

    15.2. Market Size Value (US$ Million) & Volume (Units) Forecast By Market Taxonomy, 2023 to 2033

        15.2.1. By Country

            15.2.1.1. Australia

            15.2.1.2. New Zealand

        15.2.2. By Product Type

        15.2.3. By Place

        15.2.4. By Machine Type

        15.2.5. By End Use

    15.3. Market Attractiveness Analysis

        15.3.1. By Country

        15.3.2. By Product Type

        15.3.3. By Place

        15.3.4. By Machine Type

        15.3.5. By End Use

    15.4. Key Takeaways

16. Middle East and Africa Market Analysis 2018 to 2022 and Forecast 2023 to 2033, By Country

    16.1. Historical Market Size Value (US$ Million) & Volume (Units) Trend Analysis By Market Taxonomy, 2018 to 2022

    16.2. Market Size Value (US$ Million) & Volume (Units) Forecast By Market Taxonomy, 2023 to 2033

        16.2.1. By Country

            16.2.1.1. GCC Countries

            16.2.1.2. South Africa

            16.2.1.3. Türkiye

            16.2.1.4. Rest of Middle East and Africa

        16.2.2. By Product Type

        16.2.3. By Place

        16.2.4. By Machine Type

        16.2.5. By End Use

    16.3. Market Attractiveness Analysis

        16.3.1. By Country

        16.3.2. By Product Type

        16.3.3. By Place

        16.3.4. By Machine Type

        16.3.5. By End Use

    16.4. Key Takeaways

17. Key Countries Market Analysis

    17.1. USA

        17.1.1. Pricing Analysis

        17.1.2. Market Share Analysis, 2022

            17.1.2.1. By Product Type

            17.1.2.2. By Place

            17.1.2.3. By Machine Type

            17.1.2.4. By End Use

    17.2. Canada

        17.2.1. Pricing Analysis

        17.2.2. Market Share Analysis, 2022

            17.2.2.1. By Product Type

            17.2.2.2. By Place

            17.2.2.3. By Machine Type

            17.2.2.4. By End Use

    17.3. Brazil

        17.3.1. Pricing Analysis

        17.3.2. Market Share Analysis, 2022

            17.3.2.1. By Product Type

            17.3.2.2. By Place

            17.3.2.3. By Machine Type

            17.3.2.4. By End Use

    17.4. Mexico

        17.4.1. Pricing Analysis

        17.4.2. Market Share Analysis, 2022

            17.4.2.1. By Product Type

            17.4.2.2. By Place

            17.4.2.3. By Machine Type

            17.4.2.4. By End Use

    17.5. Germany

        17.5.1. Pricing Analysis

        17.5.2. Market Share Analysis, 2022

            17.5.2.1. By Product Type

            17.5.2.2. By Place

            17.5.2.3. By Machine Type

            17.5.2.4. By End Use

    17.6. Italy

        17.6.1. Pricing Analysis

        17.6.2. Market Share Analysis, 2022

            17.6.2.1. By Product Type

            17.6.2.2. By Place

            17.6.2.3. By Machine Type

            17.6.2.4. By End Use

    17.7. France

        17.7.1. Pricing Analysis

        17.7.2. Market Share Analysis, 2022

            17.7.2.1. By Product Type

            17.7.2.2. By Place

            17.7.2.3. By Machine Type

            17.7.2.4. By End Use

    17.8. United kingdom

        17.8.1. Pricing Analysis

        17.8.2. Market Share Analysis, 2022

            17.8.2.1. By Product Type

            17.8.2.2. By Place

            17.8.2.3. By Machine Type

            17.8.2.4. By End Use

    17.9. Spain

        17.9.1. Pricing Analysis

        17.9.2. Market Share Analysis, 2022

            17.9.2.1. By Product Type

            17.9.2.2. By Place

            17.9.2.3. By Machine Type

            17.9.2.4. By End Use

    17.10. BENELUX

        17.10.1. Pricing Analysis

        17.10.2. Market Share Analysis, 2022

            17.10.2.1. By Product Type

            17.10.2.2. By Place

            17.10.2.3. By Machine Type

            17.10.2.4. By End Use

    17.11. Russia

        17.11.1. Pricing Analysis

        17.11.2. Market Share Analysis, 2022

            17.11.2.1. By Product Type

            17.11.2.2. By Place

            17.11.2.3. By Machine Type

            17.11.2.4. By End Use

    17.12. China

        17.12.1. Pricing Analysis

        17.12.2. Market Share Analysis, 2022

            17.12.2.1. By Product Type

            17.12.2.2. By Place

            17.12.2.3. By Machine Type

            17.12.2.4. By End Use

    17.13. Japan

        17.13.1. Pricing Analysis

        17.13.2. Market Share Analysis, 2022

            17.13.2.1. By Product Type

            17.13.2.2. By Place

            17.13.2.3. By Machine Type

            17.13.2.4. By End Use

    17.14. South Korea

        17.14.1. Pricing Analysis

        17.14.2. Market Share Analysis, 2022

            17.14.2.1. By Product Type

            17.14.2.2. By Place

            17.14.2.3. By Machine Type

            17.14.2.4. By End Use

    17.15. Malaysia

        17.15.1. Pricing Analysis

        17.15.2. Market Share Analysis, 2022

            17.15.2.1. By Product Type

            17.15.2.2. By Place

            17.15.2.3. By Machine Type

            17.15.2.4. By End Use

    17.16. Thailand

        17.16.1. Pricing Analysis

        17.16.2. Market Share Analysis, 2022

            17.16.2.1. By Product Type

            17.16.2.2. By Place

            17.16.2.3. By Machine Type

            17.16.2.4. By End Use

    17.17. India

        17.17.1. Pricing Analysis

        17.17.2. Market Share Analysis, 2022

            17.17.2.1. By Product Type

            17.17.2.2. By Place

            17.17.2.3. By Machine Type

            17.17.2.4. By End Use

    17.18. Australia

        17.18.1. Pricing Analysis

        17.18.2. Market Share Analysis, 2022

            17.18.2.1. By Product Type

            17.18.2.2. By Place

            17.18.2.3. By Machine Type

            17.18.2.4. By End Use

    17.19. New Zealand

        17.19.1. Pricing Analysis

        17.19.2. Market Share Analysis, 2022

            17.19.2.1. By Product Type

            17.19.2.2. By Place

            17.19.2.3. By Machine Type

            17.19.2.4. By End Use

    17.20. GCC Countries

        17.20.1. Pricing Analysis

        17.20.2. Market Share Analysis, 2022

            17.20.2.1. By Product Type

            17.20.2.2. By Place

            17.20.2.3. By Machine Type

            17.20.2.4. By End Use

    17.21. South Africa

        17.21.1. Pricing Analysis

        17.21.2. Market Share Analysis, 2022

            17.21.2.1. By Product Type

            17.21.2.2. By Place

            17.21.2.3. By Machine Type

            17.21.2.4. By End Use

    17.22. Türkiye

        17.22.1. Pricing Analysis

        17.22.2. Market Share Analysis, 2022

            17.22.2.1. By Product Type

            17.22.2.2. By Place

            17.22.2.3. By Machine Type

            17.22.2.4. By End Use

18. Market Structure Analysis

    18.1. Competition Dashboard

    18.2. Competition Benchmarking

    18.3. Market Share Analysis of Top Players

        18.3.1. By Regional

        18.3.2. By Product Type

        18.3.3. By Place

        18.3.4. By Machine Type

        18.3.5. By End Use

19. Competition Analysis

    19.1. Competition Deep Dive

        19.1.1. ABB Ltd.,

            19.1.1.1. Overview

            19.1.1.2. Product Portfolio

            19.1.1.3. Profitability by Market Segments

            19.1.1.4. Sales Footprint

            19.1.1.5. Strategy Overview

                19.1.1.5.1. Marketing Strategy

                19.1.1.5.2. Product Strategy

                19.1.1.5.3. Channel Strategy

        19.1.2. Kawasaki Heavy Industries, Ltd. and

            19.1.2.1. Overview

            19.1.2.2. Product Portfolio

            19.1.2.3. Profitability by Market Segments

            19.1.2.4. Sales Footprint

            19.1.2.5. Strategy Overview

                19.1.2.5.1. Marketing Strategy

                19.1.2.5.2. Product Strategy

                19.1.2.5.3. Channel Strategy

        19.1.3. FANUC Corporation

            19.1.3.1. Overview

            19.1.3.2. Product Portfolio

            19.1.3.3. Profitability by Market Segments

            19.1.3.4. Sales Footprint

            19.1.3.5. Strategy Overview

                19.1.3.5.1. Marketing Strategy

                19.1.3.5.2. Product Strategy

                19.1.3.5.3. Channel Strategy

        19.1.4. Mitsubishi Electric Corporation,

            19.1.4.1. Overview

            19.1.4.2. Product Portfolio

            19.1.4.3. Profitability by Market Segments

            19.1.4.4. Sales Footprint

            19.1.4.5. Strategy Overview

                19.1.4.5.1. Marketing Strategy

                19.1.4.5.2. Product Strategy

                19.1.4.5.3. Channel Strategy

        19.1.5. Yaskawa Electric Corporation,

            19.1.5.1. Overview

            19.1.5.2. Product Portfolio

            19.1.5.3. Profitability by Market Segments

            19.1.5.4. Sales Footprint

            19.1.5.5. Strategy Overview

                19.1.5.5.1. Marketing Strategy

                19.1.5.5.2. Product Strategy

                19.1.5.5.3. Channel Strategy

        19.1.6. KUKA AG

            19.1.6.1. Overview

            19.1.6.2. Product Portfolio

            19.1.6.3. Profitability by Market Segments

            19.1.6.4. Sales Footprint

            19.1.6.5. Strategy Overview

                19.1.6.5.1. Marketing Strategy

                19.1.6.5.2. Product Strategy

                19.1.6.5.3. Channel Strategy

        19.1.7. Krones AG

            19.1.7.1. Overview

            19.1.7.2. Product Portfolio

            19.1.7.3. Profitability by Market Segments

            19.1.7.4. Sales Footprint

            19.1.7.5. Strategy Overview

                19.1.7.5.1. Marketing Strategy

                19.1.7.5.2. Product Strategy

                19.1.7.5.3. Channel Strategy

        19.1.8. Brenton, LLC

            19.1.8.1. Overview

            19.1.8.2. Product Portfolio

            19.1.8.3. Profitability by Market Segments

            19.1.8.4. Sales Footprint

            19.1.8.5. Strategy Overview

                19.1.8.5.1. Marketing Strategy

                19.1.8.5.2. Product Strategy

                19.1.8.5.3. Channel Strategy

        19.1.9. Remtec Automation, LLC

            19.1.9.1. Overview

            19.1.9.2. Product Portfolio

            19.1.9.3. Profitability by Market Segments

            19.1.9.4. Sales Footprint

            19.1.9.5. Strategy Overview

                19.1.9.5.1. Marketing Strategy

                19.1.9.5.2. Product Strategy

                19.1.9.5.3. Channel Strategy

        19.1.10. Dan-Palletiser A/S

            19.1.10.1. Overview

            19.1.10.2. Product Portfolio

            19.1.10.3. Profitability by Market Segments

            19.1.10.4. Sales Footprint

            19.1.10.5. Strategy Overview

                19.1.10.5.1. Marketing Strategy

                19.1.10.5.2. Product Strategy

                19.1.10.5.3. Channel Strategy

20. Assumptions & Acronyms Used

21. Research Methodology

Recommendations

Packaging

Palletizer Market

March 2024

REP-GB-7084

235 pages

Packaging

Robotic Aseptic Syringe Filler Capper Market

July 2022

REP-GB-3239

333 pages

Explore Packaging Insights

View Reports
Future Market Insights

Robotic Palletizers & De-Palletizers Market

Schedule a Call