The Reverse Logistics Market is estimated to be valued at USD 1322.9 billion in 2025 and is projected to reach USD 4108.6 billion by 2035, registering a compound annual growth rate (CAGR) of 12.0% over the forecast period.
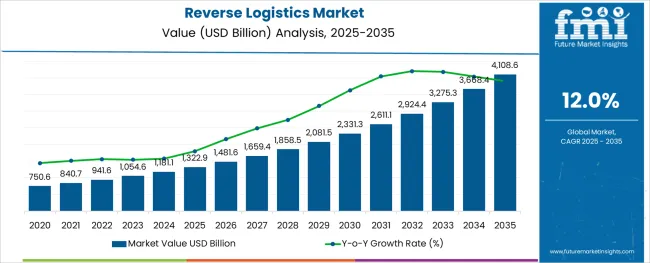
The reverse logistics market is gaining strong momentum due to heightened environmental regulations, rising pressure for circular supply chains, and cost-efficiency goals across global industries. Companies are increasingly prioritizing the optimization of return flows to improve asset recovery, reduce landfill waste, and enhance customer experience.
The integration of tracking technologies, data analytics, and automation in return operations has led to improved transparency and faster turnaround times, which are critical in sectors such as electronics, retail, and automotive. Consumer awareness about sustainability and end-of-life product management is also driving manufacturers to reconfigure their logistics networks for backward integration.
Looking ahead, the market is expected to benefit from stricter compliance mandates, green certification programs, and the integration of third-party reverse logistics providers to manage complex, value-retaining returns.
The market is segmented by Solution Type, Process Type, and Return Type and region. By Solution Type, the market is divided into Services and Software. In terms of Process Type, the market is classified into Recycling and Waste Management, Remanufacturing, Refurbishment, Servicing, and Others.
Based on Return Type, the market is segmented into Repairable Returns, End-of-Use Returns, and Others. Regionally, the market is classified into North America, Latin America, Western Europe, Eastern Europe, Balkan & Baltic Countries, Russia & Belarus, Central Asia, East Asia, South Asia & Pacific, and the Middle East & Africa.
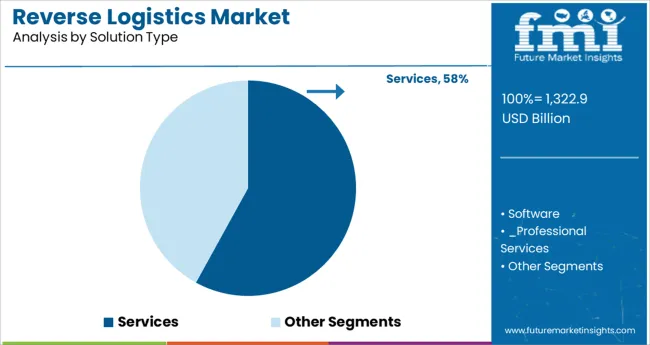
Services are projected to account for 58.0% of the total revenue in the reverse logistics market by 2025, establishing them as the dominant solution type. This leadership is being reinforced by the growing demand for specialized third-party logistics providers capable of handling inspection, restocking, repackaging, and transportation of returned goods.
Businesses are outsourcing these processes to reduce internal complexity, improve turnaround efficiency, and focus on core operations. The rise of omnichannel retail, warranty-based product models, and value recovery objectives have further increased the reliance on reverse logistics services.
Additionally, the ability to customize return flows based on product category, condition, and geography is positioning services as an adaptable and scalable solution across verticals.
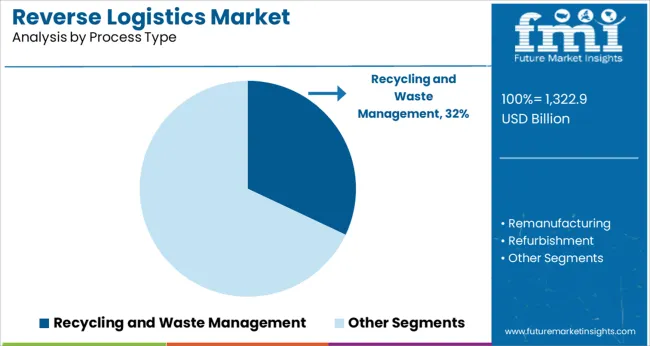
Recycling and waste management is expected to capture 32.0% of the reverse logistics market share in 2025, making it the leading process type. This segment’s strength is being driven by regulatory pressure on landfill diversion, extended producer responsibility (EPR) laws, and a global push toward decarbonization.
Organizations are adopting closed-loop systems to reclaim materials such as plastics, metals, and rare earth components, which not only reduces environmental impact but also recovers residual value. Strategic investments in waste sorting technologies and material recovery facilities are further enabling efficient large-scale operations.
As brands continue to emphasize environmental compliance and circularity goals, recycling-led reverse logistics processes are expected to expand their footprint across manufacturing and consumer goods sectors.
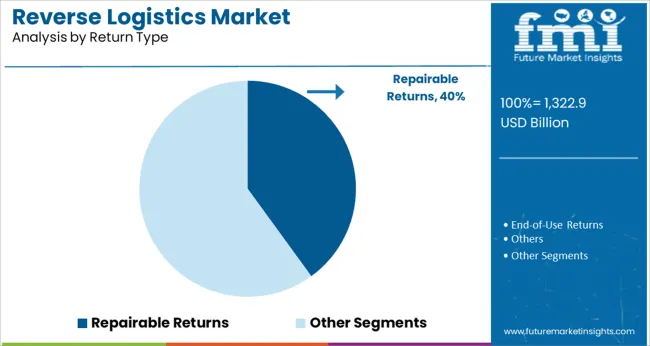
Repairable returns are projected to account for 40.0% of total reverse logistics volume in 2025, positioning them as the top return type. This segment’s growth is being supported by the increasing cost of raw materials, emphasis on extending product lifecycles, and the rise of refurbished product markets.
Companies are implementing structured repair and refurbishment programs to enhance sustainability metrics and recover product value. The demand for repairable logistics is particularly strong in electronics, automotive components, and heavy equipment, where serviceability and part reuse are operationally and financially beneficial.
The shift toward modular product designs and standardized spare part systems is also simplifying repair workflows, encouraging broader adoption of this return model.
The growth of automation technology and increasing trials and innovations in this sector is expected to keep it the dominant end-user vertical for the global reverse logistics market players and help it grow throughout the anticipated time period.
Stronger government investment in the construction of transportation infrastructure is also expected to contribute favorably to the expansion of the reverse logistics industry and its services. For example, in May 2024, the Brazilian government declared plans for a USD 50 billion investment in ports, highways, and railroads, following which the regions’ reverse logistics businesses are finding it simpler to locate the opportunities and provide service thereafter.
Additional and higher investment in outsourcing reverse logistics services has been seen across the world as a result of increasing retail sales, an increase in the introduction of novel electronic products, and strict regulatory prohibitions against the selling of unsafe goods to consumers.
For reverse logistics service providers the cross-border, B2B & B2C warehousing, rapid package delivery, end-to-end supply chain management, and technical support services are all anticipated to be expanded as a result of this financing trend. For example, in the case, the Gurgaon-based logistics company Delhivery disclosed in May 2024 that it had secured a USD 275 Million funding round for entering the reverse logistics market in the region.
However, the dependability, competence, and integrity of logistics service providers are entirely reliant on the producer and merchants that create the foundation for its success. And because this situation involves a lack of direct control since the manufacturing or retailing organization is dependent on the long-term service providers, the new players find it arduous to acquire clients, penetrate the market, and get established. Additionally, the manufacturer is unable to keep an eye on what is happening in the warehouse, which renders the reverse logistics consulting with additional responsibilities.
Furthermore, contracting with a third-party reverse logistics (3PL) business may result in a confidentiality breach, exposing customer personal data or allowing the exchange of information that is economically sensitive. The adoption of reverse logistics returns is also constrained by obstacles, including a lack of coordination at the retail vendor level and misalignment of the company's demand and service location capacity.
The reverse logistics market size is projected to rise due to the global expansion of eCommerce which increased the number of returns and replacement items, as well as the demand for reverse logistics service.
As manufacturers become more aware of the need to reduce negative environmental impact, the adoption of reverse logistics services to ensure uninterrupted client satisfaction is increasing around the world. Reverse logistics market share is rising as it is a critical component of the supply chain in many industries, including automotive, electronics, pharmaceuticals, and others.
The demand for reverse logistics is projected to grow as countries all over the world have developed and implemented reverse logistics services to extract value from returned and damaged products.
According to FMI Analysts, returns are worth nearly a trillion dollars worldwide each year and have become more common as eCommerce has grown. As a result, the demand for reverse logistics is projected to rise during the forecast period.
The goals of reverse logistics are to recover value and ensure repeat business. In-store purchases are returned at a rate of less than 10%, whereas items ordered online are returned at a rate of at least 30%.
The adoption of reverse logistics is projected to rise as it is used by astute businesses to increase customer loyalty and repeat business while minimizing return losses.
Warehousing, reselling, recycling management, returns management, replacement management, and environmental compliance are all applications of reverse logistics. As a result, these factors are anticipated to boost reverse logistics market expansion.
Increased innovation and the development of automation technologies are two major factors driving reverse logistics market growth. Several governments' initiatives to build transportation infrastructure are expected to boost the adoption of reverse logistics in the forecast period. Furthermore, with the rapid development of the e-commerce sector, the reverse logistics market expansion is expected to be boosted by increased demand for returns and replacements.
As the number of retail returns increases, so do the challenges and opportunities in reverse logistics market for better understanding consumer behavior and increasing future sales. Returns are quickly becoming one of the most difficult supply chain challenges that businesses face today. The demand for reverse logistics is predicted to rise as maintaining a healthy inventory turn and operating expenses requires a reverse logistics supply chain management strategy.
The adoption of reverse logistics is growing as it aids companies understand how, when, and why customers return items. Reverse logistics is critical to understanding purchasing behavior and improving overall experience. Moreover, every product return provides an opportunity to learn more about the customer, drive the next sale, and make the sale stick. As a result, this factor is anticipated to provide growth opportunities for reverse logistics market players.
Online returns are frequently the result of digital challenges such as poor image display and incorrect fit. Variations in manufacturer sizing contribute to more than half of all customer returns due to product size or fit. Key trends in the reverse logistics market include retail models such as curated shopping, rentals, and try-on services are adding to the volume of eCommerce returns. These retail models condition customers to make returns because they are based on the assumption that some, or all, of the items ordered, will be returned.
Reverse logistics aids companies aid in transforming siloed return policies and processes into a holistic returns strategy to turn reverse logistics market challenges into opportunities. Knowing when, how, and why customers return is part of that supply chain transformation, as is applying smarter insights throughout the reverse logistics supply chain.
Manufacturers and retailers rely entirely on the dependability, competency, and integrity of logistics service providers. The manufacturing or retailing company is reliant on the logistics service provider in this scenario, resulting in a lack of direct control. Furthermore, the manufacturer is unable to monitor warehouse operations, posing a serious threat to product quality and affecting the demand for reverse logistics.
Outsourcing to a third-party reverse logistics (3PL) company may result in a breach of confidentiality, exposing customer personal data or sharing commercially sensitive information. This factor is also one of the challenges in the reverse logistics market.
Barriers such as a lack of coordination at the CEO level and a misalignment of the company's short and long-term strategic goals also limit the adoption of reverse logistics services. As a result, the lack of manufacturer control over reverse logistics services is expected to hinder the reverse logistics market growth.
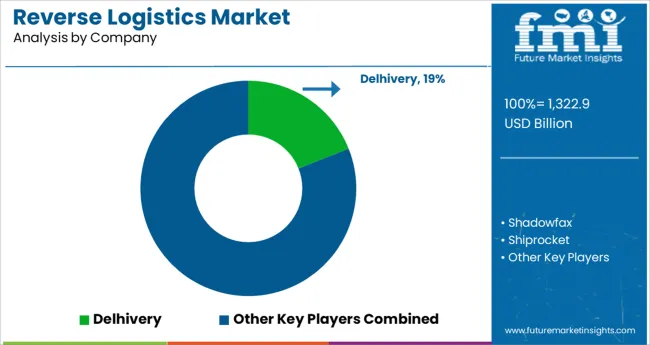
The reverse logistics market is moderately fragmented, with the presence of both established and new players. To gain the greatest market share, the majority of the market's key players are pursuing various strategies such as alliances, partnerships, and mergers.
Startups in reverse logistics services and software solutions are expanding their portfolios. To attract new customers, these businesses are focusing on providing extensive services and developing new technologies.
Software developers are working to improve their distribution channels and sales structure in order to reach out to emerging markets while strategically maintaining relationships with existing clients.
A key startup in the reverse logistics market, ShipBob is a tech-savvy 3PL that specializes in reverse logistics for direct-to-consumer eCommerce stores. They integrate seamlessly with eCommerce platforms such as Amazon, Shopify, and BigCommerce (among others).
ShipBob can stock products in their warehouse before packaging and shipping them to customers. ShipBob has its own return process and also works with Happy Returns and Returnly.
The global reverse logistics market is estimated to be valued at USD 1,322.9 billion in 2025.
It is projected to reach USD 4,108.6 billion by 2035.
The market is expected to grow at a 12.0% CAGR between 2025 and 2035.
The key product types are services, software, _professional services and _managed services.
recycling and waste management segment is expected to dominate with a 32.0% industry share in 2025.


Our Research Products

The "Full Research Suite" delivers actionable market intel, deep dives on markets or technologies, so clients act faster, cut risk, and unlock growth.

The Leaderboard benchmarks and ranks top vendors, classifying them as Established Leaders, Leading Challengers, or Disruptors & Challengers.

Locates where complements amplify value and substitutes erode it, forecasting net impact by horizon

We deliver granular, decision-grade intel: market sizing, 5-year forecasts, pricing, adoption, usage, revenue, and operational KPIs—plus competitor tracking, regulation, and value chains—across 60 countries broadly.

Spot the shifts before they hit your P&L. We track inflection points, adoption curves, pricing moves, and ecosystem plays to show where demand is heading, why it is changing, and what to do next across high-growth markets and disruptive tech

Real-time reads of user behavior. We track shifting priorities, perceptions of today’s and next-gen services, and provider experience, then pace how fast tech moves from trial to adoption, blending buyer, consumer, and channel inputs with social signals (#WhySwitch, #UX).

Partner with our analyst team to build a custom report designed around your business priorities. From analysing market trends to assessing competitors or crafting bespoke datasets, we tailor insights to your needs.
Supplier Intelligence
Discovery & Profiling
Capacity & Footprint
Performance & Risk
Compliance & Governance
Commercial Readiness
Who Supplies Whom
Scorecards & Shortlists
Playbooks & Docs
Category Intelligence
Definition & Scope
Demand & Use Cases
Cost Drivers
Market Structure
Supply Chain Map
Trade & Policy
Operating Norms
Deliverables
Buyer Intelligence
Account Basics
Spend & Scope
Procurement Model
Vendor Requirements
Terms & Policies
Entry Strategy
Pain Points & Triggers
Outputs
Pricing Analysis
Benchmarks
Trends
Should-Cost
Indexation
Landed Cost
Commercial Terms
Deliverables
Brand Analysis
Positioning & Value Prop
Share & Presence
Customer Evidence
Go-to-Market
Digital & Reputation
Compliance & Trust
KPIs & Gaps
Outputs
Full Research Suite comprises of:
Market outlook & trends analysis
Interviews & case studies
Strategic recommendations
Vendor profiles & capabilities analysis
5-year forecasts
8 regions and 60+ country-level data splits
Market segment data splits
12 months of continuous data updates
DELIVERED AS:
PDF EXCEL ONLINE
Q-Commerce Last-Mile Thermal Packs & Reverse Logistics Market Analysis - Size, Share, and Forecast Outlook 2025 to 2035
Reverse Tuck Box Market Size and Share Forecast Outlook 2025 to 2035
Reverse Osmosis Pump Market Size and Share Forecast Outlook 2025 to 2035
Reverse Cap Bottles Market Size and Share Forecast Outlook 2025 to 2035
Reverse Transcriptase Enzymes Market Size and Share Forecast Outlook 2025 to 2035
Market Share Insights for Reverse Osmosis (RO) Pump Providers
Reverse Tuck Cartons Market
3D Reverse Engineering Software Market Forecast and Outlook 2025 to 2035
Logistics Packaging Market Size and Share Forecast Outlook 2025 to 2035
Logistics Robots Market Size and Share Forecast Outlook 2025 to 2035
Logistics Visibility Software Market Size and Share Forecast Outlook 2025 to 2035
Key Players & Market Share in the Logistics Packaging Industry
Logistics Outsourcing Market Analysis - Growth & Forecast 2025 to 2035
Logistics Visualization System Market
Logistics Automation Market
Cash Logistics Market Size and Share Forecast Outlook 2025 to 2035
Rail Logistics Market Size and Share Forecast Outlook 2025 to 2035
Intralogistics Automation Solutions Market Size and Share Forecast Outlook 2025 to 2035
Drone Logistics & Transportation Market Size and Share Forecast Outlook 2025 to 2035
Smart Logistics Services Market Size and Share Forecast Outlook 2025 to 2035

Thank you!
You will receive an email from our Business Development Manager. Please be sure to check your SPAM/JUNK folder too.
Chat With
MaRIA