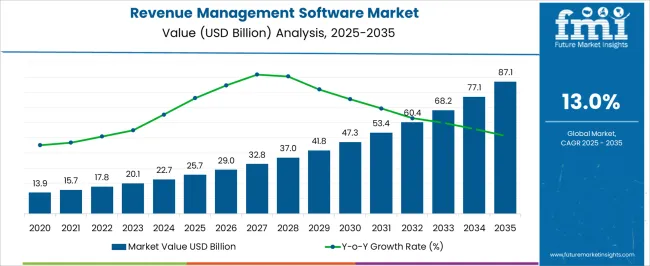
The Revenue Management Software Market is estimated to be valued at USD 25.7 billion in 2025 and is projected to reach USD 87.1 billion by 2035, registering a compound annual growth rate (CAGR) of 13.0% over the forecast period.
| Metric | Value |
|---|---|
| Revenue Management Software Market Estimated Value in (2025 E) | USD 25.7 billion |
| Revenue Management Software Market Forecast Value in (2035 F) | USD 87.1 billion |
| Forecast CAGR (2025 to 2035) | 13.0% |
The revenue management software market is expanding steadily as enterprises increasingly prioritize real time insights, dynamic pricing, and customer centric revenue optimization. The adoption of advanced analytics, artificial intelligence, and machine learning has strengthened the ability of organizations to forecast demand, adjust pricing models, and improve profit margins.
Businesses across diverse sectors are implementing these solutions to align revenue strategies with changing consumer behavior and market volatility. The push toward digital transformation, along with the growing complexity of multi channel operations, has heightened the need for automated and integrated revenue management platforms.
Furthermore, the shift to subscription and consumption based models has underscored the value of accurate revenue recognition and compliance management. The market outlook remains favorable as organizations continue to focus on financial efficiency, predictive capabilities, and scalable deployment options to enhance competitiveness.
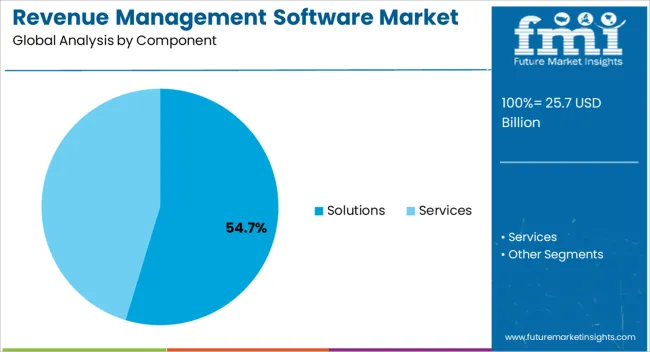
The solutions segment is expected to represent 54.70% of total market revenue by 2025, making it the leading component. This dominance is attributed to the comprehensive functionality of revenue management platforms, including real time analytics, dynamic pricing, and reporting tools that enable businesses to maximize profitability.
Solutions have been widely adopted as they provide seamless integration with enterprise resource planning and customer relationship management systems.
The capacity to automate complex processes and deliver actionable insights has enhanced operational efficiency, positioning solutions as the foundation of revenue management strategies across industries.
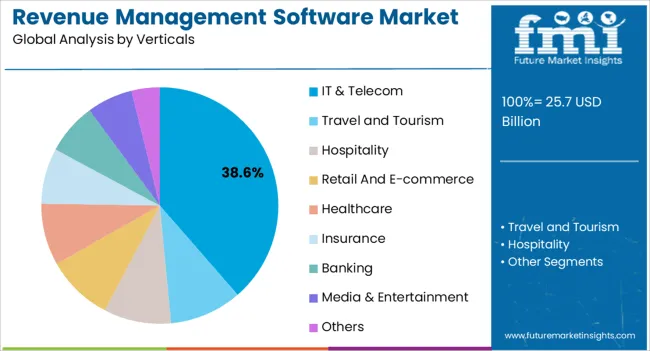
The IT and telecom segment is projected to hold 38.60% of total market revenue by 2025 within the verticals category, establishing it as the leading sector. This is driven by the rising need to manage complex billing structures, subscription models, and data driven service offerings.
As telecom operators and IT providers expand their portfolios with cloud services, IoT, and digital solutions, revenue management tools have become indispensable for ensuring accurate billing and optimized pricing.
The importance of managing large customer bases and diverse product lines has reinforced demand for revenue management software in this sector, solidifying its leadership.
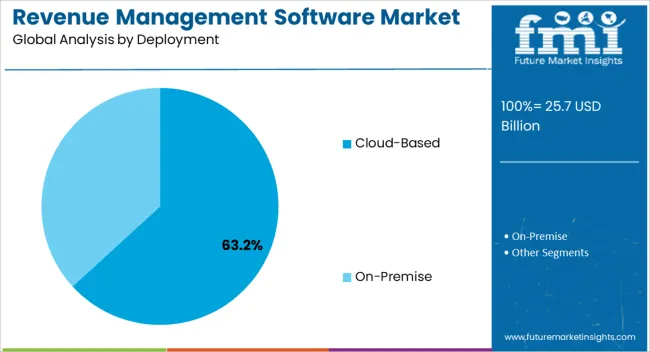
The cloud based deployment segment is projected to command 63.20% of total market revenue by 2025, making it the dominant deployment model. Its leadership is supported by scalability, cost effectiveness, and ease of integration with existing enterprise systems.
Organizations are increasingly preferring cloud based platforms for their ability to support remote operations, deliver regular updates, and enable real time data access. Additionally, the reduced need for infrastructure investment and enhanced security protocols have further promoted adoption.
As businesses prioritize agility and flexibility in revenue optimization, cloud based deployment continues to be the preferred choice across enterprises of all sizes.
According to FMI, the revenue management software industry is predicted to expand from a historical 9.6% CAGR to 13.5% CAGR during the forecast period.
Many systems are inextricably linked to revenue management and contribute to its success in the BFSI and telecommunications industries, such as channel managers, rate shoppers, and market share providers.
Short-term Growth (2025 to 2029): The distinct revenue management software features can truly make a difference. A next-generation revenue management system is based on artificial intelligence and machine learning and is constructed on self-learning algorithms that enhance accuracy over time. Due to this, the market size expects a valuation of USD 41.8 billion by 2029.
Medium-term Growth (2035 to 2035): Several airlines and hotels have corporate contracts to fill seats and rooms at a discounted rate to ensure maximum occupancy.
An airline that primarily relies on these business agreements may lose money, as many of them have lower price points in order to assure that all products are sold.
Airlines now use revenue management systems, which calculate a customer-acceptable price point using formulae and algorithms.
As a result, the airline's organizational measures may not be as necessary, which provide new prospects for market growth.
Long-term Growth (2035 to 2035): Every good revenue management system in the market includes specific revenue management software features, which are likely to expand the company’s profits.
For example, in today's hotel environment, any Revenue Manager must have a cloud-based solution as well as mobile-friendly functionality.
By 2035, the market is expected to increase and reach a value of USD 55.33 billion due to the implementation of this software.
Increased customer awareness and growing demand for system integration are driving the global revenue management software sector. Furthermore, increased distribution of ancillaries through e-travel platforms propels market growth.
The implementation of revenue management software is booming, as it helps businesses predict market trends. By implementing the new technologies, market leaders are extending their consumer base.
PROS, for example, is a market leader in revenue management technology. In addition to highlighting important revenue drivers, it uses more than 30 years of data science, predictive analysis, and machine learning to create a strong management system.
This is done to foresee market trends and forecast more precisely, without the need for new data. PROS' revenue management solutions can incorporate additional factors like brand loyalty and scheduling habits to create consistently profitable revenue models through scientific methods.
Risk Management solution is forecast to have a leading CAGR of over 12.2% by 2035. Risk management strategies can aid in the reduction or elimination of risks, while also trying to capitalize on the opportunity afforded by complex Black Swan incidents.
This goal can be achieved through the use of project risk, risk process initiation, risk assessment, risk evaluation, activity recognition, retrieval, communication, and learning.
Revenue management is shifting its focus from core product output to overall contribution from all sales opportunities, which is increasingly resulting in profit optimization. Revenue management has progressed from a yield enhancement function to a more strategic function encompassing finance, advertising, and operational processes.
The primary drivers of this evolution have been the internet's emergence and the purchasing power it has transmitted to the consumer. During both boom-and-bust economic cycles, effective strategic revenue management has become critical to the success and longevity of hospitality sector organizations.
Revenue management has been shown by low-cost carriers to significantly increase load factors and earnings. A highly competitive model of aggressive cost management combined with yield management and customer relationship management has emerged as a result of positive customer feedback.
Cloud deployment of revenue management software is forecast to grow at the leading CAGR of over 12% by 2035. The adoption of cloud computing is accelerating in nearly every business function. In the end, the deployment of cloud systems outperforms that of on-premise systems.
At its most basic, the cloud improves efficiency. In addition to increased efficiency, switching to cloud-based revenue management software is likely to provide customers with additional benefits.
According to a survey conducted by Flexera, about half of the decision-makers intend to increase their cloud usage and spending. The adoption of public clouds is likely to accelerate in the future, with 36% of businesses spending more than USD 12 million per year on public clouds and 90% expecting cloud utilization to outweigh previous forecasts.
| Regions | Key Players’ Developments |
|---|---|
| North America |
|
| Europe | The multi-tenanted BSS platform from Cerillion went operational for LINK Mobility in numerous European nations in November 2025. LINK standardized its billing procedures in Europe with the aid of Cerillion. |
| Asia Pacific | Reliance Jio, an Indian provider of telecom services, declared in August 2025 that it had won an auction held by the Indian government's Ministry of Communications to purchase spectrum in the 1800 MHz, 800 MHz, 3300MHz, 26GHz, and 700 MHz bands. They can start rolling out their 5G network services thanks to this acquisition. |
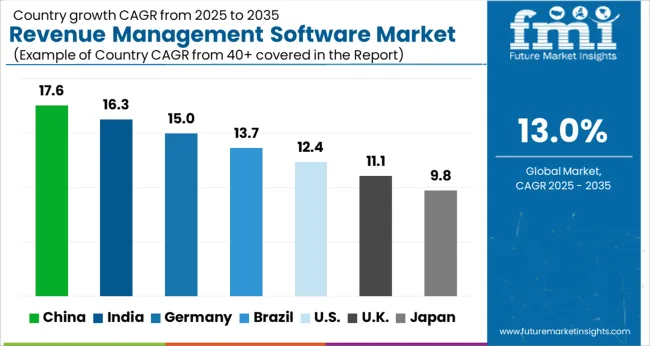
The United States is expected to account for the leading market share of USD 87.1 billion by 2035. Technological advancements and an increase in the number of software development activities are the key drivers of growth in the region.
For instance, in June 2025, Swire Hotels selected the IDeaS G3 revenue management system to unify its group revenue management approach across its seven hotels.
Previously, Swire Hotels approached revenue management on an individual property basis, resulting in the use of various vendors and systems across its portfolio. Swire Hotels sought to standardize its revenue management process in order to improve group efficiency.
G3 RMS intends to increase revenue by offering a unified version of data and analysis at the group level. Swire Hotels benefit from IDeaS's strategic revenue management support at the property and group levels as their portfolio grows.
IDeaS G3 RMS calculates the cost of acquiring clients through a specific channel or OTA. This information helps restaurant owners determine the long-term value of a channel, in contrast to the costs of obtaining reservations via that channel.
The demand for effective revenue management solutions to improve pricing strategies and increase profitability is one of the many factors driving the growth of the revenue management software sector in the United Kingdom. Furthermore, by enabling more precise and real-time revenue forecasting and pricing optimization, the development of sophisticated analytics and artificial intelligence (AI) technologies is further boosting the market growth in the United Kingdom.
By enabling more precise and real-time revenue forecasting and pricing optimization, the growth of e-commerce platforms and online shopping trends are helping to fuel the sector's strong CAGR of 18.6% by 2035 in China.
The market expansion in the area is also being fueled by the growing use of revenue management software across a number of sectors, including hospitality, transportation, and retail.
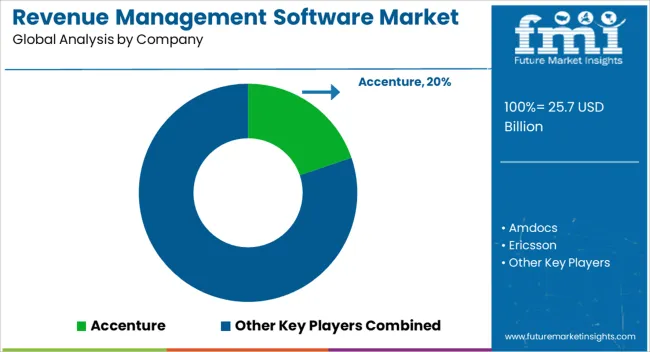
To remain competitive in the ecosystem of the revenue management software market, players that operate in it frequently use inorganic development techniques.
Recent Development:
The global revenue management software market is estimated to be valued at USD 25.7 billion in 2025.
The market size for the revenue management software market is projected to reach USD 87.1 billion by 2035.
The revenue management software market is expected to grow at a 13.0% CAGR between 2025 and 2035.
The key product types in revenue management software market are solutions, _risk management, _]price & revenue forecast management, _revenue analytics, _revenue leakage detection, _channel revenue management, services, _managed services and _professional services.
In terms of verticals, it & telecom segment to command 38.6% share in the revenue management software market in 2025.


Our Research Products

The "Full Research Suite" delivers actionable market intel, deep dives on markets or technologies, so clients act faster, cut risk, and unlock growth.

The Leaderboard benchmarks and ranks top vendors, classifying them as Established Leaders, Leading Challengers, or Disruptors & Challengers.

Locates where complements amplify value and substitutes erode it, forecasting net impact by horizon

We deliver granular, decision-grade intel: market sizing, 5-year forecasts, pricing, adoption, usage, revenue, and operational KPIs—plus competitor tracking, regulation, and value chains—across 60 countries broadly.

Spot the shifts before they hit your P&L. We track inflection points, adoption curves, pricing moves, and ecosystem plays to show where demand is heading, why it is changing, and what to do next across high-growth markets and disruptive tech

Real-time reads of user behavior. We track shifting priorities, perceptions of today’s and next-gen services, and provider experience, then pace how fast tech moves from trial to adoption, blending buyer, consumer, and channel inputs with social signals (#WhySwitch, #UX).

Partner with our analyst team to build a custom report designed around your business priorities. From analysing market trends to assessing competitors or crafting bespoke datasets, we tailor insights to your needs.
Supplier Intelligence
Discovery & Profiling
Capacity & Footprint
Performance & Risk
Compliance & Governance
Commercial Readiness
Who Supplies Whom
Scorecards & Shortlists
Playbooks & Docs
Category Intelligence
Definition & Scope
Demand & Use Cases
Cost Drivers
Market Structure
Supply Chain Map
Trade & Policy
Operating Norms
Deliverables
Buyer Intelligence
Account Basics
Spend & Scope
Procurement Model
Vendor Requirements
Terms & Policies
Entry Strategy
Pain Points & Triggers
Outputs
Pricing Analysis
Benchmarks
Trends
Should-Cost
Indexation
Landed Cost
Commercial Terms
Deliverables
Brand Analysis
Positioning & Value Prop
Share & Presence
Customer Evidence
Go-to-Market
Digital & Reputation
Compliance & Trust
KPIs & Gaps
Outputs
Full Research Suite comprises of:
Market outlook & trends analysis
Interviews & case studies
Strategic recommendations
Vendor profiles & capabilities analysis
5-year forecasts
8 regions and 60+ country-level data splits
Market segment data splits
12 months of continuous data updates
DELIVERED AS:
PDF EXCEL ONLINE
Healthcare Revenue Cycle Management Software Market – Forecast 2017-2022
Revenue Assurance Market Size and Share Forecast Outlook 2025 to 2035
Revenue Management Solutions Market Size and Share Forecast Outlook 2025 to 2035
Customer Revenue Optimization (CRO) Software Market Size and Share Forecast Outlook 2025 to 2035
Billing and Revenue Management Market Size and Share Forecast Outlook 2025 to 2035
Telecom Billing And Revenue Management Market Size and Share Forecast Outlook 2025 to 2035
Veterinary Hospitals Revenue Analysis Growth – Trends & Forecast 2024-2034
Tax Management Market Size and Share Forecast Outlook 2025 to 2035
Key Management as a Service Market
Cash Management Supplies Packaging Market Size and Share Forecast Outlook 2025 to 2035
Risk Management Market Size and Share Forecast Outlook 2025 to 2035
Lead Management Market Size and Share Forecast Outlook 2025 to 2035
Pain Management Devices Market Growth - Trends & Forecast 2025 to 2035
Data Management Platforms Market Analysis and Forecast 2025 to 2035, By Type, End User, and Region
Cash Management Services Market – Trends & Forecast 2025 to 2035
CAPA Management (Corrective Action / Preventive Action) Market
Fuel Management Software Market Size and Share Forecast Outlook 2025 to 2035
Case Management Software (CMS) Market Size and Share Forecast Outlook 2025 to 2035
Farm Management Software Market Size and Share Forecast Outlook 2025 to 2035
Exam Management Software Market

Thank you!
You will receive an email from our Business Development Manager. Please be sure to check your SPAM/JUNK folder too.
Chat With
MaRIA