The Revenue Assurance Market is estimated to be valued at USD 0.8 billion in 2025 and is projected to reach USD 1.7 billion by 2035, registering a compound annual growth rate (CAGR) of 8.1% over the forecast period.
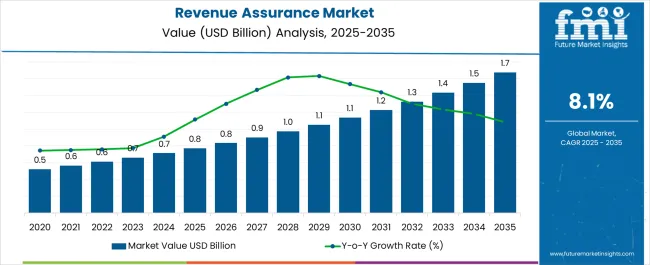
| Metric | Value |
|---|---|
| Revenue Assurance Market Estimated Value in (2025 E) | USD 0.8 billion |
| Revenue Assurance Market Forecast Value in (2035 F) | USD 1.7 billion |
| Forecast CAGR (2025 to 2035) | 8.1% |
The revenue assurance market is expanding steadily, driven by the increasing complexity of telecom and digital service operations and the rising importance of securing revenue streams in highly competitive environments. Telecom service providers and digital businesses have reported higher incidences of revenue leakage due to diverse service portfolios, digital transactions, and evolving billing models. Industry reports, investor presentations, and technology announcements have emphasized significant investments in automated assurance platforms that integrate analytics, artificial intelligence, and machine learning to improve error detection and recovery efficiency.
The shift towards 5G, IoT, and cloud-based service models has intensified the demand for scalable assurance systems capable of managing high-volume data in real time. Additionally, regulatory compliance requirements for accurate billing and transparent reporting have reinforced adoption among global service providers.
Future growth is expected to be influenced by the continued migration to cloud-based platforms, cross-industry application of revenue assurance beyond telecom, and the integration of advanced fraud management and predictive analytics tools into assurance frameworks.
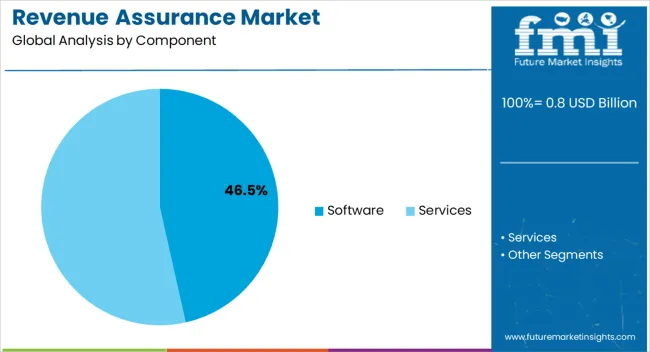
The Software segment is projected to account for 46.50% of the revenue assurance market revenue in 2025, underscoring its critical role in automating complex assurance processes. This segment’s dominance has been driven by the ability of software platforms to integrate with existing business support systems and operational support systems, ensuring real-time monitoring of transactions and billing accuracy.
Telecom operators and enterprises have prioritized scalable and flexible software solutions to minimize manual interventions, reduce operational costs, and improve error detection speed. Continuous enhancements in machine learning algorithms and predictive analytics have enabled software solutions to address increasingly complex revenue leakage scenarios.
Furthermore, the adoption of modular, customizable platforms has allowed enterprises to adapt solutions to specific business models, further strengthening software’s position as the preferred assurance component.
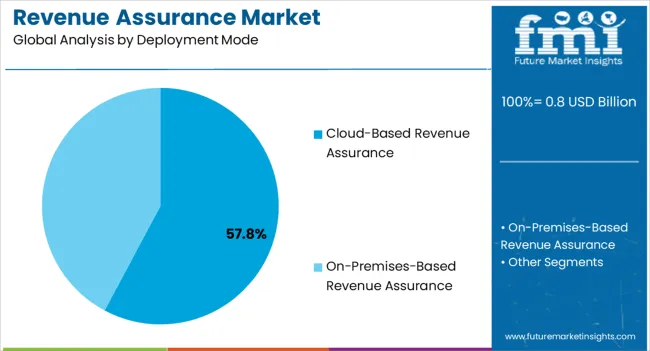
The Cloud-Based Revenue Assurance segment is projected to contribute 57.80% of the market revenue in 2025, maintaining its position as the leading deployment mode. Growth in this segment has been supported by the scalability, cost efficiency, and flexibility offered by cloud platforms, which are particularly critical for handling the dynamic data volumes associated with telecom and digital services.
Cloud-based models have enabled service providers to reduce infrastructure costs and accelerate deployment timelines, while ensuring continuous updates and system enhancements. Investor briefings and product launch announcements have emphasized the role of cloud assurance solutions in supporting global operations with improved accessibility and integration across geographies.
Additionally, the demand for real-time analytics and fraud prevention has reinforced cloud adoption, as these systems offer faster processing and better adaptability to evolving business requirements. The cloud-based model is expected to remain the dominant choice as enterprises accelerate digital transformation initiatives.
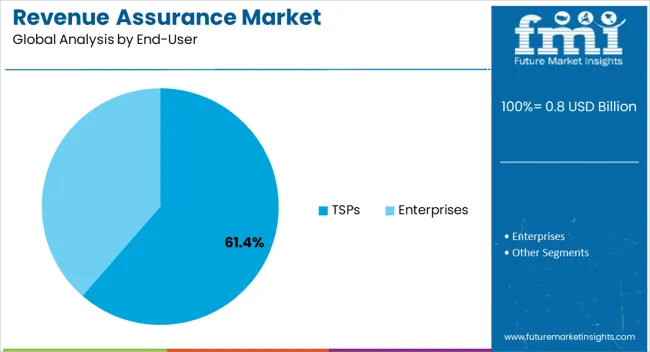
The TSPs (Telecom Service Providers) segment is projected to hold 61.40% of the revenue assurance market revenue in 2025, reflecting its position as the largest end-user group. This dominance has been attributed to the extensive transaction volumes and billing complexities within telecom networks, where even minor inaccuracies can result in substantial revenue leakage.
Telecom service providers have increasingly adopted advanced revenue assurance systems to safeguard against fraud, manage subscriber growth, and maintain compliance with regulatory standards. Industry journals and annual reports have highlighted that TSPs face growing challenges from the expansion of 5G networks, mobile payments, and bundled service offerings, all of which increase the risk of revenue leakage.
The ability of revenue assurance platforms to provide real-time monitoring, automated reconciliation, and cross-service validation has been instrumental in meeting these challenges. As telecom operators continue to expand digital ecosystems and introduce new monetization models, the TSPs segment is expected to sustain its leadership in driving demand for advanced revenue assurance solutions.
According to research by Future Market Insights, the revenue assurance market experienced an approximate 8% CAGR increase in its market value from 2020 to 2025.
During the forecast period, demand for revenue assurance software and services is expected to increase as consumers become aware of the serious consequences of revenue leaks. Further, the market for revenue assurance is expanding, with the aim of maintaining that everything that should be paid and billed on time across all revenue and expense streams. Also, the demand growth should pick up in the coming months.
Technological developments are highly probable to provide possibilities for the market during the forecast period. Cloud, 4G, and 5G, Internet - of - things, and Software-defined networking and network functions virtualization technologies enable operators to launch new business models and services. However, they also allow for the emergence of new instances of fraud.
Traditional systems are incapable of dealing with the complexities of today's mobile environment, resulting in revenue loss and profit erosion. In the coming years, market growth is projected to be boosted by the introduction of innovative techniques and processes such as real-time revenue assurance.
Technologically advanced revenue assurance systems help businesses improve and automate traditional revenue assurance detection and monitoring processes while the primary goal of any revenue assurance services is to detect and prevent revenue leakage. These systems also detect and prevent fraud and data inconsistencies.
Product and service-based businesses face a variety of challenges and issues, ranging from expanding their client base in saturated markets to managing a significantly growing base in developing markets. Multiple vendor markets are also highly competitive, necessitating ongoing innovation and technological development to maintain a competitive advantage.
All of these scenarios increase a company's vulnerability to revenue loss and necessarily entail the inclusion of effective revenue assurance methods in their overall revenue management strategy.
Recently, the Nigerian Communications Commission signed a Public-Private Partnership agreement with its consultant, 3R Company Nigeria Limited, to implement Revenue Assurance Solutions in the Nigerian telecommunications industry to strengthen and manage revenue generation.
Implementing Revenue Assurance Solutions might improve the monitoring and regulatory activities related to AOL administration in the telecommunications industry, as well as the integrity and fidelity of the industry's AOL figures.
North America Region is Projected to Offer the Key Opportunity for Revenue Assurance Market
North America is the leading region with the high projected growth due to the presence of key internet and communication service providers. North America is a pioneer in terms of significant investment in and adoption of cutting-edge technologies.
According to the GSM Association�.79;s Mobile Economy 2024 report, by the end of 2025, around 48% of telecom subscribers are poised to use 5G technology.
According to the report, the region�.79;s IoT connections totaled 0.7 billion in 2024 and is expected to reach 0.8 billion by 2025. The region�.79;s financial stability opens up numerous opportunities for new investments and increased adoption of cutting-edge IoT devices. With these, the demand for revenue assurance is also expected to surge at a notable pace in the region. North America is projected to hold a 51% share of the global revenue assurance market.
The United States is expected to account for the high market share of USD 1.7 million by the end of 2035. Technological advancements and an increase in the number of revenue-generating activities across organizations are the key drivers of growth.
In May 2025, MYCOM OSI, the United Kingdom-based provider of cloud network and service assurance solutions to global telecommunications service providers, agreed to be acquired by Amdocs. Amdocs' internet backbone portfolio is anticipated to be expanded to include end-to-end revenue assurance systems and service and network orchestration by bringing key assurance capabilities to power the next generation of networks.
MYCOM OSI's service assurance suite includes performance monitoring, error checking, and quality of service management tools that use artificial intelligence and machine learning to detect and predict discrepancies and enable intent-driven closed-loop operations via automated remediation and AIOps. The United States is predicted to expand at a CAGR of 8.6% over the coming decades.
The software segment is forecasted to expand at a high CAGR of over 7.6% from 2025 to 2035. The software segment is dominant as it is widely used across industries.
Some of the software features that can help segment growth include revenue risk identification, revenue growth, overall monitoring, and accurate reporting.
The service segment also includes planning and consulting, execution and personalization, maintenance, and support, and managed services. Also, the successful implementation of revenue leakage security software and services has resulted in large revenue assurance market growth.
Revenue assurance teams understand that if billing processes do not reflect contract pricing structures, margins suffer immediately. Artificial intelligence technology identifies revenue leakage sources and eliminates the causes of actual revenue loss.
Human-led data reconciliation operations make timely verification and investigation of revenue leakage difficult with thousands of contracts to check, vast amounts of data involved, data quality issues, and manual processes. Control of demand fluctuations is not easy. However, with the usage of appropriate revenue assurance software, data processes can be improved which can reduce revenue leakage.
The demand for cloud-based revenue assurance solutions is forecasted to thrive at a notable CAGR of over 7.7% from 2025 to 2035. The on-premise segment accounts for a significant revenue assurance market share due to great security, total control over the hardware, and great customization.
A flexible deployment model is required for the widespread adoption of revenue assurance technologies such as 5G, Internet of Things, AI, AI Learning, and augmented and virtual reality, among others. Also, the demand for technically sophisticated software and techniques is growing across all industries as a result of increased digitalization.
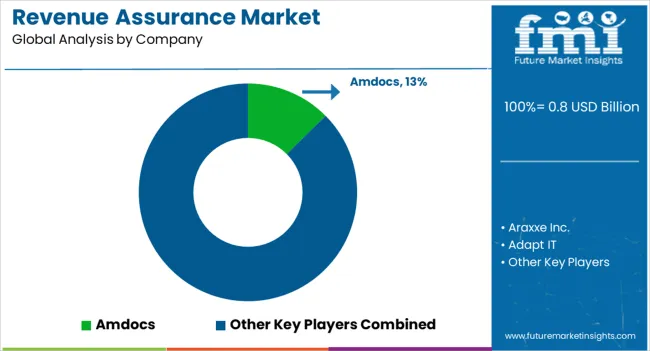
The leading revenue assurance vendors in the global revenue assurance industry are Amdocs, Araxxe Inc., Adapt IT, Cartesian, and Digital Route. To gain a competitive advantage in the industry, these market players are investing in product launches, partnerships, mergers and acquisitions, and expansions.
Several new companies are expected to enter the market due to the growing demand for the product around the world. This is expected to increase competition on a worldwide scale.
Market growth is expected to be fueled by collaborations among current players to improve quality throughout the research period. Over the projection period, established market players are expected to diversify their portfolios and offer one-stop solutions to combat fierce competition.
Some of the recent activities related to mergers and acquisitions and software developments are as follows:
| Report Attributes | Details |
|---|---|
| Global Revenue Assurance Market CAGR (2025 to 2035) | 8.1% |
| Base Year for Estimation | 2025 |
| Historical Data | 2020 to 2025 |
| Forecast Period | 2025 to 2035 |
| Global Revenue Assurance Market Size (2025) | USD 654.5 million |
| Global Revenue Assurance Market Size (2035) | USD 1479.9 million |
| Quantitative Units | Revenue in USD million and CAGR from 2025 to 2035 |
| Report Coverage | Revenue Forecast, Volume Forecast, Company Ranking, Competitive Landscape, Growth Factors, Trends, and Pricing Analysis |
| Segments Covered | Solution, Application, Region |
| Regions Covered | North America; Latin America; Western Europe; Eastern Europe; South Asia & Pacific; East Asia; The Middle East & Africa (MEA) |
| Key Countries Profiled | The United States, Canada, Brazil, Mexico, Germany, The United Kingdom, France, Spain, Italy, Poland, Russia, Czech Republic, Romania, India, Bangladesh, Australia, New Zealand, China, Japan, South Korea, GCC Countries, South Africa, Israel |
| Key Companies Covered | Amdocs; Araxxe Inc.; Adapt IT; Cartesian; Digital Route; eClerx; HPE; Itron; Nokia; Profit Insight; Sagacity Solutions; Sandvine; Sigos; Subex |
| Customization | Available Upon Request |
The global revenue assurance market is estimated to be valued at USD 0.8 billion in 2025.
The market size for the revenue assurance market is projected to reach USD 1.7 billion by 2035.
The revenue assurance market is expected to grow at a 8.1% CAGR between 2025 and 2035.
The key product types in revenue assurance market are software, services, _revenue assurance planning and consulting services, _revenue assurance implementation and customization services, _revenue assurance support and maintenance services and _revenue assurance managed services.
In terms of deployment mode, cloud-based revenue assurance segment to command 57.8% share in the revenue assurance market in 2025.


Full Research Suite comprises of:
Market outlook & trends analysis
Interviews & case studies
Strategic recommendations
Vendor profiles & capabilities analysis
5-year forecasts
8 regions and 60+ country-level data splits
Market segment data splits
12 months of continuous data updates
DELIVERED AS:
PDF EXCEL ONLINE
Revenue Management Software Market Size and Share Forecast Outlook 2025 to 2035
Revenue Management Solutions Market Size and Share Forecast Outlook 2025 to 2035
Customer Revenue Optimization (CRO) Software Market Size and Share Forecast Outlook 2025 to 2035
Healthcare Revenue Cycle Management Software Market – Forecast 2017-2022
Billing and Revenue Management Market Size and Share Forecast Outlook 2025 to 2035
Telecom Billing And Revenue Management Market Size and Share Forecast Outlook 2025 to 2035
Veterinary Hospitals Revenue Analysis Growth – Trends & Forecast 2024-2034
Cloud Service Assurance Market Size and Share Forecast Outlook 2025 to 2035
Telecom Service Assurance Market Trends – Size, Demand & Forecast 2023-2033
Predictive Quality Assurance Equipment Market Size and Share Forecast Outlook 2025 to 2035

Thank you!
You will receive an email from our Business Development Manager. Please be sure to check your SPAM/JUNK folder too.
Chat With
MaRIA