The global retractable needle safety syringes market is likely to reach a valuation of US$ 5,846.6 million in 2023 and is projected to expand at a steady CAGR of 4.1% between 2023 and 2033, totaling around US$ 8,770 million by 2033. The rising prevalence of various diseases across the world is a key factor driving demand for retractable needle safety syringes.
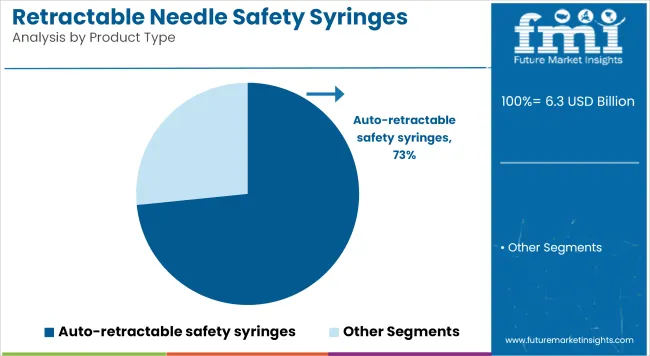
Manual retractable safety syringe is expected to continue to lead the global retractable needle safety syringes market based on product, accounting for around 62.13% share in 2022.
In 2022, the market value for retractable needle safety syringes market held more than 2.6% of the overall global medical supplies market which stood at around US$ 215.0 billion.
The demand for retractable needle safety syringes is increasing constantly due to the rising incidence of needle stick injuries. All parenteral pharmaceutical products have to be injected using drug delivery devices. Also, syringes are the most commonly used devices. Injecting through needle-based devices presents a considerable risk of needle stick injury. For instance,
The Centers for Disease Control and Prevention reports that over 385,000 needle stick injuries affect healthcare professionals each year in the United States. In particular, blood-borne viruses are spreading through these needle stick injuries. Hepatitis B and hepatitis C are of concern, as well as the human immunodeficiency virus (HIV), which causes AIDS (acquired immune deficiency syndrome).
The rising number of needle stick injuries has resulted in a shift toward regulatory authorities recommending the use of protected needles and retractable needle safety syringes, which is helping to boost the global retractable needle safety syringes industry.
Companies operating in the retractable needle safety syringes industry are actively seeking to strengthen their position through product launches, approvals, collaborations, and partnerships with established as well as emerging market players. For instance,
Attributes | Statistics |
---|---|
Retractable Needle Safety Syringes Market Base Value (2023) | US$ 5,846.6 million |
Projected Market Size (2033) | US$ 8,770 million |
Value-based CAGR (2023 to 2033) | 4.1% |
Market Share of Top 5 Countries | 53.9% |
Don't pay for what you don't need
Customize your report by selecting specific countries or regions and save 30%!
The global sales of retractable needle safety syringes are anticipated to rise at a CAGR of 4.1% between 2023 and 2033, owing to the increased adoption of advanced retractable needle safety syringes across healthcare facilities.
There has been an increasing adoption of manual retractable safety syringes, thereby making it the leading segment with the advantages of manual retractable safety syringes over other available syringes found in the market. Further, the demand for retractable needle safety syringes is rising due to a surge in diseases like diabetes, cancer, and hepatitis, growing health awareness among people, and innovations in retractable needle safety syringes.
Safety needles improve user convenience and practicability while lowering the risk of infection and cost. The majority of healthcare professionals prefer safety needle technology to conventional devices due to beneficial factors like accuracy, operation time, and fast usage design.
Retractable safety syringes increase the patient’s power in making healthcare decisions, which is eventually helping to boost the global market for retractable needle safety syringes.
In addition, many people use sterile needles and syringes for each injection for the administration of drugs.
Sterile needles prevent the spread of diseases like HIV and viral hepatitis among other infections. People who inject drugs have access to sterile needles and syringes through pharmacies and syringe services programs (SSPs) in several areas.
Access to syringes is also possible through a doctor’s prescription and through other healthcare services. SSPs are based on community programs that provide access to sterile syringes and needles at no cost and help in facilitating the safe disposal of used needles and syringes.
The increasing number of needle and syringe programs aimed at reducing the possibility of disease transmission is one of the primary factors contributing to the growth of the global retractable needle safety syringe industry.
Introduction of Stringent Regulations Pushing Demand for Retractable Needle Safety Syringes
The global sales of retractable needle safety syringes are expected to rise due to increasing government initiatives and regulations to maximize the use of safe syringes. Over the years, the rising incidence of needle stick injuries and the high mortality rate associated with these injuries have prompted governments and regulatory bodies to take various steps. To reduce needle stick injuries and prevent needle reusing, countries like Germany, the United States, and other ASEAN have passed legislation requiring the use of safe syringes.
Thanks to the introduction of this regulation, safety syringes such as retractable needle safety syringes are now used frequently compared to traditional syringes, which has resulted in a significant increase in demand in the market for retractable needle safety syringes.
Retractable needle safety syringes have an internal safety device and either a detachable or a fixed needle. Further, they help in avoiding accidental needle stick injuries among healthcare professionals and spreading blood-borne diseases.
The presence of alternative drug delivery solutions like needle-free injection technology is becoming a key factor restraining the growth of the retractable needle safety syringes industry.
The “needle-free injection technology" (NFIT) comprises a wide variety of drug delivery methods that administer medication through the skin using forces like Lorentz, shock waves, pressure from gases, or electrophoresis, all of which potentially reduce the need for retractable as well as hypodermic needles.
A Notable Rise in Needle Stick Injuries Pushing Demand for Retractable Needle Safety Syringes in the United States
Country | The United States |
---|---|
Market Share % (2022) | 27.2% |
The United States held a total share of 81.4% of North America’s retractable needle safety syringes market in 2022 and is poised to exhibit steady growth during the forecast period. Growth in the United States retractable needle safety syringes market is driven by rising cases of needle stick injuries, increasing adoption of advanced technologies, and the presence of a well-established healthcare industry. Also, in recent years, there has been a sharp rise in needle stick injuries across the United States. For instance,
Rising investments and government support in conducting research in various sectors are expected to attract huge attention to the retractable needle safety syringes market in the United States.
Increasing Prevalence of Chronic Diseases Propelling Retractable Needle Safety Syringes Sales in Germany
Country | Germany |
---|---|
Market Share % (2022) | 4.4% |
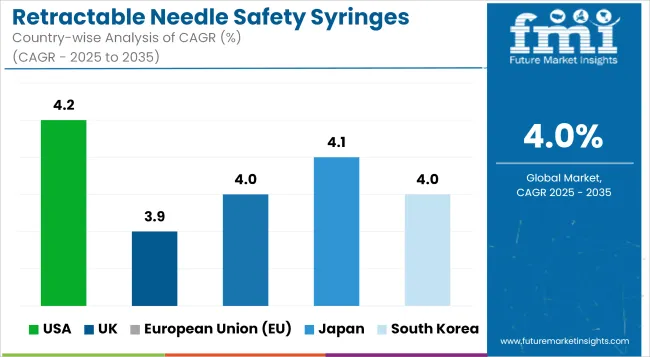
As per FMI, the retractable needle safety syringes industry in Germany is set to exhibit a CAGR of 4.1% during the forecast period. Demand for retractable needle safety syringes in Germany is driven by the increasing prevalence of chronic diseases.
According to the European Commission report of 2019, around 58 percent of Germans, 65 and older, suffered from at least one chronic illness in 2017, a percentage that is slightly higher than that of other European nations.
Retractable needle safety syringes are being preferred for administering medicines to treat various chronic diseases. This might continue to propel sales of retractable needle safety syringes in the country during the assessment period.
Increasing Healthcare Spending Favoring Market Growth in China
Country | China |
---|---|
Forecast CAGR % (2023 to 2033) | 4.3% |
China held around 41.1% value share in the East Asia retractable needle safety syringes market in 2022 and is projected to expand at a steady pace. Moreover, this growth is associated with rising healthcare expenditure, a notably growing geriatric population, and significantly improving medical infrastructure.
Get the data you need at a Fraction of the cost
Personalize your report by choosing insights you need
and save 40%!
Sales of Manual Retractable Safety Syringes to Outperform Automatic Ones
Segment | Manual Retractable Safety Syringe |
---|---|
Market Share % (2022) | 62.13% |
Manual retractable safety syringes currently hold a market share of around 62.13% in the global retractable needle safety syringes industry and this trend is likely to continue during the forecast period. This can be attributed to the rising usage of manual retractable safety syringes across healthcare facilities.
After administering the injection, the user of a manual retractable safety syringe can retract the needle either before or after extracting it from the patient.
Intravenous Segment is to Contribute most to the Global Retractable Needle Safety Syringes Market
Segment | Intravenous |
---|---|
Market Share % (2022) | 44.99% |
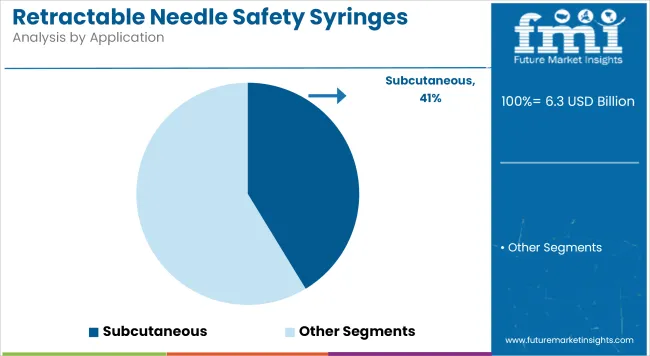
The intravenous segment held a revenue share of 44.99% of the global retractable needle safety syringes market in 2022 and it is poised to expand at a relatively higher CAGR during the forecast period.
The high market share is because, with intravenous (IV) injection, the medication penetrates the systemic circulation directly, avoiding the first-pass drug effect and producing an instantaneous drug effect.
The Majority of Retractable Needle Safety Syringe Sales Remain Concentrated in Hospitals
As per FMI, the hospitals segment leads the global retractable needle safety syringes market with around 38.7%. This is attributable to the rising number of patients seeking treatments in hospitals and the surge in hospital-acquired infections.
Today, majority of the hospitals use retractable needle safety syringes due to their safe and hygienic nature. Further, the adoption of these syringes helps hospitals to curb the transmission of diseases due to needle stick injuries.
End Users Prefer to Purchase Retractable Needle Safety Syringes through Direct to Customer Channel
The direct to customer distribution channel leads the retractable needle safety syringes market with around 89.3% market share. It is because the direct-to-consumer distribution channel involves selling goods directly to clients rather than through wholesalers, retailers, or other middlemen.
Key players in the retractable needle safety syringes market are continuously adopting various organic and inorganic strategies such as acquisitions, partnerships, mergers, new product launches, and geographical expansion to increase their revenue share and gain an upper hand in the market.
Given below are a few examples of the key strategies followed by the manufacturers:
New startups are entering the safety syringes business amid increasing opportunities in retractable needle safety syringes space. Also, they are embracing innovation to introduce novel products that could potentially eliminate the risk of needle stick injuries.
Attributes | Details |
---|---|
Base Market Value (2022) | US$ 5,846.6 million |
Projected Market Size (2033) | US$ 8,770.0 million |
Growth Rate (2023 to 2033) | 4.1% |
Forecast Period | 2018 to 2022 |
Historical Data Available for | 2023 to 2033 |
Market Analysis | US$ million for Value |
Key Regions Covered | North America, Latin America, Europe, South Asia, East Asia, Oceania, and Middle East & Africa |
Key Countries Covered | The United States, Canada, Brazil, Mexico, Argentina, Germany, The United Kingdom, France, Italy, Spain, BENELUX, Russia, Nordic Countries India, Indonesia, Malaysia, Philippines, Thailand, Vietnam, China, Japan, South Korea, Australia, New Zealand, GCC Countries, Turkey, Israel, North Africa, and South Africa |
Key Market Segments Covered | Product, Application, End User, Distribution Channel, and Region |
Key Companies Profiled |
|
Pricing | Available upon Request |
The global market size is to reach US$ 8,770 million by 2033.
Numedico, Lifelong Group, and DMC Medical Ltd. are key players in the market.
Key players are adopting various organic and inorganic strategies, such as acquisitions and partnerships.
The United States, Japan, and China dominate the global market.
Manual retractable safety syringes are the top-selling product in the market.
The United States held 81.4% of North America’s retractable needle safety syringes market 2022.
1. Executive Summary
1.1. Global Market Outlook
1.2. Demand-side Trends
1.3. Supply-side Trends
1.4. Technology Roadmap Analysis
1.5. Analysis and Recommendations
2. Market Overview
2.1. Market Coverage / Taxonomy
2.2. Market Definition / Scope / Limitations
3. Market Background
3.1. Market Dynamics
3.1.1. Drivers
3.1.2. Restraints
3.1.3. Opportunity
3.1.4. Trends
3.2. Scenario Forecast
3.2.1. Demand in Optimistic Scenario
3.2.2. Demand in Likely Scenario
3.2.3. Demand in Conservative Scenario
3.3. Opportunity Map Analysis
3.4. Product Life Cycle Analysis
3.5. Supply Chain Analysis
3.5.1. Supply Side Participants and their Roles
3.5.1.1. Producers
3.5.1.2. Mid-Level Participants (Traders/ Agents/ Brokers)
3.5.1.3. Wholesalers and Distributors
3.5.2. Value Added and Value Created at Node in the Supply Chain
3.5.3. List of Raw Material Suppliers
3.5.4. List of Existing and Potential Buyer’s
3.6. Investment Feasibility Matrix
3.7. Value Chain Analysis
3.7.1. Profit Margin Analysis
3.7.2. Wholesalers and Distributors
3.7.3. Retailers
3.8. PESTLE and Porter’s Analysis
3.9. Regulatory Landscape
3.9.1. By Key Regions
3.9.2. By Key Countries
3.10. Regional Parent Market Outlook
3.11. Production and Consumption Statistics
3.12. Import and Export Statistics
4. Global Market Analysis 2018 to 2022 and Forecast, 2023 to 2033
4.1. Historical Market Size Value (US$ Million) & Volume (Units) Analysis, 2018 to 2022
4.2. Current and Future Market Size Value (US$ Million) & Volume (Units) Projections, 2023 to 2033
4.2.1. Y-o-Y Growth Trend Analysis
4.2.2. Absolute $ Opportunity Analysis
5. Global Market Analysis 2018 to 2022 and Forecast 2023 to 2033, By Product
5.1. Introduction / Key Findings
5.2. Historical Market Size Value (US$ Million) & Volume (Units) Analysis By Product, 2018 to 2022
5.3. Current and Future Market Size Value (US$ Million) & Volume (Units) Analysis and Forecast By Product, 2023 to 2033
5.3.1. Manual Retractable Safety Syringe
5.3.2. Auto-retractable Safety Syringe
5.4. Y-o-Y Growth Trend Analysis By Product, 2018 to 2022
5.5. Absolute $ Opportunity Analysis By Product, 2023 to 2033
6. Global Market Analysis 2018 to 2022 and Forecast 2023 to 2033, By Application
6.1. Introduction / Key Findings
6.2. Historical Market Size Value (US$ Million) & Volume (Units) Analysis By Application, 2018 to 2022
6.3. Current and Future Market Size Value (US$ Million) & Volume (Units) Analysis and Forecast By Application, 2023 to 2033
6.3.1. Subcutaneous
6.3.2. Intramuscular
6.3.3. Intravenous
6.4. Y-o-Y Growth Trend Analysis By Application, 2018 to 2022
6.5. Absolute $ Opportunity Analysis By Application, 2023 to 2033
7. Global Market Analysis 2018 to 2022 and Forecast 2023 to 2033, By End-User
7.1. Introduction / Key Findings
7.2. Historical Market Size Value (US$ Million) & Volume (Units) Analysis By End-User, 2018 to 2022
7.3. Current and Future Market Size Value (US$ Million) & Volume (Units) Analysis and Forecast By End-User, 2023 to 2033
7.3.1. Hospitals
7.3.2. Clinics
7.3.3. Ambulatory Surgical Centres
7.3.4. Others
7.4. Y-o-Y Growth Trend Analysis By End-User, 2018 to 2022
7.5. Absolute $ Opportunity Analysis By End-User, 2023 to 2033
8. Global Market Analysis 2018 to 2022 and Forecast 2023 to 2033, By Distribution Channel
8.1. Introduction / Key Findings
8.2. Historical Market Size Value (US$ Million) & Volume (Units) Analysis By Distribution Channel, 2018 to 2022
8.3. Current and Future Market Size Value (US$ Million) & Volume (Units) Analysis and Forecast By Distribution Channel, 2023 to 2033
8.3.1. Direct to Customer
8.3.2. Retail
8.3.2.1. Retail Pharmacies
8.3.2.2. Drug Stores
8.3.3. Online Pharmacies
8.4. Y-o-Y Growth Trend Analysis By Distribution Channel, 2018 to 2022
8.5. Absolute $ Opportunity Analysis By Distribution Channel, 2023 to 2033
9. Global Market Analysis 2018 to 2022 and Forecast 2023 to 2033, By Region
9.1. Introduction
9.2. Historical Market Size Value (US$ Million) & Volume (Units) Analysis By Region, 2018 to 2022
9.3. Current Market Size Value (US$ Million) & Volume (Units) Analysis and Forecast By Region, 2023 to 2033
9.3.1. North America
9.3.2. Latin America
9.3.3. Western Europe
9.3.4. Eastern Europe
9.3.5. South Asia and Pacific
9.3.6. East Asia
9.3.7. Middle East and Africa
9.4. Market Attractiveness Analysis By Region
10. North America Market Analysis 2018 to 2022 and Forecast 2023 to 2033, By Country
10.1. Historical Market Size Value (US$ Million) & Volume (Units) Trend Analysis By Market Taxonomy, 2018 to 2022
10.2. Market Size Value (US$ Million) & Volume (Units) Forecast By Market Taxonomy, 2023 to 2033
10.2.1. By Country
10.2.1.1. USA
10.2.1.2. Canada
10.2.2. By Product
10.2.3. By Application
10.2.4. By End-User
10.2.5. By Distribution Channel
10.3. Market Attractiveness Analysis
10.3.1. By Country
10.3.2. By Product
10.3.3. By Application
10.3.4. By End-User
10.3.5. By Distribution Channel
10.4. Key Takeaways
11. Latin America Market Analysis 2018 to 2022 and Forecast 2023 to 2033, By Country
11.1. Historical Market Size Value (US$ Million) & Volume (Units) Trend Analysis By Market Taxonomy, 2018 to 2022
11.2. Market Size Value (US$ Million) & Volume (Units) Forecast By Market Taxonomy, 2023 to 2033
11.2.1. By Country
11.2.1.1. Brazil
11.2.1.2. Mexico
11.2.1.3. Rest of Latin America
11.2.2. By Product
11.2.3. By Application
11.2.4. By End-User
11.2.5. By Distribution Channel
11.3. Market Attractiveness Analysis
11.3.1. By Country
11.3.2. By Product
11.3.3. By Application
11.3.4. By End-User
11.3.5. By Distribution Channel
11.4. Key Takeaways
12. Western Europe Market Analysis 2018 to 2022 and Forecast 2023 to 2033, By Country
12.1. Historical Market Size Value (US$ Million) & Volume (Units) Trend Analysis By Market Taxonomy, 2018 to 2022
12.2. Market Size Value (US$ Million) & Volume (Units) Forecast By Market Taxonomy, 2023 to 2033
12.2.1. By Country
12.2.1.1. Germany
12.2.1.2. UK
12.2.1.3. France
12.2.1.4. Spain
12.2.1.5. Italy
12.2.1.6. Rest of Western Europe
12.2.2. By Product
12.2.3. By Application
12.2.4. By End-User
12.2.5. By Distribution Channel
12.3. Market Attractiveness Analysis
12.3.1. By Country
12.3.2. By Product
12.3.3. By Application
12.3.4. By End-User
12.3.5. By Distribution Channel
12.4. Key Takeaways
13. Eastern Europe Market Analysis 2018 to 2022 and Forecast 2023 to 2033, By Country
13.1. Historical Market Size Value (US$ Million) & Volume (Units) Trend Analysis By Market Taxonomy, 2018 to 2022
13.2. Market Size Value (US$ Million) & Volume (Units) Forecast By Market Taxonomy, 2023 to 2033
13.2.1. By Country
13.2.1.1. Poland
13.2.1.2. Russia
13.2.1.3. Czech Republic
13.2.1.4. Romania
13.2.1.5. Rest of Eastern Europe
13.2.2. By Product
13.2.3. By Application
13.2.4. By End-User
13.2.5. By Distribution Channel
13.3. Market Attractiveness Analysis
13.3.1. By Country
13.3.2. By Product
13.3.3. By Application
13.3.4. By End-User
13.3.5. By Distribution Channel
13.4. Key Takeaways
14. South Asia and Pacific Market Analysis 2018 to 2022 and Forecast 2023 to 2033, By Country
14.1. Historical Market Size Value (US$ Million) & Volume (Units) Trend Analysis By Market Taxonomy, 2018 to 2022
14.2. Market Size Value (US$ Million) & Volume (Units) Forecast By Market Taxonomy, 2023 to 2033
14.2.1. By Country
14.2.1.1. India
14.2.1.2. Bangladesh
14.2.1.3. Australia
14.2.1.4. New Zealand
14.2.1.5. Rest of South Asia and Pacific
14.2.2. By Product
14.2.3. By Application
14.2.4. By End-User
14.2.5. By Distribution Channel
14.3. Market Attractiveness Analysis
14.3.1. By Country
14.3.2. By Product
14.3.3. By Application
14.3.4. By End-User
14.3.5. By Distribution Channel
14.4. Key Takeaways
15. East Asia Market Analysis 2018 to 2022 and Forecast 2023 to 2033, By Country
15.1. Historical Market Size Value (US$ Million) & Volume (Units) Trend Analysis By Market Taxonomy, 2018 to 2022
15.2. Market Size Value (US$ Million) & Volume (Units) Forecast By Market Taxonomy, 2023 to 2033
15.2.1. By Country
15.2.1.1. China
15.2.1.2. Japan
15.2.1.3. South Korea
15.2.2. By Product
15.2.3. By Application
15.2.4. By End-User
15.2.5. By Distribution Channel
15.3. Market Attractiveness Analysis
15.3.1. By Country
15.3.2. By Product
15.3.3. By Application
15.3.4. By End-User
15.3.5. By Distribution Channel
15.4. Key Takeaways
16. Middle East and Africa Market Analysis 2018 to 2022 and Forecast 2023 to 2033, By Country
16.1. Historical Market Size Value (US$ Million) & Volume (Units) Trend Analysis By Market Taxonomy, 2018 to 2022
16.2. Market Size Value (US$ Million) & Volume (Units) Forecast By Market Taxonomy, 2023 to 2033
16.2.1. By Country
16.2.1.1. GCC Countries
16.2.1.2. South Africa
16.2.1.3. Israel
16.2.1.4. Rest of MEA
16.2.2. By Product
16.2.3. By Application
16.2.4. By End-User
16.2.5. By Distribution Channel
16.3. Market Attractiveness Analysis
16.3.1. By Country
16.3.2. By Product
16.3.3. By Application
16.3.4. By End-User
16.3.5. By Distribution Channel
16.4. Key Takeaways
17. Key Countries Market Analysis
17.1. USA
17.1.1. Pricing Analysis
17.1.2. Market Share Analysis, 2022
17.1.2.1. By Product
17.1.2.2. By Application
17.1.2.3. By End-User
17.1.2.4. By Distribution Channel
17.2. Canada
17.2.1. Pricing Analysis
17.2.2. Market Share Analysis, 2022
17.2.2.1. By Product
17.2.2.2. By Application
17.2.2.3. By End-User
17.2.2.4. By Distribution Channel
17.3. Brazil
17.3.1. Pricing Analysis
17.3.2. Market Share Analysis, 2022
17.3.2.1. By Product
17.3.2.2. By Application
17.3.2.3. By End-User
17.3.2.4. By Distribution Channel
17.4. Mexico
17.4.1. Pricing Analysis
17.4.2. Market Share Analysis, 2022
17.4.2.1. By Product
17.4.2.2. By Application
17.4.2.3. By End-User
17.4.2.4. By Distribution Channel
17.5. Germany
17.5.1. Pricing Analysis
17.5.2. Market Share Analysis, 2022
17.5.2.1. By Product
17.5.2.2. By Application
17.5.2.3. By End-User
17.5.2.4. By Distribution Channel
17.6. UK
17.6.1. Pricing Analysis
17.6.2. Market Share Analysis, 2022
17.6.2.1. By Product
17.6.2.2. By Application
17.6.2.3. By End-User
17.6.2.4. By Distribution Channel
17.7. France
17.7.1. Pricing Analysis
17.7.2. Market Share Analysis, 2022
17.7.2.1. By Product
17.7.2.2. By Application
17.7.2.3. By End-User
17.7.2.4. By Distribution Channel
17.8. Spain
17.8.1. Pricing Analysis
17.8.2. Market Share Analysis, 2022
17.8.2.1. By Product
17.8.2.2. By Application
17.8.2.3. By End-User
17.8.2.4. By Distribution Channel
17.9. Italy
17.9.1. Pricing Analysis
17.9.2. Market Share Analysis, 2022
17.9.2.1. By Product
17.9.2.2. By Application
17.9.2.3. By End-User
17.9.2.4. By Distribution Channel
17.10. Poland
17.10.1. Pricing Analysis
17.10.2. Market Share Analysis, 2022
17.10.2.1. By Product
17.10.2.2. By Application
17.10.2.3. By End-User
17.10.2.4. By Distribution Channel
17.11. Russia
17.11.1. Pricing Analysis
17.11.2. Market Share Analysis, 2022
17.11.2.1. By Product
17.11.2.2. By Application
17.11.2.3. By End-User
17.11.2.4. By Distribution Channel
17.12. Czech Republic
17.12.1. Pricing Analysis
17.12.2. Market Share Analysis, 2022
17.12.2.1. By Product
17.12.2.2. By Application
17.12.2.3. By End-User
17.12.2.4. By Distribution Channel
17.13. Romania
17.13.1. Pricing Analysis
17.13.2. Market Share Analysis, 2022
17.13.2.1. By Product
17.13.2.2. By Application
17.13.2.3. By End-User
17.13.2.4. By Distribution Channel
17.14. India
17.14.1. Pricing Analysis
17.14.2. Market Share Analysis, 2022
17.14.2.1. By Product
17.14.2.2. By Application
17.14.2.3. By End-User
17.14.2.4. By Distribution Channel
17.15. Bangladesh
17.15.1. Pricing Analysis
17.15.2. Market Share Analysis, 2022
17.15.2.1. By Product
17.15.2.2. By Application
17.15.2.3. By End-User
17.15.2.4. By Distribution Channel
17.16. Australia
17.16.1. Pricing Analysis
17.16.2. Market Share Analysis, 2022
17.16.2.1. By Product
17.16.2.2. By Application
17.16.2.3. By End-User
17.16.2.4. By Distribution Channel
17.17. New Zealand
17.17.1. Pricing Analysis
17.17.2. Market Share Analysis, 2022
17.17.2.1. By Product
17.17.2.2. By Application
17.17.2.3. By End-User
17.17.2.4. By Distribution Channel
17.18. China
17.18.1. Pricing Analysis
17.18.2. Market Share Analysis, 2022
17.18.2.1. By Product
17.18.2.2. By Application
17.18.2.3. By End-User
17.18.2.4. By Distribution Channel
17.19. Japan
17.19.1. Pricing Analysis
17.19.2. Market Share Analysis, 2022
17.19.2.1. By Product
17.19.2.2. By Application
17.19.2.3. By End-User
17.19.2.4. By Distribution Channel
17.20. South Korea
17.20.1. Pricing Analysis
17.20.2. Market Share Analysis, 2022
17.20.2.1. By Product
17.20.2.2. By Application
17.20.2.3. By End-User
17.20.2.4. By Distribution Channel
17.21. GCC Countries
17.21.1. Pricing Analysis
17.21.2. Market Share Analysis, 2022
17.21.2.1. By Product
17.21.2.2. By Application
17.21.2.3. By End-User
17.21.2.4. By Distribution Channel
17.22. South Africa
17.22.1. Pricing Analysis
17.22.2. Market Share Analysis, 2022
17.22.2.1. By Product
17.22.2.2. By Application
17.22.2.3. By End-User
17.22.2.4. By Distribution Channel
17.23. Israel
17.23.1. Pricing Analysis
17.23.2. Market Share Analysis, 2022
17.23.2.1. By Product
17.23.2.2. By Application
17.23.2.3. By End-User
17.23.2.4. By Distribution Channel
18. Market Structure Analysis
18.1. Competition Dashboard
18.2. Competition Benchmarking
18.3. Market Share Analysis of Top Players
18.3.1. By Regional
18.3.2. By Product
18.3.3. By Application
18.3.4. By End-User
18.3.5. By Distribution Channel
19. Competition Analysis
19.1. Competition Deep Dive
19.1.1. Axel Bio Corporation, Inc
19.1.1.1. Overview
19.1.1.2. Product Portfolio
19.1.1.3. Profitability by Market Segments
19.1.1.4. Sales Footprint
19.1.1.5. Strategy Overview
19.1.1.5.1. Marketing Strategy
19.1.1.5.2. Product Strategy
19.1.1.5.3. Channel Strategy
19.1.2. Becton, Dickinson and Company
19.1.2.1. Overview
19.1.2.2. Product Portfolio
19.1.2.3. Profitability by Market Segments
19.1.2.4. Sales Footprint
19.1.2.5. Strategy Overview
19.1.2.5.1. Marketing Strategy
19.1.2.5.2. Product Strategy
19.1.2.5.3. Channel Strategy
19.1.3. Numedico
19.1.3.1. Overview
19.1.3.2. Product Portfolio
19.1.3.3. Profitability by Market Segments
19.1.3.4. Sales Footprint
19.1.3.5. Strategy Overview
19.1.3.5.1. Marketing Strategy
19.1.3.5.2. Product Strategy
19.1.3.5.3. Channel Strategy
19.1.4. Lifelong Group
19.1.4.1. Overview
19.1.4.2. Product Portfolio
19.1.4.3. Profitability by Market Segments
19.1.4.4. Sales Footprint
19.1.4.5. Strategy Overview
19.1.4.5.1. Marketing Strategy
19.1.4.5.2. Product Strategy
19.1.4.5.3. Channel Strategy
19.1.5. DMC Medical Ltd.
19.1.5.1. Overview
19.1.5.2. Product Portfolio
19.1.5.3. Profitability by Market Segments
19.1.5.4. Sales Footprint
19.1.5.5. Strategy Overview
19.1.5.5.1. Marketing Strategy
19.1.5.5.2. Product Strategy
19.1.5.5.3. Channel Strategy
19.1.6. Retractable Technologies, Inc.
19.1.6.1. Overview
19.1.6.2. Product Portfolio
19.1.6.3. Profitability by Market Segments
19.1.6.4. Sales Footprint
19.1.6.5. Strategy Overview
19.1.6.5.1. Marketing Strategy
19.1.6.5.2. Product Strategy
19.1.6.5.3. Channel Strategy
19.1.7. Smiths Medical
19.1.7.1. Overview
19.1.7.2. Product Portfolio
19.1.7.3. Profitability by Market Segments
19.1.7.4. Sales Footprint
19.1.7.5. Strategy Overview
19.1.7.5.1. Marketing Strategy
19.1.7.5.2. Product Strategy
19.1.7.5.3. Channel Strategy
19.1.8. Sol-Millennium Medical Group
19.1.8.1. Overview
19.1.8.2. Product Portfolio
19.1.8.3. Profitability by Market Segments
19.1.8.4. Sales Footprint
19.1.8.5. Strategy Overview
19.1.8.5.1. Marketing Strategy
19.1.8.5.2. Product Strategy
19.1.8.5.3. Channel Strategy
19.1.9. UltiMed, Inc. (Ulticare)
19.1.9.1. Overview
19.1.9.2. Product Portfolio
19.1.9.3. Profitability by Market Segments
19.1.9.4. Sales Footprint
19.1.9.5. Strategy Overview
19.1.9.5.1. Marketing Strategy
19.1.9.5.2. Product Strategy
19.1.9.5.3. Channel Strategy
19.1.10. Revolutions Medical Corporation
19.1.10.1. Overview
19.1.10.2. Product Portfolio
19.1.10.3. Profitability by Market Segments
19.1.10.4. Sales Footprint
19.1.10.5. Strategy Overview
19.1.10.5.1. Marketing Strategy
19.1.10.5.2. Product Strategy
19.1.10.5.3. Channel Strategy
19.1.11. Medicina (HMC Group)
19.1.11.1. Overview
19.1.11.2. Product Portfolio
19.1.11.3. Profitability by Market Segments
19.1.11.4. Sales Footprint
19.1.11.5. Strategy Overview
19.1.11.5.1. Marketing Strategy
19.1.11.5.2. Product Strategy
19.1.11.5.3. Channel Strategy
19.1.12. Haiou Medical
19.1.12.1. Overview
19.1.12.2. Product Portfolio
19.1.12.3. Profitability by Market Segments
19.1.12.4. Sales Footprint
19.1.12.5. Strategy Overview
19.1.12.5.1. Marketing Strategy
19.1.12.5.2. Product Strategy
19.1.12.5.3. Channel Strategy
19.1.13. Mediprim
19.1.13.1. Overview
19.1.13.2. Product Portfolio
19.1.13.3. Profitability by Market Segments
19.1.13.4. Sales Footprint
19.1.13.5. Strategy Overview
19.1.13.5.1. Marketing Strategy
19.1.13.5.2. Product Strategy
19.1.13.5.3. Channel Strategy
19.1.14. Cardinal Health
19.1.14.1. Overview
19.1.14.2. Product Portfolio
19.1.14.3. Profitability by Market Segments
19.1.14.4. Sales Footprint
19.1.14.5. Strategy Overview
19.1.14.5.1. Marketing Strategy
19.1.14.5.2. Product Strategy
19.1.14.5.3. Channel Strategy
19.1.15. Medline Industries
19.1.15.1. Overview
19.1.15.2. Product Portfolio
19.1.15.3. Profitability by Market Segments
19.1.15.4. Sales Footprint
19.1.15.5. Strategy Overview
19.1.15.5.1. Marketing Strategy
19.1.15.5.2. Product Strategy
19.1.15.5.3. Channel Strategy
19.1.16. Duopross Meditech Corp.
19.1.16.1. Overview
19.1.16.2. Product Portfolio
19.1.16.3. Profitability by Market Segments
19.1.16.4. Sales Footprint
19.1.16.5. Strategy Overview
19.1.16.5.1. Marketing Strategy
19.1.16.5.2. Product Strategy
19.1.16.5.3. Channel Strategy
19.1.17. Nipro Corporation
19.1.17.1. Overview
19.1.17.2. Product Portfolio
19.1.17.3. Profitability by Market Segments
19.1.17.4. Sales Footprint
19.1.17.5. Strategy Overview
19.1.17.5.1. Marketing Strategy
19.1.17.5.2. Product Strategy
19.1.17.5.3. Channel Strategy
19.1.18. Terumo Corporation
19.1.18.1. Overview
19.1.18.2. Product Portfolio
19.1.18.3. Profitability by Market Segments
19.1.18.4. Sales Footprint
19.1.18.5. Strategy Overview
19.1.18.5.1. Marketing Strategy
19.1.18.5.2. Product Strategy
19.1.18.5.3. Channel Strategy
20. Assumptions & Acronyms Used
21. Research Methodology
Explore Healthcare Insights
View Reports