The Retail Warehouse Management Systems Market is estimated to be valued at USD 2.8 billion in 2025 and is projected to reach USD 9.1 billion by 2035, registering a compound annual growth rate (CAGR) of 12.7% over the forecast period.
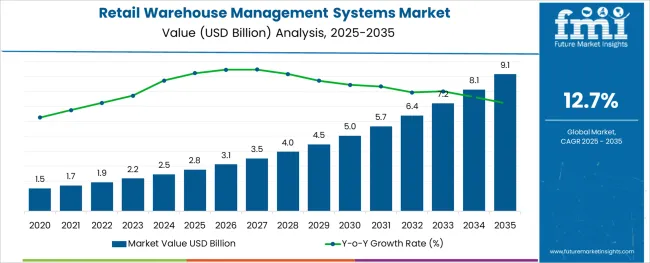
The retail warehouse management systems market is advancing steadily due to increasing operational complexity, growing omnichannel fulfillment demands, and heightened emphasis on inventory accuracy and supply chain efficiency. Rising e-commerce penetration and next-day delivery expectations have compelled retailers to modernize their warehouse workflows.
Investments in digitization, cloud-native infrastructure, and real-time inventory visibility have created favorable conditions for warehouse system upgrades. Strategic priorities around demand forecasting, returns handling, and labor optimization are further fueling technology integration.
Government-backed digitization initiatives and sustainability mandates are also encouraging retailers to streamline logistics through smarter warehouse operations. Looking forward, the adoption of AI-enhanced automation, API-driven system interoperability, and mobility-enabled dashboards is expected to drive continuous transformation across the retail warehousing landscape.
The market is segmented by Component, Enterprise Type, and Technology and region. By Component, the market is divided into Software and Services. In terms of Enterprise Type, the market is classified into Large enterprise and Small and medium enterprise. Based on Technology, the market is segmented into ERP warehouse applications, Supply chain management system, Vendor management system, and RFID solutions.
Regionally, the market is classified into North America, Latin America, Western Europe, Eastern Europe, Balkan & Baltic Countries, Russia & Belarus, Central Asia, East Asia, South Asia & Pacific, and the Middle East & Africa.
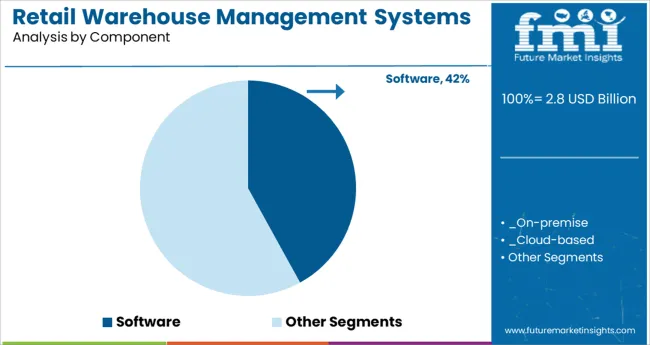
The software segment is anticipated to account for 42.00% of the overall market revenue in 2025, establishing itself as the leading component in the retail warehouse management systems market. This segment’s dominance is being attributed to growing investments in cloud-based platforms that offer real-time inventory updates, order accuracy, and automated replenishment features.
Increased demand for system scalability, seamless integration with e-commerce platforms, and intuitive user interfaces has further driven software adoption. Retailers are prioritizing software solutions that support both centralized and distributed inventory models while offering predictive analytics and customizable workflows.
The rising importance of data-driven decision-making and flexible configuration capabilities is expected to reinforce continued preference for software-centric solutions.
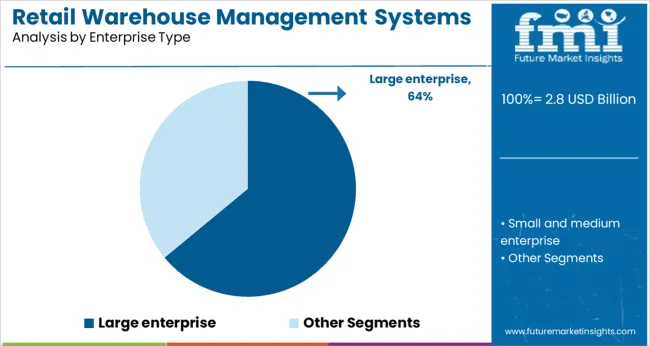
Large enterprises are projected to contribute 64.00% of the market share by 2025, making them the dominant enterprise type in the retail warehouse management systems market. This lead is being driven by higher transaction volumes, broader SKU assortments, and the complexity of managing multi-location fulfillment centers.
These organizations often require end-to-end visibility, integration with legacy ERP systems, and support for automated robotics and conveyor systems. Their capacity to invest in full-suite warehouse management systems with advanced reporting tools and security features has positioned them as early adopters.
Furthermore, their focus on enhancing delivery timelines, minimizing stockouts, and improving customer satisfaction is directly influencing the deployment of scalable, high-performance WMS solutions.
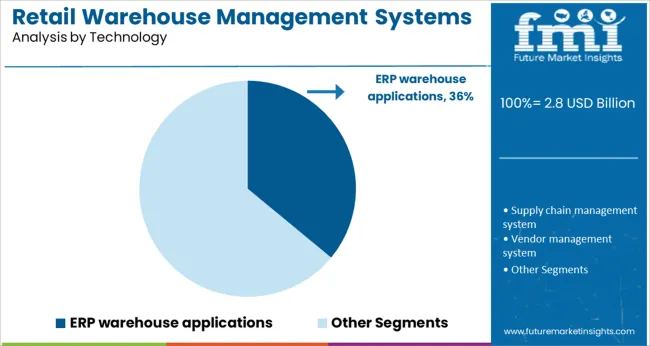
ERP-integrated warehouse applications are expected to hold 36.00% of the market revenue in 2025, positioning them as the leading technology segment. The growth of this segment is being driven by the ability of ERP-linked systems to unify warehouse operations with procurement, finance, and inventory planning.
These systems offer a single source of truth, eliminating data silos and improving interdepartmental communication. Retailers are increasingly relying on ERP-integrated WMS solutions to gain end-to-end operational insights, automate routine tasks, and ensure compliance with evolving regulatory and auditing requirements.
The demand for agile, module-based architecture that supports multi-channel order processing and vendor management is further enhancing the appeal of ERP-based warehouse solutions in retail environments.
Given the existence of high-growth economies such as China, India, and the Philippines, Asia Pacific is expected to be the most promising area throughout the projection period. The Indian government's Make in India strategy has resulted in the establishment of manufacturing and storage facilities in India.
India is also pushing toward digitalization, innovative engineering, and manufacturing. New manufacturing units for the automotive and healthcare industries have been planned and are being built in the nation. India is one of the world's largest users of energy and power.
Due to its huge energy consumption, India is increasingly shifting toward sustainable and renewable energy sources, including the use of solar energy. This has a beneficial impact on the demand for retail warehouse management systems to ensure an uninterrupted supply of items to users.
Furthermore, as the Asia Pacific is a price-sensitive market, enterprises employing retail warehouse management system technology choose SaaS. The model's advantages, such as lower entry cost and risk, cost-effective expansion, access to the greatest technology, and dynamic and sophisticated software capabilities, are capturing the attention of manufacturers.
Smaller businesses and many businesses prefer lower capital inputs and better flexibility. During the projection period, on-demand supply chain execution is predicted to obtain a greater share of the retail warehouse management systems market. WMS vendor Smart Turn was among the first to implement this strategy. To gain a presence in the industry, some providers have offered their software as a service. This factor had a significant influence in 2020 and is likely to rise throughout the projection period.
Companies may customize and supply a retail warehouse management system based on the needs of the client. The cloud-based WMS, for example, allows clients to expand or downsize the level of operations based on seasonal demand. eCommerce giants such as Amazon.com, Inc., Alibaba.com, and eBay Inc. are escalating their demand for retail warehouse management systems as they build additional warehouses throughout the globe. To meet the increased demand, various global corporations are establishing new warehouses in a diverse range of countries.
A cloud-native enterprise-class warehouse system, for instance, was introduced by Manhattan Associates in May 2024 and is called Manhattan Active Warehouse Management. It unifies all facets of distribution without requiring any upgrades.
HighJump was bought by Körber, which now serves as HighJump's strategic and financial partner. Automotive and aerospace, food distribution and processing, retail, consumer packaged products, drinks, craft brewing, health and wellness, third-party logistics, and wineries are among the businesses that use its software solutions.
In September 2024, Panasonic bought Blue Yonder Group, Inc. In February 2024, JDA Software changed its name to Blue Yonder Group, Inc. Blue Yonder Group, Inc. is a leading provider of comprehensive retail, multichannel, and supply chain planning and execution solutions.
The development of e-commerce and increased technological investment in emerging regions such as North America and the Asia Pacific is creating demand for retail warehouse management systems significantly.
Automation of warehouse management using various technologies is cutting expenses of workforce allocation, leading to an uptick in the adoption of retail warehouse management systems. Moreover, the retail warehouse management systems adoption trends are positively influenced by the aid provided in streamlining the operation of supply chain management, logistics, and production scheduling in retail enterprises.
There are several other benefits of this system which include the reduction in inventory, labor costs, increased customer service, and inventory efficiency, contributing to the retail warehouse management systems market growth. Furthermore, the demand for retail warehouse management systems is also on the rise owing to the solutions offered for scheduling goods required in stock where less safety stock is needed due to greater efficiency in inventory.
Advanced technologies used in retail warehousing provide material handling equipment that helps in moving goods in the warehouse efficiently, surging the adoption of retail warehouse management systems.
Increasing awareness of cloud-based technologies and reduced transportation costs are likely to expand the retail warehouse management systems market size during the forecast period. Increasing demand for e-commerce in the retail sector is considered one of the latest retail warehouse management systems market trends.
Every phase of supply chain management has been impacted by digital technology. Additionally, online purchases have multiplied. As a result, multichannel distribution facilities and staff are required to handle the increasing volume of goods and consumer demand, auguring well for the retail warehouse management systems market future trends.
The retail warehouse management systems' market trends and forecasts are improved by the system's capacity to deliver goods as quickly as possible via the shortest shipping routes. On the flip side, the adoption of retail warehouse management systems is hindered by higher investment in ERP and deployment of the warehouse management system and lack of IT infrastructure.
Risks related to the privacy of your data can arise from cybersecurity threats and granting unauthorized access to dubious internal parties, negatively impacting the retail warehouse management systems market outlook.
The retail warehouse management systems market is also affected by small-scale industries that are less likely to adopt retail warehouse management systems due to the additional costs associated with license purchases, upgrades, and employee training.
Retail warehouse management systems implementation lowers operational costs, improves labor productivity, and increases the efficiency of warehouse operations, but small-scale industries are not aware of its advantages of the same. Hence, this factor is also anticipated to dwindle the retail warehouse management systems market size in near future.
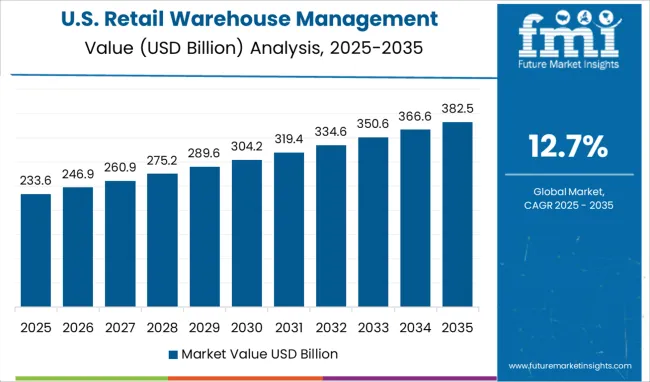
By 2025, North America is likely to capture a retail warehouse management systems market share of 35.5%. The same is facilitated by the existence of large networks of third-party logistics (3PL) businesses and corporations with international distribution and warehousing operations, as well as the ongoing expansion of the e-commerce sector.
A large number of ERP vendors were present in the USA in 2024, which contributed to the country having the largest market share in the area and fostering market expansion generally. In addition, there is a high demand for food and beverages across a variety of markets, necessitating a continuous supply from warehouses as it improves consistency, process efficiency, and quality control.
The growth of the retail warehouse management systems market in the European region is primarily driven by improvements in the warehouse management system and rising awareness of cloud-based WMS.
Due to the widespread use of multi-channel warehouse management systems, which provide real-time data on the inventory through barcoding, serial numbers, and RFID tagging, Germany is currently dominating the market in Europe.
Due to a rise in demand for the e-commerce sector, the UK is dominating. However, France is gaining ground due to a rise in the multi-channel warehouse management system's adoption. These factors are projected to contribute to the region’s retail warehouse management systems market share of 22.7% in 2025.
For small and medium-sized eCommerce and retail businesses, Logiwa is a cloud-based multichannel warehouse and inventory management system.
With the help of the solution, retail companies can create a procedure for handling backorders, cross-docking, storing inventory, and coordinating the fulfillment of multi-channel orders through intelligent picking.
Logiwa offers built-in integrations to delivery services like FedEx, USPS, Shipstation, and UPS, and marketplaces and shopping carts like Amazon, eBay, Shopify, Magento, Bigcommerce, and Walmart as well as accounting software like Quickbooks and Xero.
Another start-up playing a vital role is HighJump, that is providing cloud-based warehouse management software for logistics. Software for managing 3PLs, warehouses, shipping processes for carriers, and shippers, omnichannel fulfillment, shipment visibility, route optimization, and documentation are among its services. Software for managing manufacturing and retail operations is also offered.
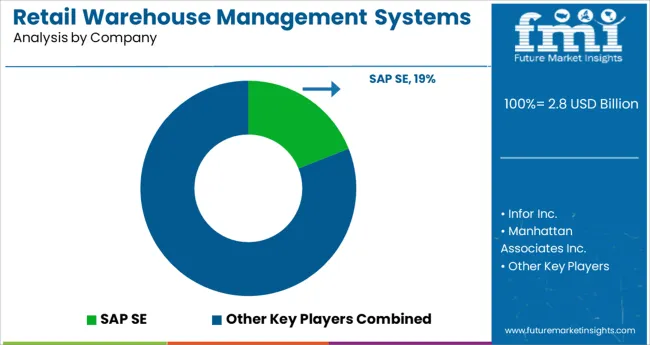
A few prominent players in the retail warehouse management systems market include Infor Inc., LogFire Inc., Manhattan Associates Inc., Made4net LLC, JDA Software Group, Inc., Oracle Corporation, SAP SE, Softeon, Inc., and Synergy Logistics Ltd.
HighJump Software Inc., Swisslog Holding AG, Tecsys, Inc., Indigo Software, Inc., Provia Software, Inc, NetSuite Inc., EXE Technologies, Royal 4 Systems, and NCR Corporation are some other players in the market.
The market players are concentrating on a number of strategies to augment their retail warehouse management systems market share. To become the leading provider of warehouse management systems, they have announced a number of partnerships, mergers & acquisitions, and other legal agreements. Additionally, these players are spending money on Research and Development projects to introduce fresh services to the market and bring about emerging trends in the retail warehouse management systems market.
| Report Attribute | Details |
|---|---|
| Growth Rate | CAGR of 12.7% from 2025 to 2035 |
| Base Year for Estimation | 2024 |
| Historical Data | 2020 to 2024 |
| Forecast Period | 2025 to 2035 |
| Quantitative Units | Revenue in USD Million and CAGR from 2025 to 2035 |
| Report Coverage | Revenue Forecast, Volume Forecast, Company Ranking, Competitive Landscape, Growth Factors, Trends, and Pricing Analysis |
| Segments Covered | Component, Enterprise Size, Technology, Region |
| Regions Covered | North America; Latin America; Europe; Eastern Europe; Asia Pacific excluding Japan; Japan; The Middle East and Africa |
| Key Countries Profiled | United States of America, Canada, Brazil, Argentina, Germany, United Kingdom, France, Spain, Italy, Nordics, BENELUX, Australia & New Zealand, China, India, ASEAN, GCC Countries, South Africa |
| Key Companies Profiled | Infor Inc.; LogFire Inc.; Manhattan Associates Inc.; Made4net LLC; JDA Software Group, Inc.; Oracle Corporation; SAP SE; Softeon, Inc.; Synergy Logistics Ltd.; HighJump Software Inc.; Swisslog Holding AG; Tecsys, Inc.; Indigo Software, Inc.; Provia Software, Inc.; NetSuite Inc.; EXE Technologies; Royal 4 Systems; NCR Corporation |
| Customization | Available Upon Request |
The global retail warehouse management systems market is estimated to be valued at USD 2.8 billion in 2025.
It is projected to reach USD 9.1 billion by 2035.
The market is expected to grow at a 12.7% CAGR between 2025 and 2035.
The key product types are software, _on-premise, _cloud-based, services, _operations and maintenance, _system integration and _consulting.
large enterprise segment is expected to dominate with a 64.0% industry share in 2025.


Our Research Products

The "Full Research Suite" delivers actionable market intel, deep dives on markets or technologies, so clients act faster, cut risk, and unlock growth.

The Leaderboard benchmarks and ranks top vendors, classifying them as Established Leaders, Leading Challengers, or Disruptors & Challengers.

Locates where complements amplify value and substitutes erode it, forecasting net impact by horizon

We deliver granular, decision-grade intel: market sizing, 5-year forecasts, pricing, adoption, usage, revenue, and operational KPIs—plus competitor tracking, regulation, and value chains—across 60 countries broadly.

Spot the shifts before they hit your P&L. We track inflection points, adoption curves, pricing moves, and ecosystem plays to show where demand is heading, why it is changing, and what to do next across high-growth markets and disruptive tech

Real-time reads of user behavior. We track shifting priorities, perceptions of today’s and next-gen services, and provider experience, then pace how fast tech moves from trial to adoption, blending buyer, consumer, and channel inputs with social signals (#WhySwitch, #UX).

Partner with our analyst team to build a custom report designed around your business priorities. From analysing market trends to assessing competitors or crafting bespoke datasets, we tailor insights to your needs.
Supplier Intelligence
Discovery & Profiling
Capacity & Footprint
Performance & Risk
Compliance & Governance
Commercial Readiness
Who Supplies Whom
Scorecards & Shortlists
Playbooks & Docs
Category Intelligence
Definition & Scope
Demand & Use Cases
Cost Drivers
Market Structure
Supply Chain Map
Trade & Policy
Operating Norms
Deliverables
Buyer Intelligence
Account Basics
Spend & Scope
Procurement Model
Vendor Requirements
Terms & Policies
Entry Strategy
Pain Points & Triggers
Outputs
Pricing Analysis
Benchmarks
Trends
Should-Cost
Indexation
Landed Cost
Commercial Terms
Deliverables
Brand Analysis
Positioning & Value Prop
Share & Presence
Customer Evidence
Go-to-Market
Digital & Reputation
Compliance & Trust
KPIs & Gaps
Outputs
Full Research Suite comprises of:
Market outlook & trends analysis
Interviews & case studies
Strategic recommendations
Vendor profiles & capabilities analysis
5-year forecasts
8 regions and 60+ country-level data splits
Market segment data splits
12 months of continuous data updates
DELIVERED AS:
PDF EXCEL ONLINE
Warehouse Barcode Systems Market
Cloud Systems Management Software Market Size and Share Forecast Outlook 2025 to 2035
Systems Administration Management Tools Market Size and Share Forecast Outlook 2025 to 2035
Labor Management System In Retail Market Size and Share Forecast Outlook 2025 to 2035
Home Energy Management Systems Market Size and Share Forecast Outlook 2025 to 2035
Battlefield Management Systems Market Size and Share Forecast Outlook 2025 to 2035
Translation Management Systems Market Analysis - Size, Share, and Forecast Outlook 2025 to 2035
Environmental Management Systems Market Size and Share Forecast Outlook 2025 to 2035
AGV Intelligent Management Systems Market Size and Share Forecast Outlook 2025 to 2035
Endoscopy Fluid Management Systems Market Size and Share Forecast Outlook 2025 to 2035
Train Control and Management Systems Market Size and Share Forecast Outlook 2025 to 2035
Component Content Management Systems Market Size and Share Forecast Outlook 2025 to 2035
Sponge City Rainwater Management Systems Market Size and Share Forecast Outlook 2025 to 2035
Advanced Distribution Management Systems Market Size and Share Forecast Outlook 2025 to 2035
Computerized Maintenance Management Systems (CMMS) Market Trends – Size, Share & Growth 2025–2035
Demand for AGV Intelligent Management Systems in USA Size and Share Forecast Outlook 2025 to 2035
Demand for AGV Intelligent Management Systems in UK Size and Share Forecast Outlook 2025 to 2035
Warehouse Design and Layout Market Size and Share Forecast Outlook 2025 to 2035
Warehouse Robotics Market Size and Share Forecast Outlook 2025 to 2035
Retail Paper Bag Market Size and Share Forecast Outlook 2025 to 2035

Thank you!
You will receive an email from our Business Development Manager. Please be sure to check your SPAM/JUNK folder too.
Chat With
MaRIA