Restaurant Griddle Market (2023 to 2033)

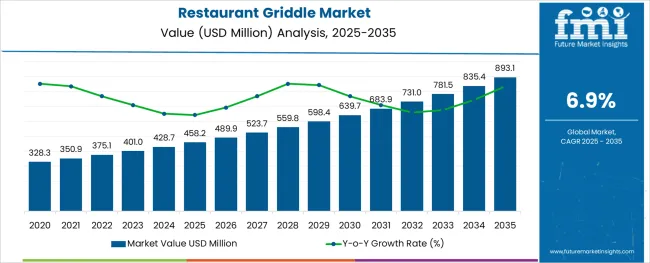
The restaurant griddle market is projected to have a CAGR of 6.9% by 2033. According to FMI, the market is expected to expand from US$ 401 million in 2023 to US$ 785 million by 2033. With a lower demand rate of 4.9% from 2018 to 2022, the market had a worth of US$ 380 million in 2022.

The quick acceleration in the growth rate of the restaurant griddle market can be ascribed to the ease of lockdown and the full capacity of the restaurant operations. Given that natural gas or liquid propane are frequently used as a heat source in restaurants and are less expensive than electricity, the demand for restaurant griddle is on the rise.

The most popular type of griddle used in restaurants is a commercial gas griddle. Faster temperature recovery and the availability of restaurant griddles with improved features are a couple of the factors driving the restaurant griddle market expansion during the forecast period.

Restaurants prioritize investing in commercial kitchen equipment. The better profit margins with the most restaurant griddle market potential are the main focus.

  • Commercial griddle may deliver even heating across the whole griddle plate surface, assisting in the preparation of consistently high-quality food products. Heavy-duty industrial griddles can be used to meet the needs of big food service enterprises. As a result, it is preferred by the restaurant griddle market players.
  • Restaurant griddles' cooking surfaces are often made of cast iron or stainless steel, which has the ability to hold heat and reheat griddles quickly as needed.
  • Industrial griddles with heat-setting control options assist cook food products at exact temperatures, reducing the risk of overcooking in commercial kitchens. Therefore, end users can improve production efficiency and boost earnings on food products due to the different advantages provided by restaurant griddles.

Don't pay for what you don't need

Customize your report by selecting specific countries or regions and save 30%!

Energy-efficient Equipment Boot Up the Restaurant Griddle Market Opportunities

One of the key driving factors for the global restaurant griddle market is consumers' increasing desire for energy-efficient cooking appliances. Restaurant griddle with energy-efficient features is being introduced by manufacturers in response to the growing need for cooking equipment for commercial kitchens that function more efficiently in terms of energy use, capacity, and cost.

Demand for restaurant griddle is high, as they are used mostly in food service organizations due to increased production efficiency while having low operating expenses. The adoption of these goods would be further aided by the increase in demand for food products made with restaurant griddle, and the release of restaurant griddle with ENERGY STAR certification.

Restaurant griddle manufacturers employ a variety of techniques to meet the strict specifications of the ENERGY STAR criteria for griddles, including

  • Use of highly conductive or reflective plate materials
  • Enhanced thermostatic controls
  • Strategically positioned thermocouples

Due to the availability of double-sided cooking choices, energy-efficient restaurant griddles cut cooking time by over 50% when compared to other regular types of restaurant griddles. Welbit subsidiary Garland Group has already introduced a double-sided griddle with cutting-edge temperature features.

Attributes Details
Restaurant Griddle Market CAGR (2023 to 2033) 6.9%
Restaurant Griddle Market Size (2023) US$ 401 million
Restaurant Griddle Market Size (2033) US$ 785 million

How the Restaurant Griddle Market Reshape from 2018 to 2022 to 2023 to 2033

Sales revenue in the restaurant griddle industry expanded at a 4.9% CAGR from 2018 to 2022. According to FMI, by 2033, demand for restaurant griddle would rise by 6.9%. The approximate market growth is expected to be $384 million.

Weak same-store sales and traffic continue to be a problem for the restaurant business. In February 2018 and January 2018, the number of people walking decreased by 3.1% and 3.2%, respectively. The rising number of new restaurants, alongside constrained growth in dining-out budgets, is essentially one of the main causes of such a decline in same-store sales.

Although there are more restaurants than ever, which drives up the sales of restaurant griddle even more. This is demonstrated by the anticipated higher CAGR of 6.9% between 2023 and 2033 compared to historical growth.

Nandini Roy Choudhury

Principal Consultant

Talk to Analyst

Find your sweet spots for generating winning opportunities in this market.

Overview of Key Trends Shaping the Market 

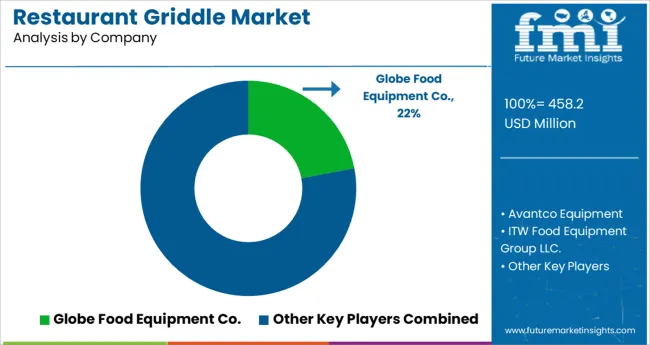
Restaurant griddle with infrared burners is becoming more popular as consumer preferences for griddle change. Over the projection period, it is expected that the worldwide restaurant griddle market would be very consolidated. The firms that are active in the market are concentrating on technology, Research, and Development (R&D) department operations, and brand image.

Along with the lightweight, safe, and multipurpose usage, the manufacturers are also concentrating on differentiating their products based on price, quality, and regulatory compliance, which boosts the market for global restaurant griddle throughout the projection period.

Restaurant griddle with thermostat controls is highly preferred by customers, as they offer the functionality to regulate the temperature appropriately and let the user choose the perfect cooking temperature for a variety of food items based on their needs.
Comparative View of Adjacent Restaurant Griddle Market

Restaurant Griddle Market:

Attributes Restaurant Griddle Market
CAGR (2023 to 2033) 6.9%
Market Value (2033) US$ 785 million
Growth Factor Due to their increased production efficiency and cheap running costs, restaurant griddle are in high demand, being utilized mostly in food service organizations.
Opportunity Global restaurant griddle consumers' growing preference for energy-efficient cooking equipment is creating new business opportunities.
Key Trends Manufacturers of restaurant griddle use a range of strategies to adhere to the stringent requirements of the Energy Star Certification.

Global Electric Countertop Griddles Market:

Attributes Global Electric Countertop Griddles Market
CAGR (2023 to 2033) 3.5%
Market Value (2033) US$ 179.06 million
Growth Factor The global market is expanding as a result of rising product awareness and rising product retail space.
Opportunity The expansion of global trade and maritime infrastructure is giving manufacturers new opportunities.
Key Trends Electric countertop griddles' new features should make it easier for businesses to compete in the world market.

Electric Grill Market:

Attributes Electric Grill Market
CAGR (2023 to 2033) 5.1%
Market Value (2033) US$ 7.66 billion
Growth Factor The preference for cooking at home as a way to pursue hobbies and free time is projected to boost increase.
Opportunity Features like compactness and convenience are becoming more important due to consumers' shifting lifestyles and the adoption of premium goods with advanced technology.
Key Trends The major firms are boosting their spending on innovation and technology, while also expanding their focus on convenience to reshape the various categories.

Get the data you need at a Fraction of the cost

Personalize your report by choosing insights you need
and save 40%!

Category-wise Outlook

Why Does the Gas Griddle Dominate the Restaurant Griddle Market?

With a CAGR of 7.1% during the forecast period, the gas griddle dominates the restaurant griddle market.

For frying huge quantities of pancakes, eggs, burgers, and other foods, gas griddles are commonly used in restaurants, hotels, cafes, and other commercial locations. The market is expanding as a result of the growing demand from fast food restaurants to prepare quick meals for their staff.

Double Sided Griddle Leads the Demand for Restaurant Griddle, based on Product Type

Double-sided gliders dominate the restaurant griddle market, with a CAGR of 6.7% from 2023 to 2033 compared to a CAGR of 4.7% from 2018 to 2022.

Cooking time is reduced by half when an item is grilled on both sides. With this novel, streamlined process, restaurants may effectively double their yield capacity.

Although there isn't a foolproof quick method, the kitchen staff may simply produce greater batches of menu items effectively. The double-sided construction provides consistent temperatures that guarantee unmistakable product consistency.

Region-wise Outlook

Africa and the Middle East are likely to continue to have a steady growth. The Latin American market grows since there are more firms operating there. The key players in the restaurant griddle market are inclined to grow in Europe due to the region's advanced manufacturing and industrial sector. But poor demand in developed nations has caused the market in the region to grow slowly.

High-end Machines Creating Scope For USA Restaurant Griddle Market

Due to rising investments, particularly from the end-use industries, the US restaurant griddle market is anticipated to reach US$ 196.25 million, growing from 5.7% CAGR (2018 to 2022) to 7.4%. (2023 to 2033). This is attributable to the creation and production of sophisticated and high-end items and machines.

Is Asia Pacific Emerging as a Fastest Growing Market for Restaurant Griddle?

The Asia Pacific area benefits greatly from increased demand, as significant projects are currently underway in nations like China, India, Australia, and Indonesia. A major manufacturing hub has arisen in the Asia Pacific.
China is projected to have a CAGR of 8.5%, with a market size of US$ 117.75 million. The region is continuing to benefit from a growing population, which is advantageous for the demand for restaurant griddle.

Significant Projects in Asia Pacific Restaurant Griddle Market

Country Japan
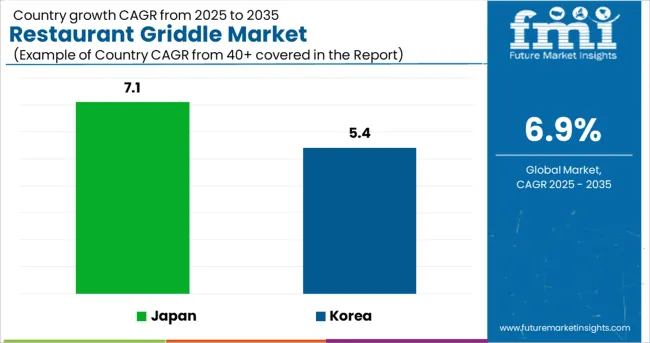
Market Size By 2033, Japan is projected to expand at a CAGR of 7.1%, with a market size of US$ 49.45 million.
Projects K2S, a Japanese firm, has the expertise and vision to assist in developing the ideal restaurant and is made within the customer’s budget due to the design and construction of more than 800 restaurants globally. They offer the 8200 BTU gas inlet rate, which provides strong heating that rapidly and efficiently cooks the meat. In comparison to other restaurants' griddle, it also reduces the time it takes for customers to return.
Country Korea
Market Size Previously, Korea's restaurant griddle market was growing at 5.4% CAGR. The market is expected to reach a valuation of US$ 19.625 million by 2033, with a CAGR of 5.4%.
Projects Samsung BBQ Grills offer the Ultimate Korean BBQ Grills. SamSung's KHood-100 BBQ hood is made specifically to remove all smoke and grease from the cooking pan.
For a long lifespan, it is made of 304 stainless steel, which is rust-free.

Restaurant Griddle Market Initiatives:Recent Investments From Well-Known Brands In Startups

Businesses like Blackstone Products, Chipotle, and Yum Brands make significant investments in start-ups to identify technology solutions and establish a presence in the industry.

Established businesses are already funding startups, as ambitious expansion objectives are accelerated by investing in forward-thinking businesses that aim to bring about real change at scale.

The decision was made at a time when restaurant businesses are looking for tech solutions to cut down on their daily labor needs and boost operational efficiency more urgently than in past years due to increased demand and a challenging labor market. As a result, manufacturers find new opportunities in the restaurant griddle market.
  • In order to go public, Blackstone Products is combining with a special-purpose acquisition firm, valuing the restaurant griddle manufacturer at about $780 million.
    • Blackstone, which was established in 2008, is the most recent business to announce a SPAC merger in an effort to generate money and spur expansion. These transactions have gained popularity as IPO alternatives, in part because they permit the firm going public to make business projections that aren't permitted in regular IPOs.
    • A SPAC is a shell business that generates capital and trades on the open market with the sole purpose of merging with a privately held corporation to go public. The private business replaces the SPAC in the stock market after submitting comprehensive financial documents to regulators and having the deal approved.
    • Given that more people are cooking at home as a result of the coronavirus epidemic, this deal continues a recent trend of investment activity for companies that provide outdoor cooking equipment.
    • In 2022, well-known grill manufacturers Weber Inc. and Traeger Inc., as well as Solo Brands Inc., owner of the well-known Solo Stove outdoor fire-pit brand, went public through conventional initial public offers.
    • Ackrell SPAC Partners I Co., a blank-check business with a consumer goods concentration, and Blackstone Products are merging.
  • In April 2022, the fast-casual restaurant chain with headquarters in Newport Beach, California, and almost 3,000 locations across five nations, announced the creation of Cultivate Next, a venture capital fund.
    • In order to achieve Chipotle's objectives, the fund plans to invest $50 million in Series B stage businesses developing restaurant technology solutions or other goods and services.
    • Moreover, as part of the company's Series C funding round, the company announced in March 2021 that it had invested in the robotic delivery company Nuro.
    • At the time, Garner said that Chipotle's goal of expanding access and convenience was in line with the technology's potential to transform the traditional delivery model.
  • In February 2022, Yum Brands, the parent company of KFC, Pizza Hut, Taco Bell, and The Habit Burger Grill, contributed to a $12 million fundraising round for the developer of Agot AI's computer vision restaurant management software.
    • Early tests of the technology suggest a promising potential to increase order accuracy and enhance the customer experience.

Synopsis of Competition Scenario of Restaurant Griddle Market

The dominant firms place a strong emphasis on product innovation as a consequence of new product development that assisted in gaining a larger restaurant griddle market share globally. Due to customers' rising preference for healthy food across most areas, the introduction of new products helps maintain consumer interest.

For instance, Weber-Stephen Products LLC introduced the flexible Q1400 in March 2018. The product can be used for roasting, convection cooking, baking, and grilling. TTK Prestige Ltd. unveiled a product with temperature control and non-stick heating plates in December 2016.

Key players

Key Segments

By Type:

  • Single Sided
  • Double Sided

By Power Type:

  • Gas Griddle
  • Electric Griddle

By Sales Channel:

  • Food Equipment Speciality Retailers
  • Brand Franchised Stores
  • Modern Trade
  • ecommerce Platforms
  • Others

By Region:

  • North America
  • Latin America
  • Europe
  • East Asia
  • South Asia and the Pacific
  • Middle East & Africa

Frequently Asked Questions

What is the Growth Outlook of the Restaurant Griddle Market?

The restaurant griddle market is estimated to record a CAGR of 6.9% during the forecast period.

What is the Projected Value of the Restaurant Griddle Market By 2033?

The restaurant griddle market size is predicted to be valued at US$ 785 million by 2033.

What is the Present Size of the Restaurant Griddle Market?

The restaurant griddle market share is valued at US$ 401 million in 2023.

Which is the Leading Region in the Restaurant Griddle Market?

North America is expected to lead the restaurant griddle market with a share of 7.4% by 2033.

Which is the Leading Segment in the Restaurant Griddle Market, Based on Type?

Double sided segment dominates the restaurant griddle market with a CAGR of 6.7% by 2033.

Table of Content

1. Executive Summary | Restaurant Griddle Market

    1.1. Global Market Outlook

    1.2. Demand-side Trends

    1.3. Supply-side Trends

    1.4. Technology Roadmap Analysis

    1.5. Analysis and Recommendations

2. Market Overview

    2.1. Market Coverage / Taxonomy

    2.2. Market Definition / Scope / Limitations

3. Market Background

    3.1. Market Dynamics

        3.1.1. Drivers

        3.1.2. Restraints

        3.1.3. Opportunity

        3.1.4. Trends

    3.2. Scenario Forecast

        3.2.1. Demand in Optimistic Scenario

        3.2.2. Demand in Likely Scenario

        3.2.3. Demand in Conservative Scenario

    3.3. Opportunity Map Analysis

    3.4. Product Life Cycle Analysis

    3.5. Supply Chain Analysis

        3.5.1. Supply Side Participants and their Roles

            3.5.1.1. Producers

            3.5.1.2. Mid-Level Participants (Traders/ Agents/ Brokers)

            3.5.1.3. Wholesalers and Distributors

        3.5.2. Value Added and Value Created at Node in the Supply Chain

        3.5.3. List of Raw Material Suppliers

        3.5.4. List of Existing and Potential Buyer’s

    3.6. Investment Feasibility Matrix

    3.7. Value Chain Analysis

        3.7.1. Profit Margin Analysis

        3.7.2. Wholesalers and Distributors

        3.7.3. Retailers

    3.8. PESTLE and Porter’s Analysis

    3.9. Regulatory Landscape

        3.9.1. By Key Regions

        3.9.2. By Key Countries

    3.10. Regional Parent Market Outlook

    3.11. Production and Consumption Statistics

    3.12. Import and Export Statistics

4. Global Market Analysis 2018 to 2022 and Forecast, 2023 to 2033

    4.1. Historical Market Size Value (US$ million) & Volume (Units) Analysis, 2018 to 2022

    4.2. Current and Future Market Size Value (US$ million) & Volume (Units) Projections, 2023 to 2033

        4.2.1. Y-o-Y Growth Trend Analysis

        4.2.2. Absolute $ Opportunity Analysis

5. Global Market Analysis 2018 to 2022 and Forecast 2023 to 2033, By Type

    5.1. Introduction / Key Findings

    5.2. Historical Market Size Value (US$ million) & Volume (Units) Analysis By Type, 2018 to 2022

    5.3. Current and Future Market Size Value (US$ million) & Volume (Units) Analysis and Forecast By Type, 2023 to 2033

        5.3.1. Single Sided

        5.3.2. Double Sided

    5.4. Y-o-Y Growth Trend Analysis By Type, 2018 to 2022

    5.5. Absolute $ Opportunity Analysis By Type, 2023 to 2033

6. Global Market Analysis 2018 to 2022 and Forecast 2023 to 2033, By Power Type

    6.1. Introduction / Key Findings

    6.2. Historical Market Size Value (US$ million) & Volume (Units) Analysis By Power Type, 2018 to 2022

    6.3. Current and Future Market Size Value (US$ million) & Volume (Units) Analysis and Forecast By Power Type, 2023 to 2033

        6.3.1. Gas Girddles

        6.3.2. Electric Girddles

    6.4. Y-o-Y Growth Trend Analysis By Power Type, 2018 to 2022

    6.5. Absolute $ Opportunity Analysis By Power Type, 2023 to 2033

7. Global Market Analysis 2018 to 2022 and Forecast 2023 to 2033, By Sales Channel

    7.1. Introduction / Key Findings

    7.2. Historical Market Size Value (US$ million) & Volume (Units) Analysis By Sales Channel, 2018 to 2022

    7.3. Current and Future Market Size Value (US$ million) & Volume (Units) Analysis and Forecast By Sales Channel, 2023 to 2033

        7.3.1. Food Equipment Speciality Retailers

        7.3.2. Brand Franchised Stores

        7.3.3. Modern Trade

        7.3.4. eCommerce Platforms

        7.3.5. Other Channels

    7.4. Y-o-Y Growth Trend Analysis By Sales Channel, 2018 to 2022

    7.5. Absolute $ Opportunity Analysis By Sales Channel, 2023 to 2033

8. Global Market Analysis 2018 to 2022 and Forecast 2023 to 2033, By Region

    8.1. Introduction

    8.2. Historical Market Size Value (US$ million) & Volume (Units) Analysis By Region, 2018 to 2022

    8.3. Current Market Size Value (US$ million) & Volume (Units) Analysis and Forecast By Region, 2023 to 2033

        8.3.1. North America

        8.3.2. Latin America

        8.3.3. Europe

        8.3.4. East Asia

        8.3.5. South Asia and ASEAN

        8.3.6. Oceania

        8.3.7. Middle East and Africa (MEA)

    8.4. Market Attractiveness Analysis By Region

9. North America Market Analysis 2018 to 2022 and Forecast 2023 to 2033, By Country

    9.1. Historical Market Size Value (US$ million) & Volume (Units) Trend Analysis By Market Taxonomy, 2018 to 2022

    9.2. Market Size Value (US$ million) & Volume (Units) Forecast By Market Taxonomy, 2023 to 2033

        9.2.1. By Country

            9.2.1.1. The USA

            9.2.1.2. Canada

        9.2.2. By Type

        9.2.3. By Power Type

        9.2.4. By Sales Channel

    9.3. Market Attractiveness Analysis

        9.3.1. By Country

        9.3.2. By Type

        9.3.3. By Power Type

        9.3.4. By Sales Channel

    9.4. Key Takeaways

10. Latin America Market Analysis 2018 to 2022 and Forecast 2023 to 2033, By Country

    10.1. Historical Market Size Value (US$ million) & Volume (Units) Trend Analysis By Market Taxonomy, 2018 to 2022

    10.2. Market Size Value (US$ million) & Volume (Units) Forecast By Market Taxonomy, 2023 to 2033

        10.2.1. By Country

            10.2.1.1. Brazil

            10.2.1.2. Mexico

            10.2.1.3. Rest of Latin America

        10.2.2. By Type

        10.2.3. By Power Type

        10.2.4. By Sales Channel

    10.3. Market Attractiveness Analysis

        10.3.1. By Country

        10.3.2. By Type

        10.3.3. By Power Type

        10.3.4. By Sales Channel

    10.4. Key Takeaways

11. Europe Market Analysis 2018 to 2022 and Forecast 2023 to 2033, By Country

    11.1. Historical Market Size Value (US$ million) & Volume (Units) Trend Analysis By Market Taxonomy, 2018 to 2022

    11.2. Market Size Value (US$ million) & Volume (Units) Forecast By Market Taxonomy, 2023 to 2033

        11.2.1. By Country

            11.2.1.1. Germany

            11.2.1.2. The United Kingdom

            11.2.1.3. France

            11.2.1.4. Spain

            11.2.1.5. Italy

            11.2.1.6. Rest of Europe

        11.2.2. By Type

        11.2.3. By Power Type

        11.2.4. By Sales Channel

    11.3. Market Attractiveness Analysis

        11.3.1. By Country

        11.3.2. By Type

        11.3.3. By Power Type

        11.3.4. By Sales Channel

    11.4. Key Takeaways

12. East Asia Market Analysis 2018 to 2022 and Forecast 2023 to 2033, By Country

    12.1. Historical Market Size Value (US$ million) & Volume (Units) Trend Analysis By Market Taxonomy, 2018 to 2022

    12.2. Market Size Value (US$ million) & Volume (Units) Forecast By Market Taxonomy, 2023 to 2033

        12.2.1. By Country

            12.2.1.1. China

            12.2.1.2. Japan

            12.2.1.3. South Korea

        12.2.2. By Type

        12.2.3. By Power Type

        12.2.4. By Sales Channel

    12.3. Market Attractiveness Analysis

        12.3.1. By Country

        12.3.2. By Type

        12.3.3. By Power Type

        12.3.4. By Sales Channel

    12.4. Key Takeaways

13. South Asia and ASEAN Market Analysis 2018 to 2022 and Forecast 2023 to 2033, By Country

    13.1. Historical Market Size Value (US$ million) & Volume (Units) Trend Analysis By Market Taxonomy, 2018 to 2022

    13.2. Market Size Value (US$ million) & Volume (Units) Forecast By Market Taxonomy, 2023 to 2033

        13.2.1. By Country

            13.2.1.1. Singapore

            13.2.1.2. Thailand

            13.2.1.3. India

            13.2.1.4. Indonesia

            13.2.1.5. Rest of South Asia and ASEAN

        13.2.2. By Type

        13.2.3. By Power Type

        13.2.4. By Sales Channel

    13.3. Market Attractiveness Analysis

        13.3.1. By Country

        13.3.2. By Type

        13.3.3. By Power Type

        13.3.4. By Sales Channel

    13.4. Key Takeaways

14. Oceania Market Analysis 2018 to 2022 and Forecast 2023 to 2033, By Country

    14.1. Historical Market Size Value (US$ million) & Volume (Units) Trend Analysis By Market Taxonomy, 2018 to 2022

    14.2. Market Size Value (US$ million) & Volume (Units) Forecast By Market Taxonomy, 2023 to 2033

        14.2.1. By Country

            14.2.1.1. Australia

            14.2.1.2. New Zealand

        14.2.2. By Type

        14.2.3. By Power Type

        14.2.4. By Sales Channel

    14.3. Market Attractiveness Analysis

        14.3.1. By Country

        14.3.2. By Type

        14.3.3. By Power Type

        14.3.4. By Sales Channel

    14.4. Key Takeaways

15. MEA Market Analysis 2018 to 2022 and Forecast 2023 to 2033, By Country

    15.1. Historical Market Size Value (US$ million) & Volume (Units) Trend Analysis By Market Taxonomy, 2018 to 2022

    15.2. Market Size Value (US$ million) & Volume (Units) Forecast By Market Taxonomy, 2023 to 2033

        15.2.1. By Country

            15.2.1.1. GCC Countries

            15.2.1.2. South Africa

            15.2.1.3. Israel

            15.2.1.4. Rest of MEA

        15.2.2. By Type

        15.2.3. By Power Type

        15.2.4. By Sales Channel

    15.3. Market Attractiveness Analysis

        15.3.1. By Country

        15.3.2. By Type

        15.3.3. By Power Type

        15.3.4. By Sales Channel

    15.4. Key Takeaways

16. Key Countries Market Analysis

    16.1. The USA

        16.1.1. Pricing Analysis

        16.1.2. Market Share Analysis, 2022

            16.1.2.1. By Type

            16.1.2.2. By Power Type

            16.1.2.3. By Sales Channel

    16.2. Canada

        16.2.1. Pricing Analysis

        16.2.2. Market Share Analysis, 2022

            16.2.2.1. By Type

            16.2.2.2. By Power Type

            16.2.2.3. By Sales Channel

    16.3. Brazil

        16.3.1. Pricing Analysis

        16.3.2. Market Share Analysis, 2022

            16.3.2.1. By Type

            16.3.2.2. By Power Type

            16.3.2.3. By Sales Channel

    16.4. Mexico

        16.4.1. Pricing Analysis

        16.4.2. Market Share Analysis, 2022

            16.4.2.1. By Type

            16.4.2.2. By Power Type

            16.4.2.3. By Sales Channel

    16.5. Germany

        16.5.1. Pricing Analysis

        16.5.2. Market Share Analysis, 2022

            16.5.2.1. By Type

            16.5.2.2. By Power Type

            16.5.2.3. By Sales Channel

    16.6. The United Kingdom

        16.6.1. Pricing Analysis

        16.6.2. Market Share Analysis, 2022

            16.6.2.1. By Type

            16.6.2.2. By Power Type

            16.6.2.3. By Sales Channel

    16.7. France

        16.7.1. Pricing Analysis

        16.7.2. Market Share Analysis, 2022

            16.7.2.1. By Type

            16.7.2.2. By Power Type

            16.7.2.3. By Sales Channel

    16.8. Spain

        16.8.1. Pricing Analysis

        16.8.2. Market Share Analysis, 2022

            16.8.2.1. By Type

            16.8.2.2. By Power Type

            16.8.2.3. By Sales Channel

    16.9. Italy

        16.9.1. Pricing Analysis

        16.9.2. Market Share Analysis, 2022

            16.9.2.1. By Type

            16.9.2.2. By Power Type

            16.9.2.3. By Sales Channel

    16.10. China

        16.10.1. Pricing Analysis

        16.10.2. Market Share Analysis, 2022

            16.10.2.1. By Type

            16.10.2.2. By Power Type

            16.10.2.3. By Sales Channel

    16.11. Japan

        16.11.1. Pricing Analysis

        16.11.2. Market Share Analysis, 2022

            16.11.2.1. By Type

            16.11.2.2. By Power Type

            16.11.2.3. By Sales Channel

    16.12. South Korea

        16.12.1. Pricing Analysis

        16.12.2. Market Share Analysis, 2022

            16.12.2.1. By Type

            16.12.2.2. By Power Type

            16.12.2.3. By Sales Channel

    16.13. Singapore

        16.13.1. Pricing Analysis

        16.13.2. Market Share Analysis, 2022

            16.13.2.1. By Type

            16.13.2.2. By Power Type

            16.13.2.3. By Sales Channel

    16.14. Thailand

        16.14.1. Pricing Analysis

        16.14.2. Market Share Analysis, 2022

            16.14.2.1. By Type

            16.14.2.2. By Power Type

            16.14.2.3. By Sales Channel

    16.15. India

        16.15.1. Pricing Analysis

        16.15.2. Market Share Analysis, 2022

            16.15.2.1. By Type

            16.15.2.2. By Power Type

            16.15.2.3. By Sales Channel

    16.16. Indonesia

        16.16.1. Pricing Analysis

        16.16.2. Market Share Analysis, 2022

            16.16.2.1. By Type

            16.16.2.2. By Power Type

            16.16.2.3. By Sales Channel

    16.17. Australia

        16.17.1. Pricing Analysis

        16.17.2. Market Share Analysis, 2022

            16.17.2.1. By Type

            16.17.2.2. By Power Type

            16.17.2.3. By Sales Channel

    16.18. New Zealand

        16.18.1. Pricing Analysis

        16.18.2. Market Share Analysis, 2022

            16.18.2.1. By Type

            16.18.2.2. By Power Type

            16.18.2.3. By Sales Channel

    16.19. GCC Countries

        16.19.1. Pricing Analysis

        16.19.2. Market Share Analysis, 2022

            16.19.2.1. By Type

            16.19.2.2. By Power Type

            16.19.2.3. By Sales Channel

    16.20. South Africa

        16.20.1. Pricing Analysis

        16.20.2. Market Share Analysis, 2022

            16.20.2.1. By Type

            16.20.2.2. By Power Type

            16.20.2.3. By Sales Channel

    16.21. Israel

        16.21.1. Pricing Analysis

        16.21.2. Market Share Analysis, 2022

            16.21.2.1. By Type

            16.21.2.2. By Power Type

            16.21.2.3. By Sales Channel

17. Market Structure Analysis

    17.1. Competition Dashboard

    17.2. Competition Benchmarking

    17.3. Market Share Analysis of Top Players

        17.3.1. By Regional

        17.3.2. By Type

        17.3.3. By Power Type

        17.3.4. By Sales Channel

18. Competition Analysis

    18.1. Competition Deep Dive

        18.1.1. Globe Food Equipment Co.

            18.1.1.1. Overview

            18.1.1.2. Product Portfolio

            18.1.1.3. Profitability by Market Segments

            18.1.1.4. Sales Footprint

            18.1.1.5. Strategy Overview

                18.1.1.5.1. Marketing Strategy

                18.1.1.5.2. Product Strategy

                18.1.1.5.3. Channel Strategy

        18.1.2. Avantco Equipment

            18.1.2.1. Overview

            18.1.2.2. Product Portfolio

            18.1.2.3. Profitability by Market Segments

            18.1.2.4. Sales Footprint

            18.1.2.5. Strategy Overview

                18.1.2.5.1. Marketing Strategy

                18.1.2.5.2. Product Strategy

                18.1.2.5.3. Channel Strategy

        18.1.3. ITW Food Equipment Group LLC.

            18.1.3.1. Overview

            18.1.3.2. Product Portfolio

            18.1.3.3. Profitability by Market Segments

            18.1.3.4. Sales Footprint

            18.1.3.5. Strategy Overview

                18.1.3.5.1. Marketing Strategy

                18.1.3.5.2. Product Strategy

                18.1.3.5.3. Channel Strategy

        18.1.4. Garland

            18.1.4.1. Overview

            18.1.4.2. Product Portfolio

            18.1.4.3. Profitability by Market Segments

            18.1.4.4. Sales Footprint

            18.1.4.5. Strategy Overview

                18.1.4.5.1. Marketing Strategy

                18.1.4.5.2. Product Strategy

                18.1.4.5.3. Channel Strategy

        18.1.5. Vollrath

            18.1.5.1. Overview

            18.1.5.2. Product Portfolio

            18.1.5.3. Profitability by Market Segments

            18.1.5.4. Sales Footprint

            18.1.5.5. Strategy Overview

                18.1.5.5.1. Marketing Strategy

                18.1.5.5.2. Product Strategy

                18.1.5.5.3. Channel Strategy

        18.1.6. Wells

            18.1.6.1. Overview

            18.1.6.2. Product Portfolio

            18.1.6.3. Profitability by Market Segments

            18.1.6.4. Sales Footprint

            18.1.6.5. Strategy Overview

                18.1.6.5.1. Marketing Strategy

                18.1.6.5.2. Product Strategy

                18.1.6.5.3. Channel Strategy

        18.1.7. Magic Chef

            18.1.7.1. Overview

            18.1.7.2. Product Portfolio

            18.1.7.3. Profitability by Market Segments

            18.1.7.4. Sales Footprint

            18.1.7.5. Strategy Overview

                18.1.7.5.1. Marketing Strategy

                18.1.7.5.2. Product Strategy

                18.1.7.5.3. Channel Strategy

        18.1.8. Black Stone

            18.1.8.1. Overview

            18.1.8.2. Product Portfolio

            18.1.8.3. Profitability by Market Segments

            18.1.8.4. Sales Footprint

            18.1.8.5. Strategy Overview

                18.1.8.5.1. Marketing Strategy

                18.1.8.5.2. Product Strategy

                18.1.8.5.3. Channel Strategy

        18.1.9. Bella

            18.1.9.1. Overview

            18.1.9.2. Product Portfolio

            18.1.9.3. Profitability by Market Segments

            18.1.9.4. Sales Footprint

            18.1.9.5. Strategy Overview

                18.1.9.5.1. Marketing Strategy

                18.1.9.5.2. Product Strategy

                18.1.9.5.3. Channel Strategy

        18.1.10. Clark Associates, Inc

            18.1.10.1. Overview

            18.1.10.2. Product Portfolio

            18.1.10.3. Profitability by Market Segments

            18.1.10.4. Sales Footprint

            18.1.10.5. Strategy Overview

                18.1.10.5.1. Marketing Strategy

                18.1.10.5.2. Product Strategy

                18.1.10.5.3. Channel Strategy

19. Assumptions & Acronyms Used

20. Research Methodology

Explore Process Automation Insights

View Reports
Future Market Insights

Restaurant Griddle Market