The Restaurant Glassware Market is estimated to be valued at USD 1485.8 million in 2025 and is projected to reach USD 2537.9 million by 2035, registering a compound annual growth rate (CAGR) of 5.5% over the forecast period.
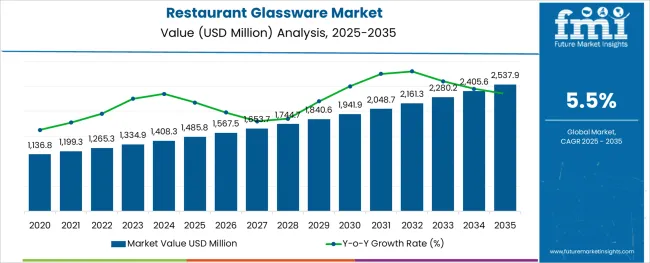
The restaurant glassware market is evolving steadily as dining establishments increasingly focus on enhancing guest experiences, sustainability, and brand image through premium yet functional tableware. Rising consumer expectations for aesthetic dining coupled with heightened competition among restaurants are driving investment in durable, elegant glassware.
Regulatory pressure to minimize disposable tableware and the shift toward more sustainable, reusable materials are also shaping market trends. Future growth is expected to be supported by innovation in materials offering improved durability and clarity, as well as the growing influence of online platforms for both procurement and design inspiration.
Manufacturers and distributors are responding to demands for customization and value, paving the way for broader adoption across different restaurant formats from casual dining to fine dining. This dynamic is fostering long term opportunities as operational efficiency, customer engagement, and sustainability goals align within the sector.
The market is segmented by Glassware Type, Price Point, and Distribution Channel and region. By Glassware Type, the market is divided into Drinking Glassware, Shot Glassware, Cocktail Glassware, Wine Glassware, Beverages Glassware, Others, and Decorative Glassware. In terms of Price Point, the market is classified into Economy, Medium, and Premium. Based on Distribution Channel, the market is segmented into Online, Specialized Store, Supermarkets, and Others. Regionally, the market is classified into North America, Latin America, Western Europe, Eastern Europe, Balkan & Baltic Countries, Russia & Belarus, Central Asia, East Asia, South Asia & Pacific, and the Middle East & Africa.
The market is segmented by Glassware Type, Price Point, and Distribution Channel and region. By Glassware Type, the market is divided into Drinking Glassware, Shot Glassware, Cocktail Glassware, Wine Glassware, Beverages Glassware, Others, and Decorative Glassware. In terms of Price Point, the market is classified into Economy, Medium, and Premium. Based on Distribution Channel, the market is segmented into Online, Specialized Store, Supermarkets, and Others. Regionally, the market is classified into North America, Latin America, Western Europe, Eastern Europe, Balkan & Baltic Countries, Russia & Belarus, Central Asia, East Asia, South Asia & Pacific, and the Middle East & Africa.
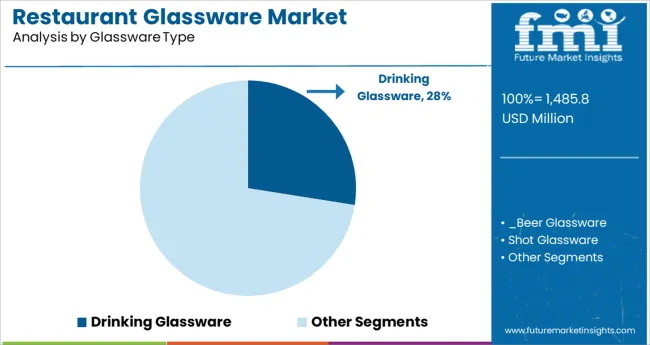
When segmented by glassware type, the drinking glassware segment is projected to hold 27.5% of the total market revenue in 2025, making it the leading segment. This leadership has been driven by the essential role drinking vessels play in nearly every dining experience, encompassing water, wine, cocktails, and soft beverages.
Durability and versatility of drinking glassware have positioned it as indispensable in both high volume casual settings and premium restaurants. Improvements in material strength and design have enhanced longevity and visual appeal, addressing both functional and aesthetic demands.
The ability of this segment to support branding efforts through etched logos and custom designs has further contributed to its prominence. Operationally, standardized shapes and stackable designs have improved storage and handling efficiencies, reinforcing its leading share within the glassware category.
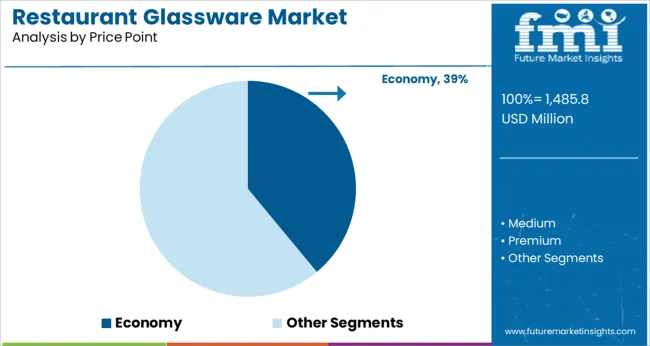
Segmented by price point, the economy segment is forecast to account for 39.0% of the market revenue in 2025, maintaining its top position. This dominance has been reinforced by strong demand from casual dining establishments and high turnover venues prioritizing cost control without compromising basic quality.
The economy segment has benefited from advancements in manufacturing that deliver durable yet affordable options meeting the needs of budget conscious operators. Its appeal is heightened by the ability to replace items frequently at minimal cost, which is critical in environments prone to breakage.
The widespread availability of economy glassware through distributors and the increasing use of standardized designs have improved operational consistency and reduced procurement complexities. This combination of affordability, functionality, and ease of replacement has secured its leadership in the price sensitive segments of the restaurant industry.
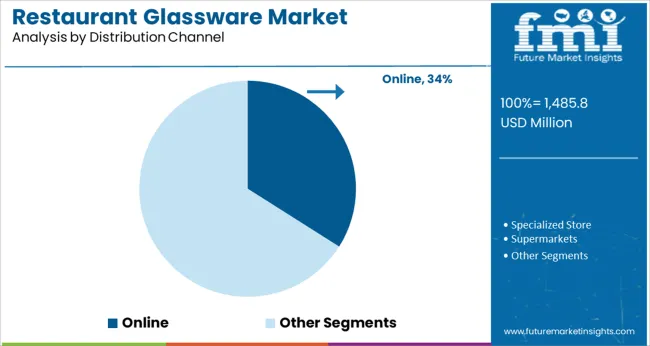
When segmented by distribution channel, the online segment is expected to capture 34.0% of the market revenue in 2025, establishing itself as the leading channel. This leadership has been supported by the convenience, transparency, and breadth of choice offered by online platforms, which appeal to a diverse range of restaurant operators.
Digital channels have enabled buyers to compare products, access reviews, and secure competitive pricing, streamlining the procurement process. Enhanced logistics capabilities and faster delivery options have mitigated previous barriers to online adoption, while the integration of virtual showrooms and 3D visualization tools has improved buyer confidence in product selection.
Additionally, the ability to access exclusive deals, bulk discounts, and tailored recommendations has strengthened the appeal of online purchasing. These factors collectively have positioned the online channel as a preferred choice for efficient and informed glassware sourcing in the modern restaurant landscape.
According to data gathered by Future Industry Insights, the restaurant glassware market has lately seen an utterly unexpected boom. Restaurants and industrial producers are keeping up with the growing demand for elegant, trendy, and aesthetically appealing glassware. From 2.9% between 2020 and 2025 to 5.5% between 2025 and 2035, the CAGR of the restaurant glassware market grew gradually.
Guests eat and drink with their eyes. As it moves across the table, exquisitely prepared food and beverages draw admiring glances. Therefore, taking advantage of wise glassware selections has a good impact on the sales of the restaurants. Many customers now judge the beverage that is served to them based on how it looks. The entire operational expenses are impacted by the choice of glassware. Fortunately, producers of bar glassware continue to innovate, pushing the boundaries of production techniques and different materials to create high-quality, useful, and beautiful goods. In order to provide a more concentrated route for liquids to be experienced in the mouth, producers are now reinforcing rims while lowering rim thickness. Some businesses offer a great insurance policy on the investment by promising that the rims, stems, and feet of specific brands would not shatter.
There is presently a wide selection of cutting-edge, creative glassware. A few producers have also experimented with resin during the past few years. Reducing glass shattering can assist to reduce worker and visitor accidents as well as replacement expenses. Resin can be added to the interior of a glass or in between layers of glass. Resin can shield glassware logos or embellishments from human touch and dishwater. Currently, a small group of producers is working on strategies to lighten glassware while ensuring more effective mass production. These factors have driven the restaurant glassware market progressively and created further opportunities.
Drinking Glassware - By Glassware Type
The restaurant glassware market is divided into drinking glassware and decorative glassware based on the glassware type. The market is dominated by the drinking glassware category. During the projection period, this market segment is probably going to retain close to 48.9% of the global market share. The quick movement of this segment is caused by:
Specialized Store - Distribution Channel
The restaurant glassware market is broken down into the internet, specialty stores, supermarkets, and others depending on the distribution channel. The specialty store segment is predicted to have the biggest market share, approximately 39.2%, throughout the forecast period. The driving factors for this segment are as follows:
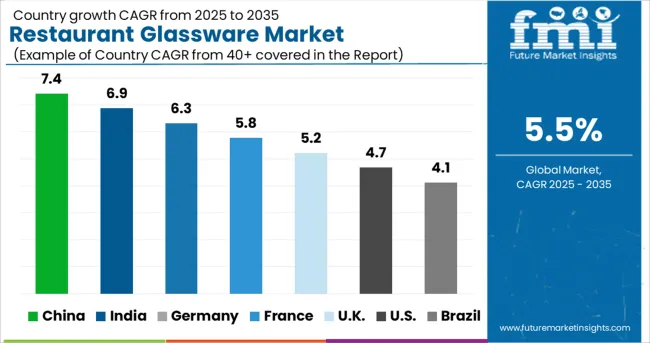
The leisure and hospitality industry in the USA is a highly progressive subset of the service-providing sectors, according to a report released by the Bureau of Labor Statistics. As a result, the US controls the majority of the North American restaurant glassware market. During the projected period, the US restaurant glassware market is anticipated to account for almost 19.8% of the global market. The main factors that contribute to the expansion of the restaurant glassware market are:
Over the forecast period, the UK is expected to rise at a CAGR of 7.3% and contribute to the bulk of the European restaurant glassware market. Consumers with more purchasing capacity and increased consumption of a variety of glass tableware are the main drivers for the UK restaurant glassware market. Aspects contributing to the market growth are:
In the Asia Pacific region, China is the country with the largest market for restaurant glassware. The Chinese restaurant glassware market is likely to expand rapidly. The forecast period is expected to witness a CAGR of 7.3% in this market. Growth is mostly supported by increased investment in local eateries and fast-food companies. Other elements underwriting to the market are as follows
New Market Participants to Encourage Innovation
The market for restaurant glassware offers several opportunities for start-up businesses and businesspeople. Although the industry is still in its infancy, many developments and discoveries are forthcoming. Start-ups in the restaurant glassware industry are making every effort to offer the best glassware to restaurants so that their patrons may enjoy great dining. Start-ups are producing glassware for restaurants that could be pleasant to use when dining there.
Leading Start-ups to Keep an Eye on
| Start-up Company | Glastic Global |
|---|---|
| Country | India |
| Description | The firm is a well-known glassware manufacturer with its headquarters in the glass-making capital of India, Firozabad (Uttar Pradesh, India). It manufactures, trades, and supplies various glass tumblers, decorative items, and tableware. Their goods are utilized for merchandising purposes as well as in residences, restaurants, bars, hotels, and clubs. These items are offered with a variety of Specifications and Customizations in order to satisfy the unique needs of its cherished clients. |
| Start-up Company | Evolution Glass |
|---|---|
| Country | United States |
| Description | Bill Hess established Evolution Glass in 2020Evolution Glass actively improves the planet by keeping glass out of landfills and using it to manufacture attractive and useful items. Utilizing only glass from recycled bottle bottles, Evolution Glass creates useful art pieces and unique surfaces of the highest quality. Its goal is to repurpose waste glass, add beauty to homes and workplaces, and protect the environment all at once. |
The tier-1 companies hold the majority of the market share in the moderately competitive global restaurant glassware industry. The main approach used by key players is business expansion through mergers, acquisitions, collaborations, and alliances, with a focus on various strategies like the adoption of new technologies to develop innovative products and the expansion of sales channels, which results in a larger customer base.
Discover New Possibilities in the World of Fine Dining With the Jaton Glassware, Bormioli Rocco, and Borosil
One of the most reputable and experienced restaurant glassware suppliers and manufacturers in north China is Jaton Glassware. Its facility is situated in SHANXI, the largest and most renowned production hub for Chinese glassware. Its product line includes cocktail glasses, wine glasses, and beer glasses.
On the other hand, with three manufacturing facilities, two decorative facilities, flagship shops, and five sales branches, Bormioli Rocco is a premier glass maker in Italy and a significant global player. A broad variety of goods from Bormioli Rocco Tableware are available, enhancing consumers' culinary experiences and bringing a touch of Italian warmth to their tables.
Another popular company is Borosil which has been the most reputable glassware brand in India since 1962. It is known as heatproof glassware and dominates the consumer glassware market in India as well as the USA and the Netherlands.
Recent Developments
The global restaurant glassware market is estimated to be valued at USD 1,485.8 million in 2025.
It is projected to reach USD 2,537.9 million by 2035.
The market is expected to grow at a 5.5% CAGR between 2025 and 2035.
The key product types are drinking glassware, _beer glassware, shot glassware, cocktail glassware, wine glassware, beverages glassware, others, decorative glassware, _table glassware, _eatery glassware, _partition glassware and _others.
economy segment is expected to dominate with a 39.0% industry share in 2025.


Full Research Suite comprises of:
Market outlook & trends analysis
Interviews & case studies
Strategic recommendations
Vendor profiles & capabilities analysis
5-year forecasts
8 regions and 60+ country-level data splits
Market segment data splits
12 months of continuous data updates
DELIVERED AS:
PDF EXCEL ONLINE
Restaurant POS Terminals Market Size and Share Forecast Outlook 2025 to 2035
Restaurant Fryers Market Size and Share Forecast Outlook 2025 to 2035
Restaurant Equipment Market Size and Share Forecast Outlook 2025 to 2035
Restaurant Griddle Market Size and Share Forecast Outlook 2025 to 2035
Evaluating Market Share in Restaurants & Mobile Food Services
Restaurants & Mobile Food Services Market Trends – Forecast 2025 to 2035
Analysis and Growth Projections for Restaurant Takeout Business
POS Restaurant Management System Market Size and Share Forecast Outlook 2025 to 2035
Used Restaurant Equipment Market Size and Share Forecast Outlook 2025 to 2035
Commercial Restaurant Rangers Market
Full-Service Restaurants Market Analysis by Model, Service, Location, and Region Through 2035
Commercial Gas Restaurant Ranges Market Size and Share Forecast Outlook 2025 to 2035
Commercial Electric Restaurant Ranges Market Size and Share Forecast Outlook 2025 to 2035
Airport Quick Service Restaurant Market Size and Share Forecast Outlook 2025 to 2035
Fast Food & Quick Service Restaurant Market Trends – Growth & Forecast 2025 to 2035
Glassware Market Size and Share Forecast Outlook 2025 to 2035
Competitive Overview of Beer Glassware Market Share
Laboratory Glassware and Plasticware Market

Thank you!
You will receive an email from our Business Development Manager. Please be sure to check your SPAM/JUNK folder too.
Chat With
MaRIA