Reduced Lactose Whey Market Snapshot (2022-2032)

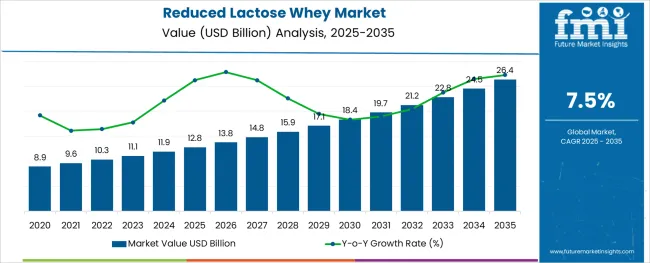
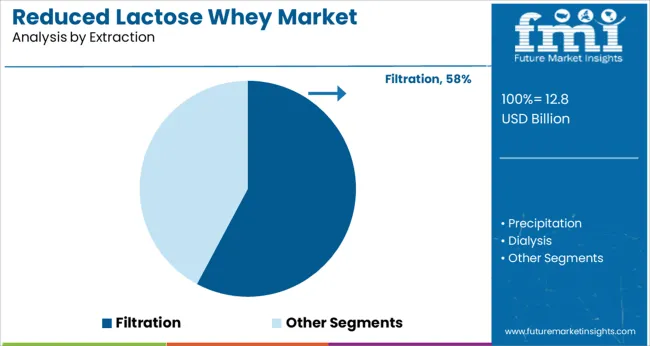
[299 Pages Report] Global Reduced lactose whey demand is anticipated to be valued at US$ 11.07 Billion in 2022, forecast to grow at a CAGR of 7.5% to be valued at US$ 22.82 Billion from 2022 to 2032. Reduced lactose whey is whey powder with less lactose concentration, typically less than 60%. The lactose in the sweet whey liquid is filtered out to make the reduced lactose whey. Precipitation, filtration, or dialysis are used to remove the lactose.

Report Attribute Details
Estimated Base Year Value (2021) US$ 10.3 Billion
Expected Market Value (2022) US$ 11.07 Billion
Anticipated Forecast Value (2032) US$ 22.82 Billion
Projected Growth Rate (2022 to 2032) 7.5% CAGR

The filtered liquid is then spray dried to produce reduced lactose whey powder. It is primarily used to replace whey when low lactose and higher protein content are required.

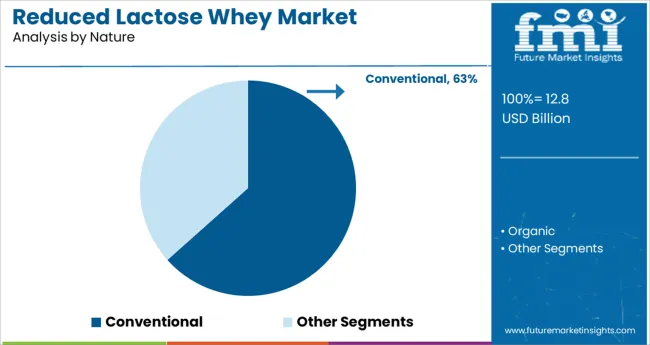
Organic and conventional reduced lactose whey are both available on the market. Reduced lactose whey has a wide range of applications in the food and beverage industries. It is used as a cost-effective source of dairy solids.

Reduced lactose whey is used in dairy, food processing, meat processing, infant food, and a variety of other F&B industries. It is also used as a protein source in nutraceuticals.

Don't pay for what you don't need

Customize your report by selecting specific countries or regions and save 30%!

Which are Some Prominent Drivers Spearheading Reduced lactose whey Market Growth?

The production of reduced lactose whey is in its early stages, with only a small number of companies producing it. The use of reduced lactose whey in the food industry is increasing because the product is economically viable and also because the lactose content is very low, making it suitable for use in any type of food product, not just dairy products.

Furthermore, the processing of the reduced lactose whey incurs no additional costs, and the lactose is removed using a physical separation technique. As a result, cheese manufacturing companies can produce reduced lactose whey powder at very low production costs, which is in high demand in end-use industries.

What are the Challenges Faced by the Reduced Lactose Whey Market?

The global demand for plant proteins is being driven by rising product demand as consumers become more aware of the importance of eating a healthy diet and leading an active lifestyle. Furthermore, rising innovations in the manufacturing of proteins that contain a diverse range of amino acids and perform specific functions such as energy balance, weight loss, muscle repair, and satiety by various manufacturers are creating a massive market opportunity for plant proteins. As a result, it directly substitutes animal protein products, slowing the growth of the reduced lactose whey market.
Nandini Roy Choudhury

Principal Consultant

Talk to Analyst

Find your sweet spots for generating winning opportunities in this market.

Why is North America Emerging as an Opportunistic Reduced lactose whey Market?

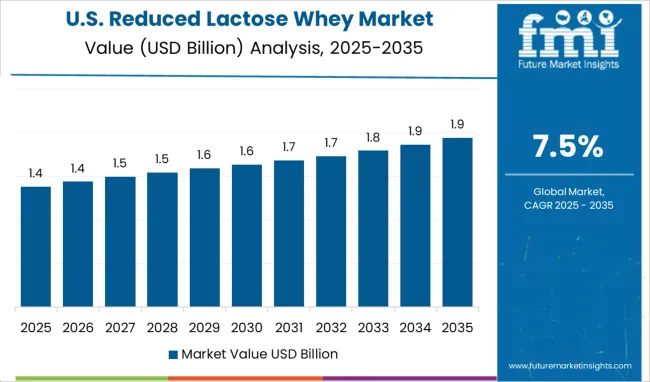
Rising consumer concerns about daily protein intake and rising health awareness are expected to drive demand for reduced lactose whey powders in North America. The convenience and ease of use of reduced lactose whey powders for making protein shakes or blending them with a variety of food products to meet changing consumer tastes and preferences are expected to drive product demand in North America.
How is Europe Contributing to the Growth of the Reduced Lactose Whey Market?

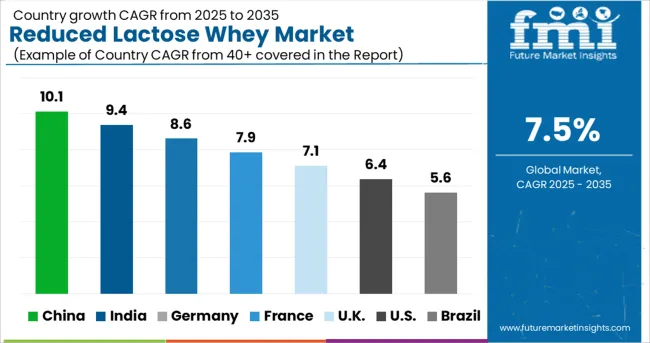
The Europe market is expected to grow moderately over the forecast period due to factors such as rising emphasis on healthy living, an increasing trend of preventive health care, and rising demand for reduced lactose whey from the United Kingdom, Germany, and France.

The increased use of protein products in synthetic and naturally derived personal care products is expected to have a positive impact on its market in the coming years. Furthermore, the country's growing number of food processing industries has resulted in large imports of animal proteins, particularly whey protein, in recent years. The trend is expected to continue over the forecast period.

Get the data you need at a Fraction of the cost

Personalize your report by choosing insights you need
and save 40%!

Why is Asia-Pacific Emerging as an Opportunistic Reduced lactose whey Market?

Due to increased exports and domestic demand for dairy-based protein ingredients such as casein and whey, Asia Pacific is expected to grow the fastest. The rising geriatric population and constantly changing climate conditions in emerging countries such as India have raised concerns about skin problems, which are expected to drive personal care product demand and likely augment market growth in the Asia Pacific over the forecast period.

Category wise insights

Will Food and Beverage Segment propel Market Demand?

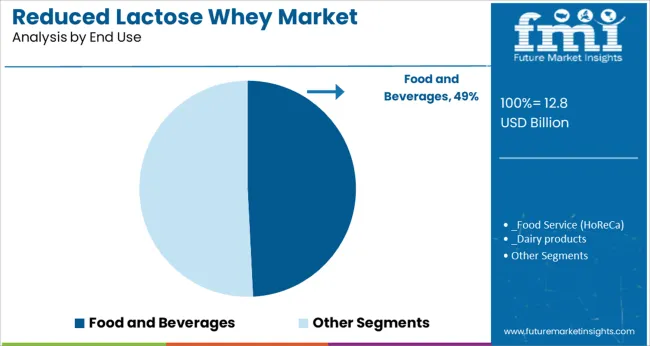
Because of its health benefits, reduced lactose whey is increasingly being used in a variety of food and beverage applications such as dairy, bakery, energy drinks, and confectionery products. Food additives, consumer food, nutraceutical supplements, animal feed, alcoholic drinks, aerated drinks, non-alcoholic drinks, and juices or health drinks are all part of the food industry. As a result of their various properties of reduced lactose whey, such as their ability to act as a stabilizing agent, flavor enhancer, and emulsifying salt, the food, and beverage sector is expected to drive market demand over the forecast period.
Market Competition

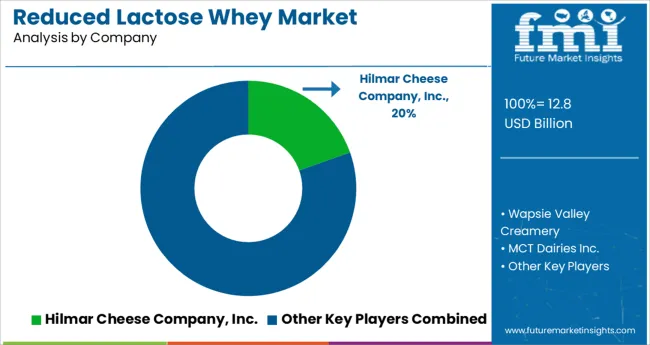
Wapsie Valley Creamery, Inc., Hilmar Cheese Company, Inc., MCT Dairies Inc., G&R Foods Inc., HoogwegtGroep B.V., Grande Cheese Company, Agropur Inc., Graham Chemical Corporation, Fonterra Inc., Interfood Inc., Leprino Foods Company, Dana Foods Inc., and AMCO Proteins are some of the leading players in the global reduced lactose whey market.

Report Scope

Report Attribute Details
Growth Rate CAGR of 7.5% from 2022 to 2032
Market Value in 2022 US$ 11.07 Billion
Market Value in 2032 US$ 22.82 Billion
Base Year for Estimation 2021
Historical Data 2017 to 2021
Forecast Period 2022 to 2032
Quantitative Units Revenue in USD Million and CAGR from 2022 to 2032
Report Coverage Revenue Forecast, Volume Forecast, Company Ranking, Competitive Landscape, Growth Factors, Trends and Pricing Analysis
Segments Covered
  • Nature
  • Extraction
  • End Use
  • Distribution Channel
  • Region
Regions Covered
  • North America
  • Latin America
  • Europe
  • Asia Pacific
  • Middle East and Africa
Key Countries Profiled
  • USA
  • Canada
  • Brazil
  • Mexico
  • Germany
  • UK
  • France
  • Spain
  • Italy
  • Russia
  • BENELUX
  • China
  • Japan
  • South Korea
  • GCC
  • South Africa
  • Turkey
Key Companies Profiled
  • Wapsie Valley Creamery
  • Hilmar Cheese Company Inc.
  • MCT Dairies Inc.
  • G&R Foods Inc.
  • HoogwegtGroep B.V.
  • Grande Cheese Company
  • Agropur Inc.
  • Graham Chemical Corporation
  • Fonterra Inc.
  • Interfood Inc.
  • Leprino Foods Company,
  • Dana Foods Inc.
  • AMCO Proteins
Customization Available Upon Request

Key Segments Covered in the Reduced Lactose Whey Market Report

Reduced Lactose Whey Market by Nature:

  • Organic Reduced Lactose Whey
  • Conventional Reduced Lactose Whey

Reduced Lactose Whey Market by Extraction:

  • Reduced Lactose Whey Extraction by Precipitation
  • Reduced Lactose Whey Extraction by Filtration
  • Reduced Lactose Whey Extraction by Dialysis

Reduced Lactose Whey Market by End Use:

  • Reduced Lactose Whey in Food and Beverages
    • Food Service (HoReCa)
    • Dairy Products
    • Food Processing
    • Bakery Products
    • Soups and Sauces
    • Frozen Foods
    • Meat Processing
    • Infant Food
    • Beverage Processing
    • Others
  • Reduced Lactose Whey in Nutraceuticals
  • Reduced Lactose Whey for Household/Retail Use

Reduced Lactose Whey Market by Distribution Channel:

  • Direct/B2B Reduce Lactose Whey Sales
  • Indirect/ B2C Reduced Lactose Whey Sales
    • Supermarkets/Hypermarkets
    • Specialty Stores
    • e-Retail

Reduced Lactose Whey Market by Region:

  • North America Reduced Lactose Whey Market
  • Latin America Reduced Lactose Whey Market
  • Europe Reduced Lactose Whey Market
  • Asia Pacific Reduced Lactose Whey Market
  • Middle East and Africa Reduced Lactose Whey Market

Frequently Asked Questions

What is the anticipated growth of the reduced lactose whey market until 2032?

FMI projects the global reduced lactose whey market to expand at a 7.5% value CAGR by 2032

Which region is forecast to be the most lucrative for reduced lactose whey market growth?

North America is expected to be the most opportunistic reduced lactose whey market.

Which are some prominent reduced lactose whey manufacturers?

Wapsie Valley Creamery, Inc., Hilmar Cheese Company, Inc., MCT Dairies Inc., G&R Foods Inc., HoogwegtGroep B.V., Grande Cheese Company, Agropur Inc., Graham Chemical Corporation, Fonterra Inc., Interfood Inc., Leprino Foods Company, Dana Foods Inc., and AMCO Proteins are some prominent reduced lactose whey manufacturers.

Table of Content

1. Executive Summary

    1.1. Global Market Outlook

    1.2. Demand-side Trends

    1.3. Supply-side Trends

    1.4. Technology Roadmap Analysis

    1.5. Analysis and Recommendations

2. Market Overview

    2.1. Market Coverage / Taxonomy

    2.2. Market Definition / Scope / Limitations

3. Market Background

    3.1. Market Dynamics

        3.1.1. Drivers

        3.1.2. Restraints

        3.1.3. Opportunity 

        3.1.4. Trends

    3.2. Scenario Forecast

        3.2.1. Demand in Optimistic Scenario

        3.2.2. Demand in Likely Scenario

        3.2.3. Demand in Conservative Scenario

    3.3. Opportunity Map Analysis

    3.4. Product Life Cycle Analysis

    3.5. Supply Chain Analysis

        3.5.1. Supply Side Participants and their Roles

            3.5.1.1. Producers

            3.5.1.2. Mid-Level Participants (Traders/ Agents/ Brokers)

            3.5.1.3. Wholesalers and Distributors

        3.5.2. Value Added and Value Created at Node in the Supply Chain

        3.5.3. List of Raw Material Suppliers

        3.5.4. List of Existing and Potential Buyer’s

    3.6. Investment Feasibility Matrix

    3.7. Value Chain Analysis

        3.7.1. Profit Margin Analysis

        3.7.2. Wholesalers and Distributors

        3.7.3. Retailers

    3.8. PESTLE and Porter’s Analysis

    3.9. Regulatory Landscape

        3.9.1. By Key Regions

        3.9.2. By Key Countries

    3.10. Regional Parent Market Outlook

    3.11. Production and Consumption Statistics

    3.12. Import and Export Statistics

4. Global Reduced Lactose Whey Market Analysis 2017-2021 and Forecast, 2022-2032

    4.1. Historical Market Size Value (US$ Mn) & Volume (Tons) Analysis, 2017-2021

    4.2. Current and Future Market Size Value (US$ Mn) & Volume (Tons) Projections, 2022-2032

        4.2.1. Y-o-Y Growth Trend Analysis

        4.2.2. Absolute $ Opportunity Analysis

5. Global Reduced Lactose Whey Market Analysis 2017-2021 and Forecast 2022-2032, By Nature

    5.1. Introduction / Key Findings

    5.2. Historical Market Size Value (US$ Mn) & Volume (Tons) Analysis By Nature, 2017-2021

    5.3. Current and Future Market Size Value (US$ Mn) & Volume (Tons) Analysis and Forecast By Nature, 2022-2032

        5.3.1. Organic

        5.3.2. Conventional

    5.4. Y-o-Y Growth Trend Analysis By Nature, 2017-2021

    5.5. Absolute $ Opportunity Analysis By Nature, 2022-2032

6. Global Reduced Lactose Whey Market Analysis 2017-2021 and Forecast 2022-2032, By Extraction

    6.1. Introduction / Key Findings

    6.2. Historical Market Size Value (US$ Mn) & Volume (Tons) Analysis By Extraction, 2017-2021

    6.3. Current and Future Market Size Value (US$ Mn) & Volume (Tons) Analysis and Forecast By Extraction, 2022-2032

        6.3.1. Precipitation

        6.3.2. Filtration

        6.3.3. Dialysis

    6.4. Y-o-Y Growth Trend Analysis By Extraction, 2017-2021

    6.5. Absolute $ Opportunity Analysis By Extraction, 2022-2032

7. Global Reduced Lactose Whey Market Analysis 2017-2021 and Forecast 2022-2032, By End Use

    7.1. Introduction / Key Findings

    7.2. Historical Market Size Value (US$ Mn) & Volume (Tons) Analysis By End Use, 2017-2021

    7.3. Current and Future Market Size Value (US$ Mn) & Volume (Tons) Analysis and Forecast By End Use, 2022-2032

        7.3.1. Food and Beverages

            7.3.1.1. Food Service (HoReCa)

            7.3.1.2. Dairy products

            7.3.1.3. Food Processing

            7.3.1.4. Bakery Products

            7.3.1.5. Soups and Sauces

            7.3.1.6. Frozen Foods

            7.3.1.7. Meat processing

            7.3.1.8. Infant food

            7.3.1.9. Beverage processing

            7.3.1.10. Others

        7.3.2. Nutraceuticals

        7.3.3. Household/Retail

    7.4. Y-o-Y Growth Trend Analysis By End Use, 2017-2021

    7.5. Absolute $ Opportunity Analysis By End Use, 2022-2032

8. Global Reduced Lactose Whey Market Analysis 2017-2021 and Forecast 2022-2032, By Distribution Channel

    8.1. Introduction / Key Findings

    8.2. Historical Market Size Value (US$ Mn) & Volume (Tons) Analysis By Distribution Channel, 2017-2021

    8.3. Current and Future Market Size Value (US$ Mn) & Volume (Tons) Analysis and Forecast By Distribution Channel, 2022-2032

        8.3.1. Direct Sales

        8.3.2. Indirect Sales

            8.3.2.1. Supermarkets/Hypermarkets

            8.3.2.2. Specialty Stores

            8.3.2.3. e-Retail

    8.4. Y-o-Y Growth Trend Analysis By Distribution Channel, 2017-2021

    8.5. Absolute $ Opportunity Analysis By Distribution Channel, 2022-2032

9. Global Reduced Lactose Whey Market Analysis 2017-2021 and Forecast 2022-2032, By Region

    9.1. Introduction

    9.2. Historical Market Size Value (US$ Mn) & Volume (Tons) Analysis By Region, 2017-2021

    9.3. Current Market Size Value (US$ Mn) & Volume (Tons) Analysis and Forecast By Region, 2022-2032

        9.3.1. North America

        9.3.2. Latin America

        9.3.3. Europe

        9.3.4. Asia Pacific

        9.3.5. MEA

    9.4. Market Attractiveness Analysis By Region

10. North America Reduced Lactose Whey Market Analysis 2017-2021 and Forecast 2022-2032, By Country

    10.1. Historical Market Size Value (US$ Mn) & Volume (Tons) Trend Analysis By Market Taxonomy, 2017-2021

    10.2. Market Size Value (US$ Mn) & Volume (Tons) Forecast By Market Taxonomy, 2022-2032

        10.2.1. By Country

            10.2.1.1. U.S.

            10.2.1.2. Canada

        10.2.2. By Nature

        10.2.3. By Extraction

        10.2.4. By End Use

        10.2.5. By Distribution Channel

    10.3. Market Attractiveness Analysis

        10.3.1. By Country

        10.3.2. By Nature

        10.3.3. By Extraction

        10.3.4. By End Use

        10.3.5. By Distribution Channel

    10.4. Key Takeaways

11. Latin America Reduced Lactose Whey Market Analysis 2017-2021 and Forecast 2022-2032, By Country

    11.1. Historical Market Size Value (US$ Mn) & Volume (Tons) Trend Analysis By Market Taxonomy, 2017-2021

    11.2. Market Size Value (US$ Mn) & Volume (Tons) Forecast By Market Taxonomy, 2022-2032

        11.2.1. By Country

            11.2.1.1. Brazil

            11.2.1.2. Mexico

            11.2.1.3. Rest of Latin America

        11.2.2. By Nature

        11.2.3. By Extraction

        11.2.4. By End Use

        11.2.5. By Distribution Channel

    11.3. Market Attractiveness Analysis

        11.3.1. By Country

        11.3.2. By Nature

        11.3.3. By Extraction

        11.3.4. By End Use

        11.3.5. By Distribution Channel

    11.4. Key Takeaways

12. Europe Reduced Lactose Whey Market Analysis 2017-2021 and Forecast 2022-2032, By Country

    12.1. Historical Market Size Value (US$ Mn) & Volume (Tons) Trend Analysis By Market Taxonomy, 2017-2021

    12.2. Market Size Value (US$ Mn) & Volume (Tons) Forecast By Market Taxonomy, 2022-2032

        12.2.1. By Country

            12.2.1.1. Germany

            12.2.1.2. U.K.

            12.2.1.3. France

            12.2.1.4. Spain

            12.2.1.5. Italy

            12.2.1.6. Rest of Europe

        12.2.2. By Nature

        12.2.3. By Extraction

        12.2.4. By End Use

        12.2.5. By Distribution Channel

    12.3. Market Attractiveness Analysis

        12.3.1. By Country

        12.3.2. By Nature

        12.3.3. By Extraction

        12.3.4. By End Use

        12.3.5. By Distribution Channel

    12.4. Key Takeaways

13. Asia Pacific Reduced Lactose Whey Market Analysis 2017-2021 and Forecast 2022-2032, By Country

    13.1. Historical Market Size Value (US$ Mn) & Volume (Tons) Trend Analysis By Market Taxonomy, 2017-2021

    13.2. Market Size Value (US$ Mn) & Volume (Tons) Forecast By Market Taxonomy, 2022-2032

        13.2.1. By Country

            13.2.1.1. China

            13.2.1.2. Japan

            13.2.1.3. South Korea

            13.2.1.4. Malaysia

            13.2.1.5. Singapore

            13.2.1.6. Australia

            13.2.1.7. New Zealand

            13.2.1.8. Rest of APAC

        13.2.2. By Nature

        13.2.3. By Extraction

        13.2.4. By End Use

        13.2.5. By Distribution Channel

    13.3. Market Attractiveness Analysis

        13.3.1. By Country

        13.3.2. By Nature

        13.3.3. By Extraction

        13.3.4. By End Use

        13.3.5. By Distribution Channel

    13.4. Key Takeaways

14. MEA Reduced Lactose Whey Market Analysis 2017-2021 and Forecast 2022-2032, By Country

    14.1. Historical Market Size Value (US$ Mn) & Volume (Tons) Trend Analysis By Market Taxonomy, 2017-2021

    14.2. Market Size Value (US$ Mn) & Volume (Tons) Forecast By Market Taxonomy, 2022-2032

        14.2.1. By Country

            14.2.1.1. GCC Countries

            14.2.1.2. South Africa

            14.2.1.3. Israel

            14.2.1.4. Rest of MEA

        14.2.2. By Nature

        14.2.3. By Extraction

        14.2.4. By End Use

        14.2.5. By Distribution Channel

    14.3. Market Attractiveness Analysis

        14.3.1. By Country

        14.3.2. By Nature

        14.3.3. By Extraction

        14.3.4. By End Use

        14.3.5. By Distribution Channel

    14.4. Key Takeaways

15. Key Countries Reduced Lactose Whey Market Analysis

    15.1. U.S.

        15.1.1. Pricing Analysis

        15.1.2. Market Share Analysis, 2021

            15.1.2.1. By Nature

            15.1.2.2. By Extraction

            15.1.2.3. By End Use

            15.1.2.4. By Distribution Channel

    15.2. Canada

        15.2.1. Pricing Analysis

        15.2.2. Market Share Analysis, 2021

            15.2.2.1. By Nature

            15.2.2.2. By Extraction

            15.2.2.3. By End Use

            15.2.2.4. By Distribution Channel

    15.3. Brazil

        15.3.1. Pricing Analysis

        15.3.2. Market Share Analysis, 2021

            15.3.2.1. By Nature

            15.3.2.2. By Extraction

            15.3.2.3. By End Use

            15.3.2.4. By Distribution Channel

    15.4. Mexico

        15.4.1. Pricing Analysis

        15.4.2. Market Share Analysis, 2021

            15.4.2.1. By Nature

            15.4.2.2. By Extraction

            15.4.2.3. By End Use

            15.4.2.4. By Distribution Channel

    15.5. Germany

        15.5.1. Pricing Analysis

        15.5.2. Market Share Analysis, 2021

            15.5.2.1. By Nature

            15.5.2.2. By Extraction

            15.5.2.3. By End Use

            15.5.2.4. By Distribution Channel

    15.6. U.K.

        15.6.1. Pricing Analysis

        15.6.2. Market Share Analysis, 2021

            15.6.2.1. By Nature

            15.6.2.2. By Extraction

            15.6.2.3. By End Use

            15.6.2.4. By Distribution Channel

    15.7. France

        15.7.1. Pricing Analysis

        15.7.2. Market Share Analysis, 2021

            15.7.2.1. By Nature

            15.7.2.2. By Extraction

            15.7.2.3. By End Use

            15.7.2.4. By Distribution Channel

    15.8. Spain

        15.8.1. Pricing Analysis

        15.8.2. Market Share Analysis, 2021

            15.8.2.1. By Nature

            15.8.2.2. By Extraction

            15.8.2.3. By End Use

            15.8.2.4. By Distribution Channel

    15.9. Italy

        15.9.1. Pricing Analysis

        15.9.2. Market Share Analysis, 2021

            15.9.2.1. By Nature

            15.9.2.2. By Extraction

            15.9.2.3. By End Use

            15.9.2.4. By Distribution Channel

    15.10. China

        15.10.1. Pricing Analysis

        15.10.2. Market Share Analysis, 2021

            15.10.2.1. By Nature

            15.10.2.2. By Extraction

            15.10.2.3. By End Use

            15.10.2.4. By Distribution Channel

    15.11. Japan

        15.11.1. Pricing Analysis

        15.11.2. Market Share Analysis, 2021

            15.11.2.1. By Nature

            15.11.2.2. By Extraction

            15.11.2.3. By End Use

            15.11.2.4. By Distribution Channel

    15.12. South Korea

        15.12.1. Pricing Analysis

        15.12.2. Market Share Analysis, 2021

            15.12.2.1. By Nature

            15.12.2.2. By Extraction

            15.12.2.3. By End Use

            15.12.2.4. By Distribution Channel

    15.13. Malaysia

        15.13.1. Pricing Analysis

        15.13.2. Market Share Analysis, 2021

            15.13.2.1. By Nature

            15.13.2.2. By Extraction

            15.13.2.3. By End Use

            15.13.2.4. By Distribution Channel

    15.14. Singapore

        15.14.1. Pricing Analysis

        15.14.2. Market Share Analysis, 2021

            15.14.2.1. By Nature

            15.14.2.2. By Extraction

            15.14.2.3. By End Use

            15.14.2.4. By Distribution Channel

    15.15. Australia

        15.15.1. Pricing Analysis

        15.15.2. Market Share Analysis, 2021

            15.15.2.1. By Nature

            15.15.2.2. By Extraction

            15.15.2.3. By End Use

            15.15.2.4. By Distribution Channel

    15.16. New Zealand

        15.16.1. Pricing Analysis

        15.16.2. Market Share Analysis, 2021

            15.16.2.1. By Nature

            15.16.2.2. By Extraction

            15.16.2.3. By End Use

            15.16.2.4. By Distribution Channel

    15.17. GCC Countries

        15.17.1. Pricing Analysis

        15.17.2. Market Share Analysis, 2021

            15.17.2.1. By Nature

            15.17.2.2. By Extraction

            15.17.2.3. By End Use

            15.17.2.4. By Distribution Channel

    15.18. South Africa

        15.18.1. Pricing Analysis

        15.18.2. Market Share Analysis, 2021

            15.18.2.1. By Nature

            15.18.2.2. By Extraction

            15.18.2.3. By End Use

            15.18.2.4. By Distribution Channel

    15.19. Israel

        15.19.1. Pricing Analysis

        15.19.2. Market Share Analysis, 2021

            15.19.2.1. By Nature

            15.19.2.2. By Extraction

            15.19.2.3. By End Use

            15.19.2.4. By Distribution Channel

16. Market Structure Analysis

    16.1. Competition Dashboard

    16.2. Competition Benchmarking

    16.3. Market Share Analysis of Top Players

        16.3.1. By Regional

        16.3.2. By Nature

        16.3.3. By Extraction

        16.3.4. By End Use

        16.3.5. By Distribution Channel

17. Competition Analysis

    17.1. Competition Deep Dive

        17.1.1. Wapsie Valley Creamery

            17.1.1.1. Overview

            17.1.1.2. Product Portfolio

            17.1.1.3. Profitability by Market Segments

            17.1.1.4. Sales Footprint

            17.1.1.5. Strategy Overview

                17.1.1.5.1. Marketing Strategy

                17.1.1.5.2. Product Strategy

                17.1.1.5.3. Channel Strategy

        17.1.2. Hilmar Cheese Company, Inc.

            17.1.2.1. Overview

            17.1.2.2. Product Portfolio

            17.1.2.3. Profitability by Market Segments

            17.1.2.4. Sales Footprint

            17.1.2.5. Strategy Overview

                17.1.2.5.1. Marketing Strategy

                17.1.2.5.2. Product Strategy

                17.1.2.5.3. Channel Strategy

        17.1.3. MCT Dairies Inc.

            17.1.3.1. Overview

            17.1.3.2. Product Portfolio

            17.1.3.3. Profitability by Market Segments

            17.1.3.4. Sales Footprint

            17.1.3.5. Strategy Overview

                17.1.3.5.1. Marketing Strategy

                17.1.3.5.2. Product Strategy

                17.1.3.5.3. Channel Strategy

        17.1.4. G&R Foods Inc.

            17.1.4.1. Overview

            17.1.4.2. Product Portfolio

            17.1.4.3. Profitability by Market Segments

            17.1.4.4. Sales Footprint

            17.1.4.5. Strategy Overview

                17.1.4.5.1. Marketing Strategy

                17.1.4.5.2. Product Strategy

                17.1.4.5.3. Channel Strategy

        17.1.5. HoogwegtGroep B.V.

            17.1.5.1. Overview

            17.1.5.2. Product Portfolio

            17.1.5.3. Profitability by Market Segments

            17.1.5.4. Sales Footprint

            17.1.5.5. Strategy Overview

                17.1.5.5.1. Marketing Strategy

                17.1.5.5.2. Product Strategy

                17.1.5.5.3. Channel Strategy

        17.1.6. Grande Cheese Company

            17.1.6.1. Overview

            17.1.6.2. Product Portfolio

            17.1.6.3. Profitability by Market Segments

            17.1.6.4. Sales Footprint

            17.1.6.5. Strategy Overview

                17.1.6.5.1. Marketing Strategy

                17.1.6.5.2. Product Strategy

                17.1.6.5.3. Channel Strategy

        17.1.7. Agropur Inc.

            17.1.7.1. Overview

            17.1.7.2. Product Portfolio

            17.1.7.3. Profitability by Market Segments

            17.1.7.4. Sales Footprint

            17.1.7.5. Strategy Overview

                17.1.7.5.1. Marketing Strategy

                17.1.7.5.2. Product Strategy

                17.1.7.5.3. Channel Strategy

        17.1.8. Graham Chemical Corporation

            17.1.8.1. Overview

            17.1.8.2. Product Portfolio

            17.1.8.3. Profitability by Market Segments

            17.1.8.4. Sales Footprint

            17.1.8.5. Strategy Overview

                17.1.8.5.1. Marketing Strategy

                17.1.8.5.2. Product Strategy

                17.1.8.5.3. Channel Strategy

        17.1.9. Fonterra Inc.

            17.1.9.1. Overview

            17.1.9.2. Product Portfolio

            17.1.9.3. Profitability by Market Segments

            17.1.9.4. Sales Footprint

            17.1.9.5. Strategy Overview

                17.1.9.5.1. Marketing Strategy

                17.1.9.5.2. Product Strategy

                17.1.9.5.3. Channel Strategy

        17.1.10. Interfood Inc.

            17.1.10.1. Overview

            17.1.10.2. Product Portfolio

            17.1.10.3. Profitability by Market Segments

            17.1.10.4. Sales Footprint

            17.1.10.5. Strategy Overview

                17.1.10.5.1. Marketing Strategy

                17.1.10.5.2. Product Strategy

                17.1.10.5.3. Channel Strategy

        17.1.11. Leprino Foods Company

            17.1.11.1. Overview

            17.1.11.2. Product Portfolio

            17.1.11.3. Profitability by Market Segments

            17.1.11.4. Sales Footprint

            17.1.11.5. Strategy Overview

                17.1.11.5.1. Marketing Strategy

                17.1.11.5.2. Product Strategy

                17.1.11.5.3. Channel Strategy

        17.1.12. AMCO Proteins

            17.1.12.1. Overview

            17.1.12.2. Product Portfolio

            17.1.12.3. Profitability by Market Segments

            17.1.12.4. Sales Footprint

            17.1.12.5. Strategy Overview

                17.1.12.5.1. Marketing Strategy

                17.1.12.5.2. Product Strategy

                17.1.12.5.3. Channel Strategy

18. Assumptions & Acronyms Used

19. Research Methodology

Recommendations

Food and Beverage

Lactose Free Dairy Product Market

March 2024

REP-GB-2507

306 pages

Food and Beverage

Lactose-free Products Market

July 2023

REP-GB-15047

306 pages

Food and Beverage

Lactose-Free Butter Market

May 2023

REP-GB-10744

315 pages

Explore Food and Beverage Insights

View Reports
Future Market Insights

Reduced Lactose Whey Market

Schedule a Call