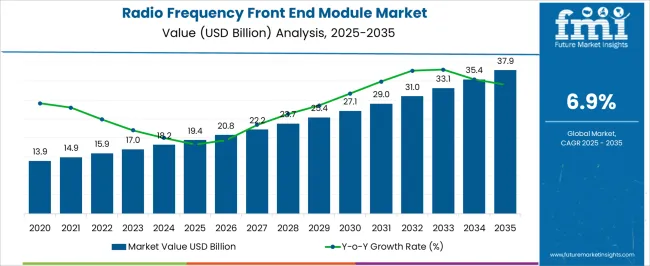
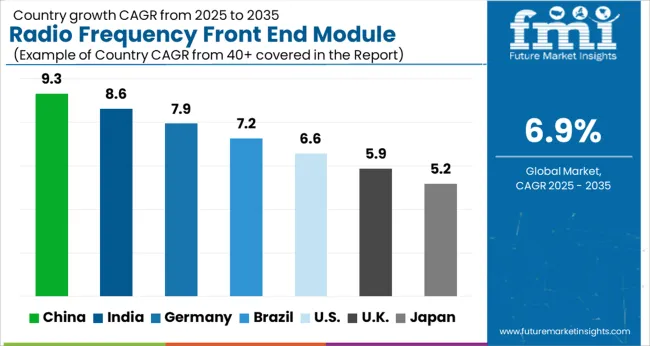
The Radio Frequency Front End Module Market is estimated to be valued at USD 19.4 billion in 2025 and is projected to reach USD 37.9 billion by 2035, registering a compound annual growth rate (CAGR) of 6.9% over the forecast period.
| Metric | Value |
|---|---|
| Radio Frequency Front End Module Market Estimated Value in (2025 E) | USD 19.4 billion |
| Radio Frequency Front End Module Market Forecast Value in (2035 F) | USD 37.9 billion |
| Forecast CAGR (2025 to 2035) | 6.9% |
The radio frequency front end module market is expanding rapidly due to rising demand for high speed wireless connectivity, growth of 5G infrastructure, and proliferation of smart devices across consumer and industrial applications. The surge in data intensive services, IoT adoption, and connected ecosystems is increasing the reliance on advanced RF components to ensure low latency and high performance communication.
Continuous innovations in miniaturization, integration of multiple components into single modules, and energy efficient designs are accelerating market adoption. Regulatory support for spectrum allocation and investment in next generation communication technologies are reinforcing growth opportunities.
The market outlook remains optimistic as emerging applications in automotive electronics, defense, and industrial automation further drive the need for robust and scalable RF front end solutions.
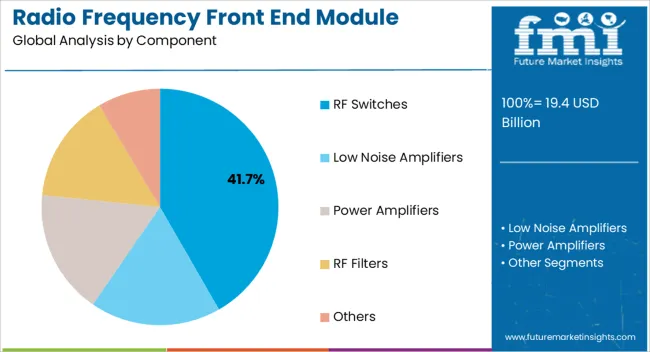
The RF switches segment is anticipated to hold 41.70% of total market revenue by 2025 within the component category, making it the dominant sub segment. This leadership is driven by the ability of RF switches to enable efficient signal routing, support multi band operation, and reduce insertion loss in complex communication systems.
Their versatility in managing high frequency signals across multiple paths has been central to their adoption in smartphones, base stations, and wireless infrastructure.
As the demand for advanced connectivity solutions continues to rise, RF switches remain indispensable for optimizing performance and ensuring seamless connectivity across multiple devices and platforms.
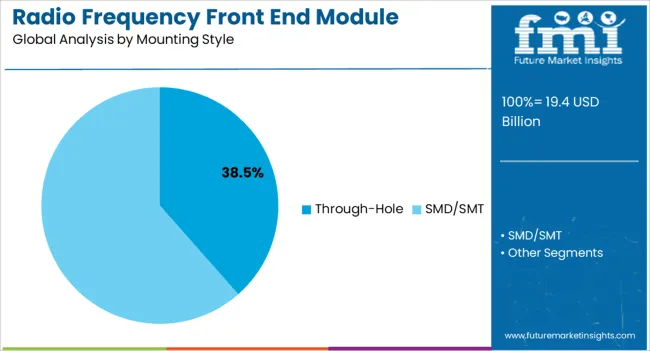
The through hole mounting style segment is projected to contribute 38.50% of total revenue by 2025 under the mounting style category, positioning it as the leading sub segment. This dominance is attributed to the robust mechanical strength, reliability, and durability offered by through hole technology, particularly in applications requiring stability under high stress conditions.
Its continued use in military, aerospace, and automotive sectors underscores its importance where vibration resistance and long term performance are critical.
While surface mount technology has grown, the enduring relevance of through hole mounting in high reliability applications has secured its leading market share.
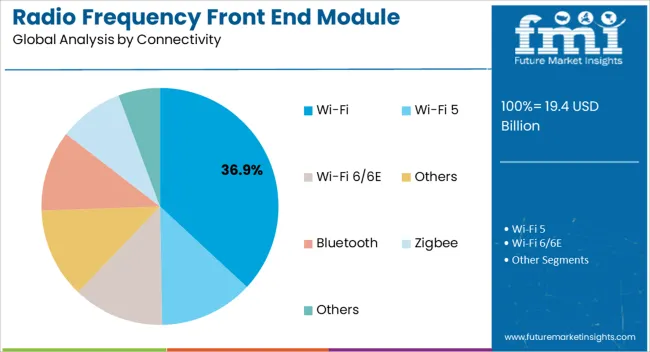
The Wi Fi connectivity segment is expected to account for 36.90% of total market revenue by 2025 within the connectivity category, making it the most prominent sub segment. This growth is being fueled by the widespread penetration of Wi Fi enabled devices, increasing smart home adoption, and expansion of enterprise wireless networks.
Enhanced demand for high speed broadband access and low latency communication is reinforcing the importance of Wi Fi integration in RF front end modules.
Continuous upgrades in Wi Fi standards, including Wi Fi 6 and beyond, are further propelling adoption, cementing its position as the leading connectivity sub segment in the market.
Rapid growth of wireless communication
Increasing demand for seamless connectivity in various sectors, including telecommunications, automotive, IoT, and consumer electronics, is driving the Radio frequency (RF) front end module industry.
Evolution of 5G networks
The deployment of 5G technology necessitates advanced Radio frequency (RF) front end modules to support higher data speeds, low latency, and enhanced network capacity.
Rising Internet of Things (IoT)
The proliferation of IoT devices and applications is fueling the demand for robust Radio frequency (RF) front end modules to enable efficient wireless communication and connectivity.
Complex design and integration
Developing Radio frequency (RF) front end modules with compact form factors, optimized power consumption, and high performance poses significant challenges for manufacturers.
Spectrum congestion and interference
As the number of wireless devices increases, managing spectrum congestion and minimizing interference become crucial to ensure reliable communication.
Cost and time-to-market pressures:
Companies face the challenge of delivering cost-effective solutions within shorter development cycles to meet market demands and stay competitive.
5G infrastructure development
Investing in the development of 5G network infrastructure, including Radio frequency (RF) front end modules, presents opportunities for companies to capitalize on the growth of the telecommunications industry.
IoT connectivity solutions
With the rapid expansion of IoT devices and applications, investing in innovative Radio frequency (RF) front end modules that facilitate seamless connectivity and optimized performance in IoT ecosystems can be a lucrative opportunity.
Market expansion in emerging economies
Exploring untapped markets in emerging economies, where the demand for wireless communication and IoT devices is growing, offers investment prospects for Radio frequency (RF) front end module manufacturers.
Integration of multiple wireless technologies
Radio frequency (RF) front end modules are evolving to support multiple wireless standards, such as 5G, Wi-Fi, Bluetooth, and NFC, in a single module, enabling seamless connectivity across various platforms.
Miniaturization and advancements in packaging
The industry is witnessing a trend towards smaller, more compact Radio frequency (RF) front end modules with enhanced integration capabilities, enabling their integration into a wide range of devices and applications.
Advancements in RF filtering and power management
Developments in RF filtering technologies and power management techniques are optimizing the performance and efficiency of Radio frequency (RF) front end modules, contributing to improved signal quality and power consumption.
The demand for radio frequency (RF) front end modules expanded at a CAGR of 10.4% from 2020 to 2025, reaching USD 19.4 billion in market value in 2025. From 2020 to 2025, the global radio frequency (RF) front end module market experienced substantial growth. This period witnessed a surge in demand fueled by the widespread adoption of wireless communication technologies and the emergence of advanced networks like 4G LTE. The industry flourished as smartphones, IoT devices, and automotive applications became more prevalent.
The deployment of 5G networks further propelled the market, driving the development of advanced RF front end modules capable of handling higher frequencies and improved efficiency. Technological advancements and increasing user expectations shaped the historical outlook, setting the stage for a dynamic and promising future.
From 2025 to 2020.4, the global radio frequency (RF) front end module industry is anticipated to expand at a CAGR of 6.9%. The market size is anticipated to reach USD 19.4 billion during the projected period. Looking ahead to 2025 to 2020.4, the radio frequency (RF) front end module industry is poised for continued growth and innovation. The rise of 5G networks is likely to drive the demand for advanced modules, supporting higher data speeds, low latency, and increased network capacity. The industry is anticipated to witness significant advancements in integration capabilities, miniaturization, and power efficiency.
Manufacturers are likely to focus on developing compact modules that seamlessly integrate multiple wireless technologies to meet the demands of multi-band and multi-mode devices. The expanding Internet of Things (IoT) ecosystem is projected to further fuel market growth, requiring specialized modules optimized for efficient IoT connectivity. Research and development investments are likely to drive progress, enabling the industry to thrive in a rapidly evolving wireless landscape.
| Attribute | Details |
|---|---|
| Country | United States |
| Market Size (USD million) by End of Forecast Period (2035) | USD 37.9 billion |
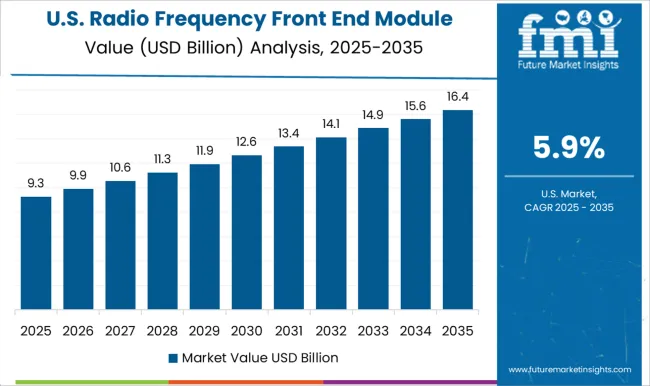
| CAGR % 2025 to End of Forecast (2035) | 6.2% |
Ongoing Development of Mobile Computing Devices in the United States to Push Sales
The United States RF front end module market is expected to be valued at USD 37.9 billion by 2035 and exhibit a CAGR of 6.2% in the estimated time frame. It is projected to create an absolute dollar opportunity of USD 2.5 billion in the next ten years.
For instance, in December 2025, Skyworks Technologies, a California-based semiconductor company, announced its partnership with Broadcom to deliver better power efficiency for advanced Wi-Fi 6/6E devices. This Wi-Fi 6/6E is expected to capture more than 80% of the Wi-Fi market by 2025. Similar advancements by leading companies would propel sales in the United States.
| Attribute | Details |
|---|---|
| Country | United Kingdom |
| Market Size (USD million) by End of Forecast Period (2035) | USD 843.0 million |
| CAGR % 2025 to End of Forecast (2035) | 5.3% |
With an anticipated market size of USD 843.0 million by the end of the forecast period in 2035, the United Kingdom holds a notable value share in the global radio frequency (RF) front end module industry. The United Kingdom market is projected to witness a CAGR of 5.3% from 2025 to 2035. This growth trajectory, combined with the region's unique trends and favorable market conditions, positions the United Kingdom as a key player in the global RF front end module industry.
The United Kingdom boasts a thriving technology and innovation ecosystem, which fosters the development of cutting-edge RF front end modules. The region's strong focus on research and development drives technological advancements, allowing companies to deliver high-quality and advanced solutions. The telecommunications sector in the United Kingdom is witnessing steady growth, driven by increasing smartphone penetration and data consumption. This surge in demand for seamless connectivity and enhanced network performance fuels the adoption of RF front end modules, leading to a substantial market share.
| Attribute | Details |
|---|---|
| Country | China |
| Market Size (USD million) by End of Forecast Period (2035) | USD 8.4 billion |
| CAGR % 2025 to End of Forecast (2035) | 8.3% |
Use of Radio Frequency Front End Modules in Power Amplifiers to Bolster Sales in China
China's radio frequency front end module market is projected to reach a valuation of USD 8.4 billion by 2035. It is set to exhibit a CAGR of 8.3% in the next ten years from the 12.6% CAGR showcased in the historical period.
In the communication sector of China, radio frequency (RF) filters are frequently employed to reduce interference from white noise during data reception and transmission over multiple channels. These filters are frequently used in applications such as radios with mid to high frequency operation, wireless communication, and television broadcasting.
To ensure suitable, error-free, and dependable communication between one end to the other, this is done. Four types of radio frequency filters are low-pass filters, band-reject, band-pass, and high-pass.
| Attribute | Details |
|---|---|
| Country | Japan |
| Market Size (USD million) by End of Forecast Period (2035) | USD 5.1 billion |
| CAGR % 2025 to End of Forecast (2035) | 7.1% |
Demand for Fast and Reliable Wireless Communication in Japan to Propel Demand by 2035
Japan is projected to create an incremental opportunity of USD 2.6 billion in the evaluation period. By 2035, it is estimated to reach a valuation of USD 5.1 billion and exhibit a CAGR of 7.1%.
Radio receivers in Japan employ radio frequency filters to filter out unwanted frequency bands and make sure that only the proper frequencies are broadcast. They play a key role in wireless technologies.
These filters are designed to work at frequencies as high as megahertz and gigahertz, among others. They are most frequently used in devices such as television, wireless communications, and broadcast radio owing to their high functionality.
| Attribute | Details |
|---|---|
| Country | South Korea |
| Market Size (USD million) by End of Forecast Period (2035) | USD 2.0 billion |
| CAGR % 2025 to End of Forecast (2035) | 7.3% |
RF Filters to Witness High Demand in South Korea Amid Launch of New Technologies
South Korea's radio frequency front end module market is expected to reach USD 2.0 billion by 2035. It witnessed a CAGR of 11.9% in the historical period from 2020 to 2025. A CAGR of 7.3% is anticipated from the country by 2035.
Leading companies in the country are anticipated to invest in the development of novel technologies to strengthen their positions. For instance, in January 2025, DB Hitek, a South Korea-based semiconductor company, announced that it planned to expand its business into radio frequency silicon on insulator (SOI) and radio frequency high resistivity substrate (HRS) processes based on 130 nm/ 110 nm technology.
Increasing Usage of Wireless Communication Devices to Augment Need for Wi-Fi Connectivity
Based on connectivity, the Wi-Fi category is estimated to dominate the global market. From 2025 to 2035, the segment is likely to register a CAGR of 6.7%, as compared to the 9.6% CAGR recorded in the historical period.
People are nowadays using mobile computing devices, which is causing an exponential rise in terms of network traffic. Internet bandwidth is being driven by the emergence of mobile devices for computing such as laptops, tablets, and smartphones with enhanced capabilities. The incorporation of cutting-edge wireless technologies such as Wi-Fi and LTE, has raised the demand for additional radio frequency features in tablets and smartphones.
The RF Switches segment reigns supreme in the radio frequency (RF) front end module industry, capturing a significant market share. With a projected CAGR of 6.8% from 2025 to 2035, this segment showcases robust growth potential. RF Switches play a critical role in signal routing and management, ensuring efficient transmission and optimal system performance.
Widely adopted across diverse industries, including telecommunications, aerospace, and consumer electronics, RF Switches meet the demands of seamless connectivity and advanced wireless technologies. Advancements in switching technologies, such as solid-state and MEMS-based switches, further strengthen the segment's dominance.
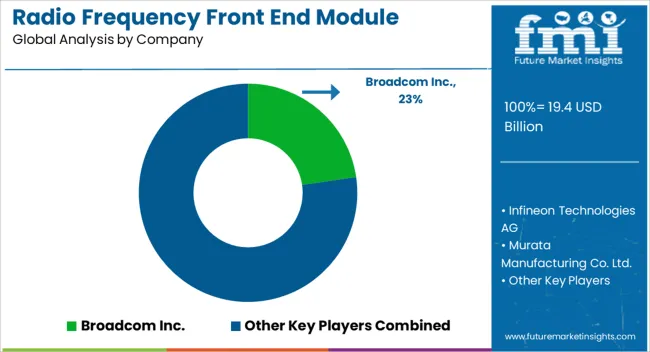
The radio frequency (RF) front end module industry is witnessing intense competition as key players vie for market leadership. Established companies are consistently implementing strategic initiatives and innovative approaches to maintain their positions at the top. By staying ahead of the curve, these industry leaders strive to solidify their market presence and capture a larger share of the growing RF front end module market.
To retain their competitive edge, key players in the RF front end module industry are heavily investing in research and development activities. They focus on developing advanced technologies and solutions that offer higher performance, increased functionality, and enhanced efficiency. By continuously innovating and introducing cutting-edge products, these companies aim to attract new customers and retain their existing client base.
Despite their market dominance, key players face several challenges within the RF front end module industry. One of the primary challenges is the rapid pace of technological advancements. As new technologies emerge, companies must adapt quickly to stay relevant and meet evolving customer demands. Additionally, the industry experiences frequent changes in regulatory standards and compliance requirements, necessitating ongoing efforts to ensure adherence and avoid any disruptions in operations.
Scaling Strategies for Manufacturer/Service Providers in Radio Frequency (RF) Front End Module Industry
| Conduct Market Research | Gain a deep understanding of the RF front end module market, including market trends, customer demands, and competitive landscape. Use this information to identify growth opportunities and align business strategies accordingly. |
|---|---|
| Develop Innovative Solutions | Invest in research and development activities to design and produce RF front end modules with advanced features, improved performance, and enhanced capabilities. Continuously innovate to stay ahead of the competition and meet evolving market needs. |
| Foster Strategic Partnerships | Collaborate with semiconductor manufacturers, technology providers, and system integrators to leverage their expertise, access new markets, and expand our customer base. Build strong alliances that complement your capabilities and drive mutual growth. |
| Expand Distribution Channels | Establish partnerships with distributors, resellers, and OEMs to enhance market reach and penetration. Utilize their existing networks to distribute and promote RF front end modules effectively, ensuring wide availability and accessibility to customers. |
| Customize Solutions for Clients | Offer tailored RF front end module solutions that address specific customer requirements. Work closely with clients to understand their needs and provide customized products and services, enhancing customer satisfaction and loyalty. |
| Strengthen Customer Support | Provide excellent customer support services, including technical assistance, troubleshooting, and after-sales support. Ensure prompt and effective communication, building strong relationships with customers and fostering long-term partnerships. |
| Invest in Manufacturing Efficiency | Implement advanced manufacturing processes, automation technologies, and quality control measures to optimize production efficiency, reduce costs, and deliver high-quality RF front end modules consistently. Continuously improve manufacturing capabilities to meet growing demand. |
| Enhance Branding and Marketing | Develop a strong brand identity and create targeted marketing campaigns to raise awareness and promote your RF front end module offerings. Highlight unique selling points, value propositions, and competitive advantages to attract customers and differentiate them from competitors. |
| Stay Abreast of Regulatory Compliance | Stay updated with industry regulations, certifications, and standards relevant to RF front end module manufacturing. Ensure compliance with safety, quality, and performance requirements to gain customer trust and confidence in your products. |
| Foster a Culture of Innovation | Encourage a culture of innovation and creativity within the organization. Foster collaboration, idea-sharing, and continuous learning to drive product advancements, and process improvements, and stay at the forefront of RF front end module technology. |
Latest Developments in the Radio Frequency (RF) Front End Module Market:
The global radio frequency front end module market is estimated to be valued at USD 19.4 billion in 2025.
The market size for the radio frequency front end module market is projected to reach USD 37.9 billion by 2035.
The radio frequency front end module market is expected to grow at a 6.9% CAGR between 2025 and 2035.
The key product types in radio frequency front end module market are rf switches, low noise amplifiers, power amplifiers, rf filters and others.
In terms of mounting style, through-hole segment to command 38.5% share in the radio frequency front end module market in 2025.


Our Research Products

The "Full Research Suite" delivers actionable market intel, deep dives on markets or technologies, so clients act faster, cut risk, and unlock growth.

The Leaderboard benchmarks and ranks top vendors, classifying them as Established Leaders, Leading Challengers, or Disruptors & Challengers.

Locates where complements amplify value and substitutes erode it, forecasting net impact by horizon

We deliver granular, decision-grade intel: market sizing, 5-year forecasts, pricing, adoption, usage, revenue, and operational KPIs—plus competitor tracking, regulation, and value chains—across 60 countries broadly.

Spot the shifts before they hit your P&L. We track inflection points, adoption curves, pricing moves, and ecosystem plays to show where demand is heading, why it is changing, and what to do next across high-growth markets and disruptive tech

Real-time reads of user behavior. We track shifting priorities, perceptions of today’s and next-gen services, and provider experience, then pace how fast tech moves from trial to adoption, blending buyer, consumer, and channel inputs with social signals (#WhySwitch, #UX).

Partner with our analyst team to build a custom report designed around your business priorities. From analysing market trends to assessing competitors or crafting bespoke datasets, we tailor insights to your needs.
Supplier Intelligence
Discovery & Profiling
Capacity & Footprint
Performance & Risk
Compliance & Governance
Commercial Readiness
Who Supplies Whom
Scorecards & Shortlists
Playbooks & Docs
Category Intelligence
Definition & Scope
Demand & Use Cases
Cost Drivers
Market Structure
Supply Chain Map
Trade & Policy
Operating Norms
Deliverables
Buyer Intelligence
Account Basics
Spend & Scope
Procurement Model
Vendor Requirements
Terms & Policies
Entry Strategy
Pain Points & Triggers
Outputs
Pricing Analysis
Benchmarks
Trends
Should-Cost
Indexation
Landed Cost
Commercial Terms
Deliverables
Brand Analysis
Positioning & Value Prop
Share & Presence
Customer Evidence
Go-to-Market
Digital & Reputation
Compliance & Trust
KPIs & Gaps
Outputs
Full Research Suite comprises of:
Market outlook & trends analysis
Interviews & case studies
Strategic recommendations
Vendor profiles & capabilities analysis
5-year forecasts
8 regions and 60+ country-level data splits
Market segment data splits
12 months of continuous data updates
DELIVERED AS:
PDF EXCEL ONLINE
Automotive Front End Module Market Growth - Trends & Forecast 2025 to 2035
Radiofrequency (RF) Ablation System Market Size and Share Forecast Outlook 2025 to 2035
Radiofrequency Balloon Catheter Market Size and Share Forecast Outlook 2025 to 2035
Radio Frequency Identification Market Size and Share Forecast Outlook 2025 to 2035
Radio Frequency Test Equipment Market Size and Share Forecast Outlook 2025 to 2035
Radio Frequency Beauty Equipment Market is segmented by product, application, technology, and end user from 2025 to 2035
Radio Frequency Integrated Circuit (RFIC) Market Analysis by Product, Application and Region Through 2035
Radio Frequency Components Market Growth – Trends & Forecast 2025 to 2035
Digital Radio Frequency Memory (DRFM) Market Size and Share Forecast Outlook 2025 to 2035
Automated Radiosynthesis Modules Market
Automotive Engine Front Module Market Size and Share Forecast Outlook 2025 to 2035
Printed Chipless RFID Radio Frequency Identification Market Size and Share Forecast Outlook 2025 to 2035
Radiopharmaceutical Dispensing System Market Size and Share Forecast Outlook 2025 to 2035
Front Office BPO Services Market Size and Share Forecast Outlook 2025 to 2035
Endometriosis Treatment Market Size and Share Forecast Outlook 2025 to 2035
Frequency Control and Timing Device Market Size and Share Forecast Outlook 2025 to 2035
Radiopharmaceutical Market Forecast and Outlook 2025 to 2035
Front Desk Uniforms Market Size and Share Forecast Outlook 2025 to 2035
End-of-line Packaging Market Size and Share Forecast Outlook 2025 to 2035
End Mill Holders Market Size and Share Forecast Outlook 2025 to 2035

Thank you!
You will receive an email from our Business Development Manager. Please be sure to check your SPAM/JUNK folder too.
Chat With
MaRIA