


qPCR Instruments Market
qPCR Instruments Market is segmented by Instrument Type (GeneXpert, QuantStudio Dx Real-Time PCR System, QuantStudio 5 Real-Time PCR System, ViiA 7 Dx, StepOne and StepOne Plus, LightCycler 2.0 and 96 and 480 and 1536, Cobas 4800, SmartCycler, Rotor Gene Q 5Plex HRM System, Others), Application (Infectious Disease Testing, Oncology Testing, Genetic Testing, Blood Screening, Others), End User (Hospitals, Diagnostic Laboratories, Research Institutes, Pharmaceutical and Biotechnology Companies), and Region. Forecast for 2026 to 2036.
Historical Data Covered: 2016 to 2024 | Base Year: 2025 | Estimated Year: 2026 | Forecast Period: 2027 to 2036
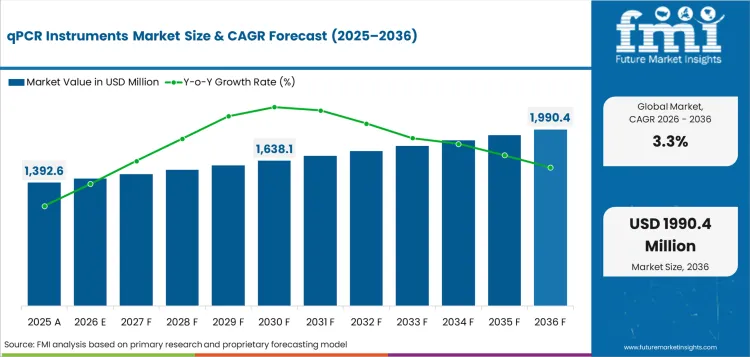
qPCR Instruments Market Size, Market Forecast and Outlook By FMI
The qpcr instruments market was valued at USD 1,392.6 million in 2025. The market is set to reach USD 1,438.6 million by 2026-end and grow at a CAGR of 3.3% between 2026-2036 to reach USD 1,990.4 million by 2036. GeneXpert will dominate with a 31.8% share, while Infectious Disease Testing will lead with a 52.4% share.
Summary of the qPCR Instruments Market
- Demand and Growth Drivers
- Aging population demographics and increasing chronic disease prevalence are expected to support sustained demand for qpcr instruments therapies across developed markets.
- Regulatory approval of new treatment options and updated clinical guidelines are likely to expand the addressable patient population during the forecast period.
- Expansion of healthcare insurance coverage and specialist care access in emerging markets is expected to create incremental demand channels.
- Product and Segment View
- GeneXpert is likely to account for 31.8% of the instrument type in 2026, supported by clinical demand and treatment protocol requirements.
- Infectious Disease Testing is expected to hold 52.4% of the application segment, reflecting clinical demand and treatment protocol requirements.
- Hospitals is expected to represent 46.9% of the end user segment, with demand shaped by established clinical infrastructure and high patient throughput in acute care settings.
- Geography and Competitive Outlook
- South Korea is likely to remain a leading market with a projected CAGR of 3.5%, supported by established end use demand and favorable policy frameworks.
- USA is expected to follow at 3.4%, reflecting growing adoption and expanding market infrastructure.
- Companies with integrated product portfolios and multi-regional distribution presence are likely to strengthen their competitive positions during the forecast period.
- Analyst Opinion
- Sabyasachi Ghosh, Principal Consultant at FMI says, 'Companies that invest in real world evidence generation and institutional procurement relationships while maintaining differentiated clinical profiles are likely to capture disproportionate market share over the forecast period.'
- The qpcr instruments market is transitioning from a volume driven market toward one shaped by clinical evidence, outcome based pricing, and regulatory access strategies.
- Adoption is being supported by expanding insurance coverage, aging demographics, and updated treatment guidelines across major markets.
- Competitive dynamics increasingly favor companies with diversified product portfolios, strong regulatory affairs capabilities, and established health economics data.
- Demand is further supported by the growing focus on personalized treatment protocols and combination therapy approaches.
qPCR Instruments Market Definition
The qpcr instruments market encompasses pharmaceutical therapies, medical devices, and clinical interventions used in the diagnosis, treatment, and management of qpcr instruments conditions. The market covers products and services delivered through hospital settings, specialty clinics, retail pharmacies, and ambulatory care centers across all major geographic regions.
qPCR Instruments Market Inclusions
Market scope encompasses all commercially traded qpcr instruments products categorized by Instrument Type (GeneXpert, QuantStudio Dx Real-Time PCR System, QuantStudio 5 Real-Time PCR System, ViiA 7 Dx, StepOne and StepOne Plus, LightCycler 2.0 and 96 and 480 and 1536, Cobas 4800, SmartCycler, Rotor Gene Q 5Plex HRM System, Others); Application (Infectious Disease Testing, Oncology Testing, Genetic Testing, Blood Screening, Others); End User (Hospitals, Diagnostic Laboratories, Research Institutes, Pharmaceutical and Biotechnology Companies); Technology (Probe Based qPCR (TaqMan), Intercalating Dye Based qPCR (SYBR Green), High Resolution Melting Analysis, Multiplex Real Time PCR); Throughput (High Throughput Systems, Mid Throughput Systems, Low Throughput Systems); Detection Channel (Singleplex qPCR Systems, Multiplex qPCR Systems, Real Time Fluorescence Detection). The revenue forecast spans 2026 to 2036.
qPCR Instruments Market Exclusions
The scope does not include over the counter wellness supplements without therapeutic claims, cosmetic dermatology procedures unrelated to qpcr instruments, or veterinary applications. Experimental therapies not yet in clinical trials are also excluded.
qPCR Instruments Market Research Methodology
- Primary Research: FMI analysts conducted interviews with clinicians, hospital procurement managers, pharmaceutical executives, and medical device distributors across key markets.
- Desk Research: Combined data from regulatory filings, clinical trial registries, health economics databases, and manufacturer disclosures.
- Market Sizing and Forecasting: Bottom up aggregation across instrument type, application, end user, technology, throughput, detection channel segments with regional adoption curves.
- Data Validation: Cross-checked quarterly against global healthcare expenditure data, regulatory approval databases, and manufacturer revenue disclosures.
Why is the qPCR Instruments Market Growing?
- Growing incidence of chronic disease in developed markets and aging population demographics are driving steady demand for qpcr instruments therapies, with treatment volumes rising in line with demographic changes.
- Regulatory approvals for new treatment options are expanding the addressable patient population, with revised clinical guidelines facilitating broader adoption across care settings.
- South Korea is leading the growth with 3.5% as healthcare infrastructure expands, insurance coverage rises and access to specialist care expands.
Reimbursement models vary a lot from market to market and have a direct impact on the rate of uptake of treatment. In the USA, the volume is driven by commercial payer formulary inclusion and Medicare coverage. In Europe, health technology assessment bodies (NICE, G-BA) control access by cost effectiveness assessments. Markets with universal coverage systems, such as Japan and South Korea, have better patient access but apply price compression via government negotiated procurement. Those companies that have shown health economics evidence and real world outcome data are better positioned to more efficiently gain formulary placement.
Speed of regulatory approvals impacts competitive dynamics. FDA fast-track pathways and EMA centralized procedures give first mover advantages to companies with advanced clinical data packages. The qPCR Instruments therapies pipeline is filled with novel molecular entities and reformulated delivery systems. Clinical adoption will depend on proven improvements in efficacy over current treatment protocols, physician familiarity with new formulations and incorporation into established treatment guidelines. Companies with strong clinical trial infrastructure and key opinion leader networks get faster uptake.
There is a clear asymmetry in pricing across treatment types. Branded drugs can be sold at a premium price in markets where there are no reference pricing constraints, while generics squeeze margins in price sensitive segments. Cost pressures are highest in public health systems with centralized procurement. Biosimilar competition is heating up and specialty pharmaceuticals are seeing their margins eroded. Those with differentiated clinical profiles and controlled distribution channels enjoy a longer pricing power than those relying on established molecules.
Market Segmentation Analysis
- The 31.8% share of instrument type by GeneXpert is indicative of established demand patterns in major markets.
- Infectious Disease Testing leads the application segment with a market share of 52.4%, owing to clinical demand and treatment protocol requirements.
- The end user segment Hospitals accounts for 46.9% of the segment and is experiencing adoption on the back of established clinical infrastructure and high patient throughput in acute care settings.
The qpcr instruments market is segmented on the basis of instrument type, application, end user, technology, throughput and detection channel. Each segment is marked by unique demand drivers, end use requirements and competitive dynamics that shape procurement patterns and growth paths.
Insights into the GeneXpert Instrument Type Segment
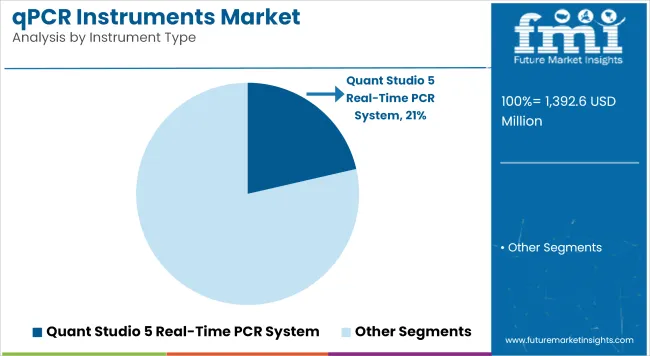
GeneXpert is anticipated to contribute 31.8% of the instrument type share in 2026. Demand is dictated by clinical demand and requirements of the treatment protocol. Other instrument type categories include QuantStudio Dx Real-Time PCR System, QuantStudio 5 Real-Time PCR System, ViiA 7 Dx, StepOne and StepOne Plus, LightCycler 2.0 and 96 and 480 and 1536, Cobas 4800, SmartCycler, Rotor Gene Q 5Plex HRM System, Others, each designed for different application needs.
This section is further divided into specialized application segments such as Cartridge Based qPCR Systems, Automated Molecular Diagnostics Systems, Clinical Diagnostic qPCR Platforms. These sub-segments are reflective of the level of product differentiation and differences in technical requirements across end use applications.
Insights into the Infectious Disease Testing Application Segment
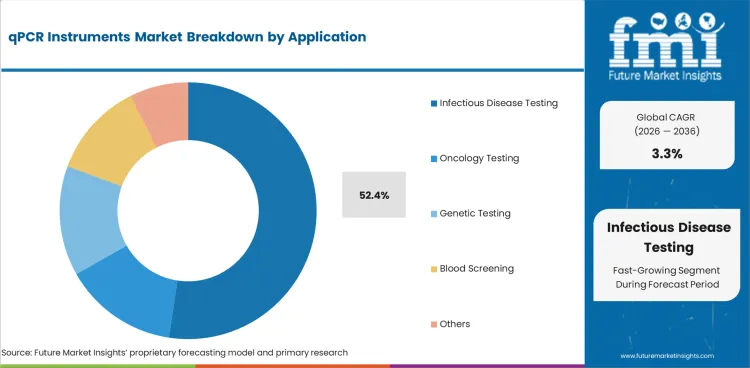
Infectious disease testing is projected to account for 52.4% of the application segment by 2026. Demand is driven by clinical demand and treatment protocol requirements. Application Types include Oncology Testing, Genetic Testing, Blood Screening, Others, catering to various application needs.
This segment includes specialized application areas and sub-categories such as Respiratory Infections, Viral Pathogen Detection and Bacterial Infections. These sub-segments depict the degree of product differentiation and the extent of technical requirements across end-use applications.
qPCR Instruments Market Drivers, Restraints, and Opportunities
- aging Population and Chronic Disease Prevalence are the major drivers for sustaining the demand for qpcr instruments products in established markets.
- cost Pressure and Generic Competition limits adoption in price sensitive segments, limiting near-term growth in emerging markets.
- Expansion is anticipated to create new demand channels in Emerging Market Healthcare Infrastructure during the forecast period.
The growth trajectory of the qpcr instruments market is defined by the interplay between demand expansion, cost pressures, and structural market changes. Adoption is driven by regulatory requirements, end-use specifications and competitive dynamics in the value chain.
Aging Population and Chronic Disease Prevalence
Demand is driven by the increasing population of elderly people in developed markets. The increasing prevalence of chronic conditions is supporting continued market growth during the forecast period, as it drives treatment volumes.
Regulatory Approvals and Clinical Guideline Updates
Growth is fueled by new product approvals and updated clinical treatment guidelines that expand the addressable patient population. Regulatory pathways in the USA, EU and Japan remain supportive of market access of new therapies.
Cost Pressure and Generic Competition
Margin compression in established therapy categories is driven by the adoption of generic alternatives and biosimilar competition. Price sensitive public healthcare systems drive substitution and limited branded revenue growth.
Expansion in Emerging Market Healthcare Infrastructure
Investment in healthcare infrastructure across South Asia, Latin America and the Middle East is creating new demand channels. This growth in volume is driven by the expansion of insurance coverage and access to specialist care in these regions..
Analysis of qPCR Instruments Market By Key Countries
.webp "Top Country Growth Comparison Qpcr Instruments Market Cagr (2026 2036)")
| Country | CAGR |
|---|---|
| South Korea | 3.5% |
| USA | 3.4% |
| EU | 3.3% |
| UK | 3.2% |
| Japan | 3.1% |
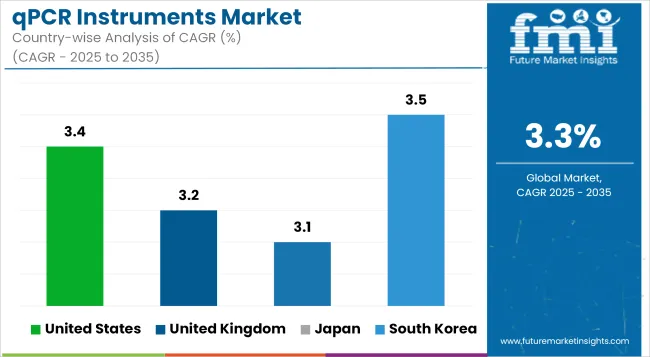
- South Korea at 3.5% reflects expanding adoption and growing market infrastructure.
- USA at 3.4% reflects established demand infrastructure and favorable policy frameworks.
- EU at 3.3% reflects harmonized regulatory frameworks and aging demographic profiles.
- UK at 3.2% reflects expanding adoption and growing market infrastructure.
The global qpcr instruments market is expected to grow at a rate of 3.3% per year from 2026 to 2036. The study covers more than 30 countries, and the main markets are listed below.
Demand Outlook for qPCR Instruments Market in South Korea
South Korea is projected to expand at 3.5% through 2036. Government investment in healthcare modernization, rising prevalence of chronic conditions, and expanding insurance coverage support adoption.
- National health insurance expansion broadens patient access to treatments.
- Rising chronic disease prevalence drives therapeutic demand growth.
- Government healthcare modernization programs support advanced treatment adoption.
Future Outlook for qPCR Instruments Market in the United States
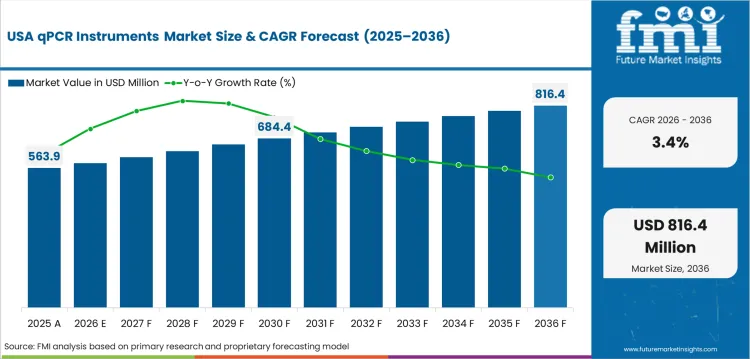
The USA is projected to expand at 3.4% through 2036. Growth reflects an aging population base, high per capita healthcare spending, and established reimbursement frameworks that support adoption of advanced treatment protocols.
- Aging demographics support sustained demand for therapeutic interventions.
- Reimbursement policies and insurance coverage facilitate treatment access.
- Clinical trial activity and regulatory approvals accelerate product availability.
Opportunity Analysis of qPCR Instruments Market in the European Union
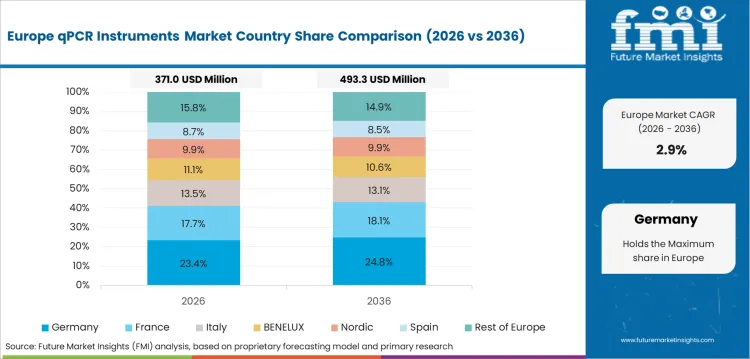
The EU is projected to expand at 3.3% through 2036. Harmonized regulatory frameworks, cross-border reimbursement initiatives, and an aging demographic profile support sustained treatment demand.
- EMA centralized approvals create a unified market access pathway.
- Aging population demographics increase patient volumes across member states.
- Healthcare infrastructure modernization supports adoption of advanced therapies.
In-depth Analysis of qPCR Instruments Market in UK
The UK is projected to grow at 3.2% through 2036. NHS procurement frameworks and NICE guidelines shape treatment adoption, with growing investment in specialized care pathways.
- NHS procurement structures create stable demand channels for approved therapies.
- NICE evaluation guidelines influence formulary inclusion and clinical adoption.
- Expanding specialist referral networks support treatment volume growth.
Sales Analysis of qPCR Instruments Market in Japan
Japan is projected to grow at 3.1% through 2036. The country's aging population, high healthcare spending per capita, and structured universal coverage system support consistent demand for therapeutic products.
- Aging demographics drive sustained growth in treatment volumes.
- Universal health coverage supports broad patient access to therapies.
- Strong pharmaceutical research infrastructure supports product development.
Competitive Landscape and Strategic Positioning
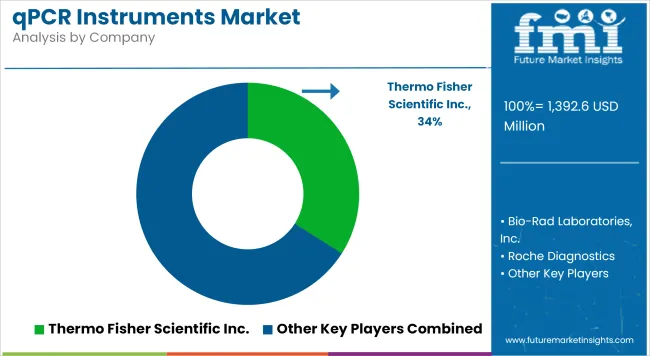
- Thermo Fisher Scientific Inc. maintains a leading position through integrated product capabilities and established distribution relationships across major markets.
- Bio-Rad Laboratories, Inc. and Roche Diagnostics offer diversified product portfolios that include both established and emerging product categories.
- Emerging players are focusing on specialized applications and differentiated product formulations to establish market presence.
Thermo Fisher Scientific Inc. holds a leading position through integrated manufacturing capabilities and established procurement relationships with major end users. The company's product portfolio spans multiple segments, providing cross selling opportunities and customer retention advantages.
Bio-Rad Laboratories, Inc. competes on product breadth and geographic reach. Roche Diagnostics focuses on technology differentiation and specialized applications. Both companies maintain established distribution networks and customer relationships across key markets.
Barriers to entry include regulatory approval requirements, manufacturing scale, established supply chain relationships, and customer switching costs. Strategic priorities among leading companies include cost optimization, geographic expansion, product portfolio diversification, and strategic partnerships.
Key Companies in the qPCR Instruments Market
Key global companies leading the qpcr instruments market include:
- Thermo Fisher Scientific Inc., Bio-Rad Laboratories, Inc., Roche Diagnostics, Agilent Technologies Inc. maintain strong manufacturing infrastructure, established end user relationships, and broad product portfolios.
- Qiagen N.V., Analytik Jena AG, Eppendorf AG have established positions through specialized product capabilities and regional distribution networks.
- Takara Bio Inc., Cepheid (Danaher Corporation), Bioer Technology Co., Ltd. are establishing market presence through differentiated product formulations and targeted application focus, demonstrating potential for future market leadership.
Competitive Benchmarking: qPCR Instruments Market
| Company | Product Portfolio Breadth | Clinical Evidence Base | Regulatory Access | Geographic Reach |
|---|---|---|---|---|
| Thermo Fisher Scientific Inc. | High | High | Strong | Global |
| Bio-Rad Laboratories, Inc. | High | Medium | Strong | Global |
| Roche Diagnostics | Medium | High | Moderate | Regional |
| Agilent Technologies Inc. | High | Medium | Strong | Global |
| Qiagen N.V. | Medium | High | Moderate | Regional |
| Analytik Jena AG | High | Medium | Moderate | Regional |
| Eppendorf AG | Medium | High | Low | Regional |
| Takara Bio Inc. | Low | High | Low | Regional |
| Cepheid (Danaher Corporation) | Medium | Medium | Low | Regional |
| Bioer Technology Co., Ltd. | Low | Low | Low | Regional |
Source: Future Market Insights competitive analysis, 2026.
Key Developments in qPCR Instruments Market
- In 2025, Thermo Fisher Scientific Inc. expanded its molecular diagnostics footprint by integrating NVIDIA-powered artificial intelligence workflows to accelerate data performance across its premium Applied Biosystems QuantStudio qPCR instrumentation lines, serving high-demand research labs in South Korea and European markets.
- In 2025, Bio-Rad Laboratories, Inc. expanded its advanced molecular testing instrument footprint through the global rollout of its newly acquired Stilla Technologies digital PCR solutions alongside the QX700 Droplet Digital PCR platform across North America and East Asia.
Key Players in the qPCR Instruments Market
Major Global Players
- Thermo Fisher Scientific Inc.
- Bio-Rad Laboratories, Inc.
- Roche Diagnostics
- Agilent Technologies Inc.
- Qiagen N.V.
- Analytik Jena AG
- Eppendorf AG
Emerging Players/Startups
- Takara Bio Inc.
- Cepheid (Danaher Corporation)
- Bioer Technology Co., Ltd.
Report Scope and Coverage
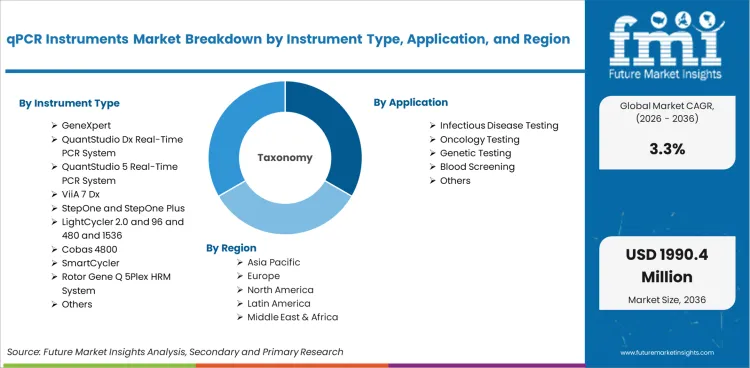
| Parameter | Details |
|---|---|
| Quantitative Units | USD 1.44 billion to USD 1.99 billion, at a CAGR of 3.3% |
| Market Definition | The qpcr instruments market encompasses pharmaceutical therapies, medical devices, and clinical interventions for qpcr instruments applications. |
| Regions Covered | North America, Latin America, Europe, East Asia, South Asia and Pacific, Middle East and Africa |
| Countries Covered | South Korea, USA, EU, UK, Japan, 30 plus countries |
| Key Companies Profiled | Thermo Fisher Scientific Inc., Bio-Rad Laboratories, Inc., Roche Diagnostics, Agilent Technologies Inc., Qiagen N.V., Analytik Jena AG, Eppendorf AG, Takara Bio Inc., Cepheid (Danaher Corporation), Bioer Technology Co., Ltd. |
| Forecast Period | 2026 to 2036 |
| Approach | Hybrid bottom-up and top-down methodology starting with verified transaction data, projecting adoption velocity across segments and regions. |
Market Segmentation Analysis
qPCR Instruments Market Segmented by Instrument Type:
- GeneXpert
- Cartridge Based qPCR Systems
- Automated Molecular Diagnostics Systems
- QuantStudio Dx Real-Time PCR System
- Clinical Diagnostic qPCR Platforms
- Regulatory Approved Systems
- QuantStudio 5 Real-Time PCR System
- Research Grade qPCR Systems
- Mid Throughput Systems
- ViiA 7 Dx
- High Throughput Clinical Systems
- StepOne and StepOne Plus
- Entry Level qPCR Systems
- LightCycler 2.0 and 96 and 480 and 1536
- High Precision Thermal Cyclers
- Cobas 4800
- Integrated Molecular Diagnostic Platforms
- SmartCycler
- Portable qPCR Systems
- Rotor Gene Q 5Plex HRM System
- High Resolution Melting Analysis Systems
- Others
qPCR Instruments Market Segmented by Application:
- Infectious Disease Testing
- Respiratory Infections
- Viral Pathogen Detection
- Bacterial Infections
- Oncology Testing
- Cancer Biomarker Detection
- Liquid Biopsy Support
- Genetic Testing
- Mutation Analysis
- SNP Genotyping
- Blood Screening
- Transfusion Safety Testing
- Others
- Research Applications
qPCR Instruments Market Segmented by End User:
- Hospitals
- Clinical Pathology Labs
- Molecular Diagnostics Labs
- Diagnostic Laboratories
- Independent Diagnostic Centers
- Reference Laboratories
- Research Institutes
- Academic Research Labs
- Government Research Centers
- Pharmaceutical and Biotechnology Companies
- Drug Development Labs
- Clinical Trial Laboratories
qPCR Instruments Market Segmented by Technology:
- Probe Based qPCR (TaqMan)
- Hydrolysis Probe Assays
- Multiplex Probe Assays
- Intercalating Dye Based qPCR (SYBR Green)
- Non-Specific DNA Binding Detection
- Cost Effective Assays
- High Resolution Melting Analysis
- Mutation Scanning Applications
- Genotyping Applications
- Multiplex Real Time PCR
- Multi Target Detection Systems
- High Throughput Assays
qPCR Instruments Market Segmented by Throughput:
- High Throughput Systems
- 384 Well Plate Systems
- 1536 Well Plate Systems
- Mid Throughput Systems
- 96 Well Plate Systems
- 48 Well Plate Systems
- Low Throughput Systems
- Portable qPCR Devices
- Single Sample Systems
qPCR Instruments Market Segmented by Detection Channel:
- Singleplex qPCR Systems
- Single Target Detection
- Basic Clinical Diagnostics
- Multiplex qPCR Systems
- Dual Target Detection
- Multi Target Panels
- Real Time Fluorescence Detection
- SYBR and Probe Based Systems
- Advanced Optical Detection Systems
qPCR Instruments Market by Region:
- North America
- USA
- Canada
- Mexico
- Latin America
- Brazil
- Chile
- Rest of Latin America
- Western Europe
- Germany
- UK
- Italy
- Spain
- France
- Nordic
- BENELUX
- Rest of Western Europe
- Eastern Europe
- Russia
- Poland
- Hungary
- Balkan & Baltic
- Rest of Eastern Europe
- East Asia
- China
- Japan
- South Korea
- South Asia and Pacific
- India
- ASEAN
- Australia & New Zealand
- Rest of South Asia and Pacific
- Middle East & Africa
- Kingdom of Saudi Arabia
- Other GCC Countries
- Turkiye
- South Africa
- Other African Union
- Rest of Middle East & Africa
Research Sources and Bibliography
- 1. World Health Organization. (2025). Global Health Expenditure Database. WHO.
- 2. USA Food and Drug Administration. (2025). FDA Drug Approval Database: Updated Requirements. FDA.
- 3. European Medicines Agency. (2025). EMA Centralized Authorization Procedures Annual Report. EMA.
- 4. National Institutes of Health. (2025). NIH Clinical Trials Registry and Results Database. NIH.
- 5. Organisation for Economic Co-operation and Development. (2025). OECD Health Statistics 2025. OECD.
This bibliography is provided for reader reference.
This Report Addresses
- Estimating the size of the market and revenue from 2026 to 2036.
- Segmentation by instrument type, application, end user, technology, throughput, detection channel.
- Insights across more than 30 country markets.
- Analysis of competitive landscape and strategic positioning.
- Assessment of market drivers, restraints, and growth opportunities.
- Investment opportunity identification across segments and regions.
- Supply chain and procurement pattern analysis.
- Delivery of data in PDF and Excel formats.
Frequently Asked Questions
What is the global market demand for qPCR Instruments Market in 2026?
In 2026, the global qpcr instruments market is expected to be worth USD 1.44 billion.
How big will the qPCR Instruments Market be in 2036?
By 2036, the qpcr instruments market is expected to be worth USD 1.99 billion.
How much is demand for qPCR Instruments Market expected to grow between 2026 and 2036?
Between 2026 and 2036, the demand for qpcr instruments market is expected to grow at a CAGR of 3.3%.
Which Instrument Type is likely to lead the qPCR Instruments Market globally by 2026?
GeneXpert is expected to account for 31.8% of the instrument type in 2026, reflecting clinical demand and treatment protocol requirements.
What is causing demand to rise in South Korea in the qPCR Instruments Market?
South Korea is projected to grow at 3.5% per year through 2036, supported by expanding market infrastructure and growing adoption.
What is causing demand to rise in USA in the qPCR Instruments Market?
USA is projected to grow at 3.4% per year through 2036, supported by growing market demand and infrastructure investment.
What does this report mean by 'qPCR Instruments Market definition'?
The qpcr instruments market includes pharmaceutical therapies, medical devices, and clinical interventions for qpcr instruments applications across all major segments and regions.
How does FMI make the qPCR Instruments Market forecast and validate it?
Forecasting models use a hybrid bottom-up and top-down approach, starting with verified transaction data and checking it against global healthcare expenditure data and manufacturer disclosures.
Table of Content
- Executive Summary
- Global Market Outlook
- Demand to side Trends
- Supply to side Trends
- Technology Roadmap Analysis
- Analysis and Recommendations
- Market Overview
- Market Coverage / Taxonomy
- Market Definition / Scope / Limitations
- Research Methodology
- Chapter Orientation
- Analytical Lens and Working Hypotheses
- Market Structure, Signals, and Trend Drivers
- Benchmarking and Cross-market Comparability
- Market Sizing, Forecasting, and Opportunity Mapping
- Research Design and Evidence Framework
- Desk Research Programme (Secondary Evidence)
- Company Annual and Sustainability Reports
- Peer-reviewed Journals and Academic Literature
- Corporate Websites, Product Literature, and Technical Notes
- Earnings Decks and Investor Briefings
- Statutory Filings and Regulatory Disclosures
- Technical White Papers and Standards Notes
- Trade Journals, Industry Magazines, and Analyst Briefs
- Conference Proceedings, Webinars, and Seminar Materials
- Government Statistics Portals and Public Data Releases
- Press Releases and Reputable Media Coverage
- Specialist Newsletters and Curated Briefings
- Sector Databases and Reference Repositories
- FMI Internal Proprietary Databases and Historical Market Datasets
- Subscription Datasets and Paid Sources
- Social Channels, Communities, and Digital Listening Inputs
- Additional Desk Sources
- Expert Input and Fieldwork (Primary Evidence)
- Primary Modes
- Qualitative Interviews and Expert Elicitation
- Quantitative Surveys and Structured Data Capture
- Blended Approach
- Why Primary Evidence is Used
- Field Techniques
- Interviews
- Surveys
- Focus Groups
- Observational and In-context Research
- Social and Community Interactions
- Stakeholder Universe Engaged
- C-suite Leaders
- Board Members
- Presidents and Vice Presidents
- R&D and Innovation Heads
- Technical Specialists
- Domain Subject-matter Experts
- Scientists
- Physicians and Other Healthcare Professionals
- Governance, Ethics, and Data Stewardship
- Research Ethics
- Data Integrity and Handling
- Primary Modes
- Tooling, Models, and Reference Databases
- Desk Research Programme (Secondary Evidence)
- Data Engineering and Model Build
- Data Acquisition and Ingestion
- Cleaning, Normalisation, and Verification
- Synthesis, Triangulation, and Analysis
- Quality Assurance and Audit Trail
- Market Background
- Market Dynamics
- Drivers
- Restraints
- Opportunity
- Trends
- Scenario Forecast
- Demand in Optimistic Scenario
- Demand in Likely Scenario
- Demand in Conservative Scenario
- Opportunity Map Analysis
- Product Life Cycle Analysis
- Supply Chain Analysis
- Investment Feasibility Matrix
- Value Chain Analysis
- PESTLE and Porter’s Analysis
- Regulatory Landscape
- Regional Parent Market Outlook
- Production and Consumption Statistics
- Import and Export Statistics
- Market Dynamics
- Global Market Analysis 2021 to 2025 and Forecast, 2026 to 2036
- Historical Market Size Value (USD Million) Analysis, 2021 to 2025
- Current and Future Market Size Value (USD Million) Projections, 2026 to 2036
- Y to o to Y Growth Trend Analysis
- Absolute $ Opportunity Analysis
- Global Market Pricing Analysis 2021 to 2025 and Forecast 2026 to 2036
- Global Market Analysis 2021 to 2025 and Forecast 2026 to 2036, By Instrument Type
- Introduction / Key Findings
- Historical Market Size Value (USD Million) Analysis By Instrument Type , 2021 to 2025
- Current and Future Market Size Value (USD Million) Analysis and Forecast By Instrument Type , 2026 to 2036
- GeneXpert
- Cartridge Based qPCR Systems
- Automated Molecular Diagnostics Systems
- QuantStudio Dx Real-Time PCR System
- Clinical Diagnostic qPCR Platforms
- Regulatory Approved Systems
- QuantStudio 5 Real-Time PCR System
- Research Grade qPCR Systems
- Mid Throughput Systems
- ViiA 7 Dx
- High Throughput Clinical Systems
- StepOne and StepOne Plus
- Entry Level qPCR Systems
- LightCycler 2.0 and 96 and 480 and 1536
- High Precision Thermal Cyclers
- Cobas 4800
- Integrated Molecular Diagnostic Platforms
- SmartCycler
- Portable qPCR Systems
- Rotor Gene Q 5Plex HRM System
- High Resolution Melting Analysis Systems
- Others
- GeneXpert
- Y to o to Y Growth Trend Analysis By Instrument Type , 2021 to 2025
- Absolute $ Opportunity Analysis By Instrument Type , 2026 to 2036
- Global Market Analysis 2021 to 2025 and Forecast 2026 to 2036, By Application
- Introduction / Key Findings
- Historical Market Size Value (USD Million) Analysis By Application, 2021 to 2025
- Current and Future Market Size Value (USD Million) Analysis and Forecast By Application, 2026 to 2036
- Infectious Disease Testing
- Respiratory Infections
- Viral Pathogen Detection
- Bacterial Infections
- Oncology Testing
- Cancer Biomarker Detection
- Liquid Biopsy Support
- Genetic Testing
- Mutation Analysis
- SNP Genotyping
- Blood Screening
- Transfusion Safety Testing
- Others
- Research Applications
- Infectious Disease Testing
- Y to o to Y Growth Trend Analysis By Application, 2021 to 2025
- Absolute $ Opportunity Analysis By Application, 2026 to 2036
- Global Market Analysis 2021 to 2025 and Forecast 2026 to 2036, By End User
- Introduction / Key Findings
- Historical Market Size Value (USD Million) Analysis By End User, 2021 to 2025
- Current and Future Market Size Value (USD Million) Analysis and Forecast By End User, 2026 to 2036
- Hospitals
- Clinical Pathology Labs
- Molecular Diagnostics Labs
- Diagnostic Laboratories
- Independent Diagnostic Centers
- Reference Laboratories
- Research Institutes
- Academic Research Labs
- Government Research Centers
- Pharmaceutical and Biotechnology Companies
- Drug Development Labs
- Clinical Trial Laboratories
- Hospitals
- Y to o to Y Growth Trend Analysis By End User, 2021 to 2025
- Absolute $ Opportunity Analysis By End User, 2026 to 2036
- Global Market Analysis 2021 to 2025 and Forecast 2026 to 2036, By Technology
- Introduction / Key Findings
- Historical Market Size Value (USD Million) Analysis By Technology, 2021 to 2025
- Current and Future Market Size Value (USD Million) Analysis and Forecast By Technology, 2026 to 2036
- Probe Based qPCR (TaqMan)
- Hydrolysis Probe Assays
- Multiplex Probe Assays
- Intercalating Dye Based qPCR (SYBR Green)
- Non-Specific DNA Binding Detection
- Cost Effective Assays
- High Resolution Melting Analysis
- Mutation Scanning Applications
- Genotyping Applications
- Multiplex Real Time PCR
- Multi Target Detection Systems
- High Throughput Assays
- Probe Based qPCR (TaqMan)
- Y to o to Y Growth Trend Analysis By Technology, 2021 to 2025
- Absolute $ Opportunity Analysis By Technology, 2026 to 2036
- Global Market Analysis 2021 to 2025 and Forecast 2026 to 2036, By Throughput
- Introduction / Key Findings
- Historical Market Size Value (USD Million) Analysis By Throughput, 2021 to 2025
- Current and Future Market Size Value (USD Million) Analysis and Forecast By Throughput, 2026 to 2036
- High Throughput Systems
- 384 Well Plate Systems
- 1536 Well Plate Systems
- Mid Throughput Systems
- 96 Well Plate Systems
- 48 Well Plate Systems
- Low Throughput Systems
- Portable qPCR Devices
- Single Sample Systems
- High Throughput Systems
- Y to o to Y Growth Trend Analysis By Throughput, 2021 to 2025
- Absolute $ Opportunity Analysis By Throughput, 2026 to 2036
- Global Market Analysis 2021 to 2025 and Forecast 2026 to 2036, By Detection Channel
- Introduction / Key Findings
- Historical Market Size Value (USD Million) Analysis By Detection Channel, 2021 to 2025
- Current and Future Market Size Value (USD Million) Analysis and Forecast By Detection Channel, 2026 to 2036
- Singleplex qPCR Systems
- Single Target Detection
- Basic Clinical Diagnostics
- Multiplex qPCR Systems
- Dual Target Detection
- Multi Target Panels
- Real Time Fluorescence Detection
- SYBR and Probe Based Systems
- Advanced Optical Detection Systems
- Singleplex qPCR Systems
- Y to o to Y Growth Trend Analysis By Detection Channel, 2021 to 2025
- Absolute $ Opportunity Analysis By Detection Channel, 2026 to 2036
- Global Market Analysis 2021 to 2025 and Forecast 2026 to 2036, By Region
- Introduction
- Historical Market Size Value (USD Million) Analysis By Region, 2021 to 2025
- Current Market Size Value (USD Million) Analysis and Forecast By Region, 2026 to 2036
- North America
- Latin America
- Western Europe
- Eastern Europe
- East Asia
- South Asia and Pacific
- Middle East & Africa
- Market Attractiveness Analysis By Region
- North America Market Analysis 2021 to 2025 and Forecast 2026 to 2036, By Country
- Historical Market Size Value (USD Million) Trend Analysis By Market Taxonomy, 2021 to 2025
- Market Size Value (USD Million) Forecast By Market Taxonomy, 2026 to 2036
- By Country
- USA
- Canada
- Mexico
- By Instrument Type
- By Application
- By End User
- By Technology
- By Throughput
- By Detection Channel
- By Country
- Market Attractiveness Analysis
- By Country
- By Instrument Type
- By Application
- By End User
- By Technology
- By Throughput
- By Detection Channel
- Key Takeaways
- Latin America Market Analysis 2021 to 2025 and Forecast 2026 to 2036, By Country
- Historical Market Size Value (USD Million) Trend Analysis By Market Taxonomy, 2021 to 2025
- Market Size Value (USD Million) Forecast By Market Taxonomy, 2026 to 2036
- By Country
- Brazil
- Chile
- Rest of Latin America
- By Instrument Type
- By Application
- By End User
- By Technology
- By Throughput
- By Detection Channel
- By Country
- Market Attractiveness Analysis
- By Country
- By Instrument Type
- By Application
- By End User
- By Technology
- By Throughput
- By Detection Channel
- Key Takeaways
- Western Europe Market Analysis 2021 to 2025 and Forecast 2026 to 2036, By Country
- Historical Market Size Value (USD Million) Trend Analysis By Market Taxonomy, 2021 to 2025
- Market Size Value (USD Million) Forecast By Market Taxonomy, 2026 to 2036
- By Country
- Germany
- UK
- Italy
- Spain
- France
- Nordic
- BENELUX
- Rest of Western Europe
- By Instrument Type
- By Application
- By End User
- By Technology
- By Throughput
- By Detection Channel
- By Country
- Market Attractiveness Analysis
- By Country
- By Instrument Type
- By Application
- By End User
- By Technology
- By Throughput
- By Detection Channel
- Key Takeaways
- Eastern Europe Market Analysis 2021 to 2025 and Forecast 2026 to 2036, By Country
- Historical Market Size Value (USD Million) Trend Analysis By Market Taxonomy, 2021 to 2025
- Market Size Value (USD Million) Forecast By Market Taxonomy, 2026 to 2036
- By Country
- Russia
- Poland
- Hungary
- Balkan & Baltic
- Rest of Eastern Europe
- By Instrument Type
- By Application
- By End User
- By Technology
- By Throughput
- By Detection Channel
- By Country
- Market Attractiveness Analysis
- By Country
- By Instrument Type
- By Application
- By End User
- By Technology
- By Throughput
- By Detection Channel
- Key Takeaways
- East Asia Market Analysis 2021 to 2025 and Forecast 2026 to 2036, By Country
- Historical Market Size Value (USD Million) Trend Analysis By Market Taxonomy, 2021 to 2025
- Market Size Value (USD Million) Forecast By Market Taxonomy, 2026 to 2036
- By Country
- China
- Japan
- South Korea
- By Instrument Type
- By Application
- By End User
- By Technology
- By Throughput
- By Detection Channel
- By Country
- Market Attractiveness Analysis
- By Country
- By Instrument Type
- By Application
- By End User
- By Technology
- By Throughput
- By Detection Channel
- Key Takeaways
- South Asia and Pacific Market Analysis 2021 to 2025 and Forecast 2026 to 2036, By Country
- Historical Market Size Value (USD Million) Trend Analysis By Market Taxonomy, 2021 to 2025
- Market Size Value (USD Million) Forecast By Market Taxonomy, 2026 to 2036
- By Country
- India
- ASEAN
- Australia & New Zealand
- Rest of South Asia and Pacific
- By Instrument Type
- By Application
- By End User
- By Technology
- By Throughput
- By Detection Channel
- By Country
- Market Attractiveness Analysis
- By Country
- By Instrument Type
- By Application
- By End User
- By Technology
- By Throughput
- By Detection Channel
- Key Takeaways
- Middle East & Africa Market Analysis 2021 to 2025 and Forecast 2026 to 2036, By Country
- Historical Market Size Value (USD Million) Trend Analysis By Market Taxonomy, 2021 to 2025
- Market Size Value (USD Million) Forecast By Market Taxonomy, 2026 to 2036
- By Country
- Kingdom of Saudi Arabia
- Other GCC Countries
- Turkiye
- South Africa
- Other African Union
- Rest of Middle East & Africa
- By Instrument Type
- By Application
- By End User
- By Technology
- By Throughput
- By Detection Channel
- By Country
- Market Attractiveness Analysis
- By Country
- By Instrument Type
- By Application
- By End User
- By Technology
- By Throughput
- By Detection Channel
- Key Takeaways
- Key Countries Market Analysis
- USA
- Pricing Analysis
- Market Share Analysis, 2025
- By Instrument Type
- By Application
- By End User
- By Technology
- By Throughput
- By Detection Channel
- Canada
- Pricing Analysis
- Market Share Analysis, 2025
- By Instrument Type
- By Application
- By End User
- By Technology
- By Throughput
- By Detection Channel
- Mexico
- Pricing Analysis
- Market Share Analysis, 2025
- By Instrument Type
- By Application
- By End User
- By Technology
- By Throughput
- By Detection Channel
- Brazil
- Pricing Analysis
- Market Share Analysis, 2025
- By Instrument Type
- By Application
- By End User
- By Technology
- By Throughput
- By Detection Channel
- Chile
- Pricing Analysis
- Market Share Analysis, 2025
- By Instrument Type
- By Application
- By End User
- By Technology
- By Throughput
- By Detection Channel
- Germany
- Pricing Analysis
- Market Share Analysis, 2025
- By Instrument Type
- By Application
- By End User
- By Technology
- By Throughput
- By Detection Channel
- UK
- Pricing Analysis
- Market Share Analysis, 2025
- By Instrument Type
- By Application
- By End User
- By Technology
- By Throughput
- By Detection Channel
- Italy
- Pricing Analysis
- Market Share Analysis, 2025
- By Instrument Type
- By Application
- By End User
- By Technology
- By Throughput
- By Detection Channel
- Spain
- Pricing Analysis
- Market Share Analysis, 2025
- By Instrument Type
- By Application
- By End User
- By Technology
- By Throughput
- By Detection Channel
- France
- Pricing Analysis
- Market Share Analysis, 2025
- By Instrument Type
- By Application
- By End User
- By Technology
- By Throughput
- By Detection Channel
- India
- Pricing Analysis
- Market Share Analysis, 2025
- By Instrument Type
- By Application
- By End User
- By Technology
- By Throughput
- By Detection Channel
- ASEAN
- Pricing Analysis
- Market Share Analysis, 2025
- By Instrument Type
- By Application
- By End User
- By Technology
- By Throughput
- By Detection Channel
- Australia & New Zealand
- Pricing Analysis
- Market Share Analysis, 2025
- By Instrument Type
- By Application
- By End User
- By Technology
- By Throughput
- By Detection Channel
- China
- Pricing Analysis
- Market Share Analysis, 2025
- By Instrument Type
- By Application
- By End User
- By Technology
- By Throughput
- By Detection Channel
- Japan
- Pricing Analysis
- Market Share Analysis, 2025
- By Instrument Type
- By Application
- By End User
- By Technology
- By Throughput
- By Detection Channel
- South Korea
- Pricing Analysis
- Market Share Analysis, 2025
- By Instrument Type
- By Application
- By End User
- By Technology
- By Throughput
- By Detection Channel
- Russia
- Pricing Analysis
- Market Share Analysis, 2025
- By Instrument Type
- By Application
- By End User
- By Technology
- By Throughput
- By Detection Channel
- Poland
- Pricing Analysis
- Market Share Analysis, 2025
- By Instrument Type
- By Application
- By End User
- By Technology
- By Throughput
- By Detection Channel
- Hungary
- Pricing Analysis
- Market Share Analysis, 2025
- By Instrument Type
- By Application
- By End User
- By Technology
- By Throughput
- By Detection Channel
- Kingdom of Saudi Arabia
- Pricing Analysis
- Market Share Analysis, 2025
- By Instrument Type
- By Application
- By End User
- By Technology
- By Throughput
- By Detection Channel
- Turkiye
- Pricing Analysis
- Market Share Analysis, 2025
- By Instrument Type
- By Application
- By End User
- By Technology
- By Throughput
- By Detection Channel
- South Africa
- Pricing Analysis
- Market Share Analysis, 2025
- By Instrument Type
- By Application
- By End User
- By Technology
- By Throughput
- By Detection Channel
- USA
- Market Structure Analysis
- Competition Dashboard
- Competition Benchmarking
- Market Share Analysis of Top Players
- By Regional
- By Instrument Type
- By Application
- By End User
- By Technology
- By Throughput
- By Detection Channel
- Competition Analysis
- Competition Deep Dive
- Thermo Fisher Scientific Inc.
- Overview
- Product Portfolio
- Profitability by Market Segments (Product/Age /Sales Channel/Region)
- Sales Footprint
- Strategy Overview
- Marketing Strategy
- Product Strategy
- Channel Strategy
- Bio-Rad Laboratories, Inc.
- Roche Diagnostics
- Agilent Technologies Inc.
- Qiagen N.V.
- Analytik Jena AG
- Eppendorf AG
- Takara Bio Inc.
- Cepheid (Danaher Corporation)
- Bioer Technology Co., Ltd.
- Thermo Fisher Scientific Inc.
- Competition Deep Dive
- Assumptions & Acronyms Used
List of Tables
- Table 1: Global Market Value (USD Million) Forecast by Region, 2021 to 2036
- Table 2: Global Market Value (USD Million) Forecast by Instrument Type , 2021 to 2036
- Table 3: Global Market Value (USD Million) Forecast by Application, 2021 to 2036
- Table 4: Global Market Value (USD Million) Forecast by End User, 2021 to 2036
- Table 5: Global Market Value (USD Million) Forecast by Technology, 2021 to 2036
- Table 6: Global Market Value (USD Million) Forecast by Throughput, 2021 to 2036
- Table 7: Global Market Value (USD Million) Forecast by Detection Channel, 2021 to 2036
- Table 8: North America Market Value (USD Million) Forecast by Country, 2021 to 2036
- Table 9: North America Market Value (USD Million) Forecast by Instrument Type , 2021 to 2036
- Table 10: North America Market Value (USD Million) Forecast by Application, 2021 to 2036
- Table 11: North America Market Value (USD Million) Forecast by End User, 2021 to 2036
- Table 12: North America Market Value (USD Million) Forecast by Technology, 2021 to 2036
- Table 13: North America Market Value (USD Million) Forecast by Throughput, 2021 to 2036
- Table 14: North America Market Value (USD Million) Forecast by Detection Channel, 2021 to 2036
- Table 15: Latin America Market Value (USD Million) Forecast by Country, 2021 to 2036
- Table 16: Latin America Market Value (USD Million) Forecast by Instrument Type , 2021 to 2036
- Table 17: Latin America Market Value (USD Million) Forecast by Application, 2021 to 2036
- Table 18: Latin America Market Value (USD Million) Forecast by End User, 2021 to 2036
- Table 19: Latin America Market Value (USD Million) Forecast by Technology, 2021 to 2036
- Table 20: Latin America Market Value (USD Million) Forecast by Throughput, 2021 to 2036
- Table 21: Latin America Market Value (USD Million) Forecast by Detection Channel, 2021 to 2036
- Table 22: Western Europe Market Value (USD Million) Forecast by Country, 2021 to 2036
- Table 23: Western Europe Market Value (USD Million) Forecast by Instrument Type , 2021 to 2036
- Table 24: Western Europe Market Value (USD Million) Forecast by Application, 2021 to 2036
- Table 25: Western Europe Market Value (USD Million) Forecast by End User, 2021 to 2036
- Table 26: Western Europe Market Value (USD Million) Forecast by Technology, 2021 to 2036
- Table 27: Western Europe Market Value (USD Million) Forecast by Throughput, 2021 to 2036
- Table 28: Western Europe Market Value (USD Million) Forecast by Detection Channel, 2021 to 2036
- Table 29: Eastern Europe Market Value (USD Million) Forecast by Country, 2021 to 2036
- Table 30: Eastern Europe Market Value (USD Million) Forecast by Instrument Type , 2021 to 2036
- Table 31: Eastern Europe Market Value (USD Million) Forecast by Application, 2021 to 2036
- Table 32: Eastern Europe Market Value (USD Million) Forecast by End User, 2021 to 2036
- Table 33: Eastern Europe Market Value (USD Million) Forecast by Technology, 2021 to 2036
- Table 34: Eastern Europe Market Value (USD Million) Forecast by Throughput, 2021 to 2036
- Table 35: Eastern Europe Market Value (USD Million) Forecast by Detection Channel, 2021 to 2036
- Table 36: East Asia Market Value (USD Million) Forecast by Country, 2021 to 2036
- Table 37: East Asia Market Value (USD Million) Forecast by Instrument Type , 2021 to 2036
- Table 38: East Asia Market Value (USD Million) Forecast by Application, 2021 to 2036
- Table 39: East Asia Market Value (USD Million) Forecast by End User, 2021 to 2036
- Table 40: East Asia Market Value (USD Million) Forecast by Technology, 2021 to 2036
- Table 41: East Asia Market Value (USD Million) Forecast by Throughput, 2021 to 2036
- Table 42: East Asia Market Value (USD Million) Forecast by Detection Channel, 2021 to 2036
- Table 43: South Asia and Pacific Market Value (USD Million) Forecast by Country, 2021 to 2036
- Table 44: South Asia and Pacific Market Value (USD Million) Forecast by Instrument Type , 2021 to 2036
- Table 45: South Asia and Pacific Market Value (USD Million) Forecast by Application, 2021 to 2036
- Table 46: South Asia and Pacific Market Value (USD Million) Forecast by End User, 2021 to 2036
- Table 47: South Asia and Pacific Market Value (USD Million) Forecast by Technology, 2021 to 2036
- Table 48: South Asia and Pacific Market Value (USD Million) Forecast by Throughput, 2021 to 2036
- Table 49: South Asia and Pacific Market Value (USD Million) Forecast by Detection Channel, 2021 to 2036
- Table 50: Middle East & Africa Market Value (USD Million) Forecast by Country, 2021 to 2036
- Table 51: Middle East & Africa Market Value (USD Million) Forecast by Instrument Type , 2021 to 2036
- Table 52: Middle East & Africa Market Value (USD Million) Forecast by Application, 2021 to 2036
- Table 53: Middle East & Africa Market Value (USD Million) Forecast by End User, 2021 to 2036
- Table 54: Middle East & Africa Market Value (USD Million) Forecast by Technology, 2021 to 2036
- Table 55: Middle East & Africa Market Value (USD Million) Forecast by Throughput, 2021 to 2036
- Table 56: Middle East & Africa Market Value (USD Million) Forecast by Detection Channel, 2021 to 2036
List of Figures
- Figure 1: Global Market Pricing Analysis
- Figure 2: Global Market Value (USD Million) Forecast 2021-2036
- Figure 3: Global Market Value Share and BPS Analysis by Instrument Type , 2026 and 2036
- Figure 4: Global Market Y-o-Y Growth Comparison by Instrument Type , 2026-2036
- Figure 5: Global Market Attractiveness Analysis by Instrument Type
- Figure 6: Global Market Value Share and BPS Analysis by Application, 2026 and 2036
- Figure 7: Global Market Y-o-Y Growth Comparison by Application, 2026-2036
- Figure 8: Global Market Attractiveness Analysis by Application
- Figure 9: Global Market Value Share and BPS Analysis by End User, 2026 and 2036
- Figure 10: Global Market Y-o-Y Growth Comparison by End User, 2026-2036
- Figure 11: Global Market Attractiveness Analysis by End User
- Figure 12: Global Market Value Share and BPS Analysis by Technology, 2026 and 2036
- Figure 13: Global Market Y-o-Y Growth Comparison by Technology, 2026-2036
- Figure 14: Global Market Attractiveness Analysis by Technology
- Figure 15: Global Market Value Share and BPS Analysis by Throughput, 2026 and 2036
- Figure 16: Global Market Y-o-Y Growth Comparison by Throughput, 2026-2036
- Figure 17: Global Market Attractiveness Analysis by Throughput
- Figure 18: Global Market Value Share and BPS Analysis by Detection Channel, 2026 and 2036
- Figure 19: Global Market Y-o-Y Growth Comparison by Detection Channel, 2026-2036
- Figure 20: Global Market Attractiveness Analysis by Detection Channel
- Figure 21: Global Market Value (USD Million) Share and BPS Analysis by Region, 2026 and 2036
- Figure 22: Global Market Y-o-Y Growth Comparison by Region, 2026-2036
- Figure 23: Global Market Attractiveness Analysis by Region
- Figure 24: North America Market Incremental Dollar Opportunity, 2026-2036
- Figure 25: Latin America Market Incremental Dollar Opportunity, 2026-2036
- Figure 26: Western Europe Market Incremental Dollar Opportunity, 2026-2036
- Figure 27: Eastern Europe Market Incremental Dollar Opportunity, 2026-2036
- Figure 28: East Asia Market Incremental Dollar Opportunity, 2026-2036
- Figure 29: South Asia and Pacific Market Incremental Dollar Opportunity, 2026-2036
- Figure 30: Middle East & Africa Market Incremental Dollar Opportunity, 2026-2036
- Figure 31: North America Market Value Share and BPS Analysis by Country, 2026 and 2036
- Figure 32: North America Market Value Share and BPS Analysis by Instrument Type , 2026 and 2036
- Figure 33: North America Market Y-o-Y Growth Comparison by Instrument Type , 2026-2036
- Figure 34: North America Market Attractiveness Analysis by Instrument Type
- Figure 35: North America Market Value Share and BPS Analysis by Application, 2026 and 2036
- Figure 36: North America Market Y-o-Y Growth Comparison by Application, 2026-2036
- Figure 37: North America Market Attractiveness Analysis by Application
- Figure 38: North America Market Value Share and BPS Analysis by End User, 2026 and 2036
- Figure 39: North America Market Y-o-Y Growth Comparison by End User, 2026-2036
- Figure 40: North America Market Attractiveness Analysis by End User
- Figure 41: North America Market Value Share and BPS Analysis by Technology, 2026 and 2036
- Figure 42: North America Market Y-o-Y Growth Comparison by Technology, 2026-2036
- Figure 43: North America Market Attractiveness Analysis by Technology
- Figure 44: North America Market Value Share and BPS Analysis by Throughput, 2026 and 2036
- Figure 45: North America Market Y-o-Y Growth Comparison by Throughput, 2026-2036
- Figure 46: North America Market Attractiveness Analysis by Throughput
- Figure 47: North America Market Value Share and BPS Analysis by Detection Channel, 2026 and 2036
- Figure 48: North America Market Y-o-Y Growth Comparison by Detection Channel, 2026-2036
- Figure 49: North America Market Attractiveness Analysis by Detection Channel
- Figure 50: Latin America Market Value Share and BPS Analysis by Country, 2026 and 2036
- Figure 51: Latin America Market Value Share and BPS Analysis by Instrument Type , 2026 and 2036
- Figure 52: Latin America Market Y-o-Y Growth Comparison by Instrument Type , 2026-2036
- Figure 53: Latin America Market Attractiveness Analysis by Instrument Type
- Figure 54: Latin America Market Value Share and BPS Analysis by Application, 2026 and 2036
- Figure 55: Latin America Market Y-o-Y Growth Comparison by Application, 2026-2036
- Figure 56: Latin America Market Attractiveness Analysis by Application
- Figure 57: Latin America Market Value Share and BPS Analysis by End User, 2026 and 2036
- Figure 58: Latin America Market Y-o-Y Growth Comparison by End User, 2026-2036
- Figure 59: Latin America Market Attractiveness Analysis by End User
- Figure 60: Latin America Market Value Share and BPS Analysis by Technology, 2026 and 2036
- Figure 61: Latin America Market Y-o-Y Growth Comparison by Technology, 2026-2036
- Figure 62: Latin America Market Attractiveness Analysis by Technology
- Figure 63: Latin America Market Value Share and BPS Analysis by Throughput, 2026 and 2036
- Figure 64: Latin America Market Y-o-Y Growth Comparison by Throughput, 2026-2036
- Figure 65: Latin America Market Attractiveness Analysis by Throughput
- Figure 66: Latin America Market Value Share and BPS Analysis by Detection Channel, 2026 and 2036
- Figure 67: Latin America Market Y-o-Y Growth Comparison by Detection Channel, 2026-2036
- Figure 68: Latin America Market Attractiveness Analysis by Detection Channel
- Figure 69: Western Europe Market Value Share and BPS Analysis by Country, 2026 and 2036
- Figure 70: Western Europe Market Value Share and BPS Analysis by Instrument Type , 2026 and 2036
- Figure 71: Western Europe Market Y-o-Y Growth Comparison by Instrument Type , 2026-2036
- Figure 72: Western Europe Market Attractiveness Analysis by Instrument Type
- Figure 73: Western Europe Market Value Share and BPS Analysis by Application, 2026 and 2036
- Figure 74: Western Europe Market Y-o-Y Growth Comparison by Application, 2026-2036
- Figure 75: Western Europe Market Attractiveness Analysis by Application
- Figure 76: Western Europe Market Value Share and BPS Analysis by End User, 2026 and 2036
- Figure 77: Western Europe Market Y-o-Y Growth Comparison by End User, 2026-2036
- Figure 78: Western Europe Market Attractiveness Analysis by End User
- Figure 79: Western Europe Market Value Share and BPS Analysis by Technology, 2026 and 2036
- Figure 80: Western Europe Market Y-o-Y Growth Comparison by Technology, 2026-2036
- Figure 81: Western Europe Market Attractiveness Analysis by Technology
- Figure 82: Western Europe Market Value Share and BPS Analysis by Throughput, 2026 and 2036
- Figure 83: Western Europe Market Y-o-Y Growth Comparison by Throughput, 2026-2036
- Figure 84: Western Europe Market Attractiveness Analysis by Throughput
- Figure 85: Western Europe Market Value Share and BPS Analysis by Detection Channel, 2026 and 2036
- Figure 86: Western Europe Market Y-o-Y Growth Comparison by Detection Channel, 2026-2036
- Figure 87: Western Europe Market Attractiveness Analysis by Detection Channel
- Figure 88: Eastern Europe Market Value Share and BPS Analysis by Country, 2026 and 2036
- Figure 89: Eastern Europe Market Value Share and BPS Analysis by Instrument Type , 2026 and 2036
- Figure 90: Eastern Europe Market Y-o-Y Growth Comparison by Instrument Type , 2026-2036
- Figure 91: Eastern Europe Market Attractiveness Analysis by Instrument Type
- Figure 92: Eastern Europe Market Value Share and BPS Analysis by Application, 2026 and 2036
- Figure 93: Eastern Europe Market Y-o-Y Growth Comparison by Application, 2026-2036
- Figure 94: Eastern Europe Market Attractiveness Analysis by Application
- Figure 95: Eastern Europe Market Value Share and BPS Analysis by End User, 2026 and 2036
- Figure 96: Eastern Europe Market Y-o-Y Growth Comparison by End User, 2026-2036
- Figure 97: Eastern Europe Market Attractiveness Analysis by End User
- Figure 98: Eastern Europe Market Value Share and BPS Analysis by Technology, 2026 and 2036
- Figure 99: Eastern Europe Market Y-o-Y Growth Comparison by Technology, 2026-2036
- Figure 100: Eastern Europe Market Attractiveness Analysis by Technology
- Figure 101: Eastern Europe Market Value Share and BPS Analysis by Throughput, 2026 and 2036
- Figure 102: Eastern Europe Market Y-o-Y Growth Comparison by Throughput, 2026-2036
- Figure 103: Eastern Europe Market Attractiveness Analysis by Throughput
- Figure 104: Eastern Europe Market Value Share and BPS Analysis by Detection Channel, 2026 and 2036
- Figure 105: Eastern Europe Market Y-o-Y Growth Comparison by Detection Channel, 2026-2036
- Figure 106: Eastern Europe Market Attractiveness Analysis by Detection Channel
- Figure 107: East Asia Market Value Share and BPS Analysis by Country, 2026 and 2036
- Figure 108: East Asia Market Value Share and BPS Analysis by Instrument Type , 2026 and 2036
- Figure 109: East Asia Market Y-o-Y Growth Comparison by Instrument Type , 2026-2036
- Figure 110: East Asia Market Attractiveness Analysis by Instrument Type
- Figure 111: East Asia Market Value Share and BPS Analysis by Application, 2026 and 2036
- Figure 112: East Asia Market Y-o-Y Growth Comparison by Application, 2026-2036
- Figure 113: East Asia Market Attractiveness Analysis by Application
- Figure 114: East Asia Market Value Share and BPS Analysis by End User, 2026 and 2036
- Figure 115: East Asia Market Y-o-Y Growth Comparison by End User, 2026-2036
- Figure 116: East Asia Market Attractiveness Analysis by End User
- Figure 117: East Asia Market Value Share and BPS Analysis by Technology, 2026 and 2036
- Figure 118: East Asia Market Y-o-Y Growth Comparison by Technology, 2026-2036
- Figure 119: East Asia Market Attractiveness Analysis by Technology
- Figure 120: East Asia Market Value Share and BPS Analysis by Throughput, 2026 and 2036
- Figure 121: East Asia Market Y-o-Y Growth Comparison by Throughput, 2026-2036
- Figure 122: East Asia Market Attractiveness Analysis by Throughput
- Figure 123: East Asia Market Value Share and BPS Analysis by Detection Channel, 2026 and 2036
- Figure 124: East Asia Market Y-o-Y Growth Comparison by Detection Channel, 2026-2036
- Figure 125: East Asia Market Attractiveness Analysis by Detection Channel
- Figure 126: South Asia and Pacific Market Value Share and BPS Analysis by Country, 2026 and 2036
- Figure 127: South Asia and Pacific Market Value Share and BPS Analysis by Instrument Type , 2026 and 2036
- Figure 128: South Asia and Pacific Market Y-o-Y Growth Comparison by Instrument Type , 2026-2036
- Figure 129: South Asia and Pacific Market Attractiveness Analysis by Instrument Type
- Figure 130: South Asia and Pacific Market Value Share and BPS Analysis by Application, 2026 and 2036
- Figure 131: South Asia and Pacific Market Y-o-Y Growth Comparison by Application, 2026-2036
- Figure 132: South Asia and Pacific Market Attractiveness Analysis by Application
- Figure 133: South Asia and Pacific Market Value Share and BPS Analysis by End User, 2026 and 2036
- Figure 134: South Asia and Pacific Market Y-o-Y Growth Comparison by End User, 2026-2036
- Figure 135: South Asia and Pacific Market Attractiveness Analysis by End User
- Figure 136: South Asia and Pacific Market Value Share and BPS Analysis by Technology, 2026 and 2036
- Figure 137: South Asia and Pacific Market Y-o-Y Growth Comparison by Technology, 2026-2036
- Figure 138: South Asia and Pacific Market Attractiveness Analysis by Technology
- Figure 139: South Asia and Pacific Market Value Share and BPS Analysis by Throughput, 2026 and 2036
- Figure 140: South Asia and Pacific Market Y-o-Y Growth Comparison by Throughput, 2026-2036
- Figure 141: South Asia and Pacific Market Attractiveness Analysis by Throughput
- Figure 142: South Asia and Pacific Market Value Share and BPS Analysis by Detection Channel, 2026 and 2036
- Figure 143: South Asia and Pacific Market Y-o-Y Growth Comparison by Detection Channel, 2026-2036
- Figure 144: South Asia and Pacific Market Attractiveness Analysis by Detection Channel
- Figure 145: Middle East & Africa Market Value Share and BPS Analysis by Country, 2026 and 2036
- Figure 146: Middle East & Africa Market Value Share and BPS Analysis by Instrument Type , 2026 and 2036
- Figure 147: Middle East & Africa Market Y-o-Y Growth Comparison by Instrument Type , 2026-2036
- Figure 148: Middle East & Africa Market Attractiveness Analysis by Instrument Type
- Figure 149: Middle East & Africa Market Value Share and BPS Analysis by Application, 2026 and 2036
- Figure 150: Middle East & Africa Market Y-o-Y Growth Comparison by Application, 2026-2036
- Figure 151: Middle East & Africa Market Attractiveness Analysis by Application
- Figure 152: Middle East & Africa Market Value Share and BPS Analysis by End User, 2026 and 2036
- Figure 153: Middle East & Africa Market Y-o-Y Growth Comparison by End User, 2026-2036
- Figure 154: Middle East & Africa Market Attractiveness Analysis by End User
- Figure 155: Middle East & Africa Market Value Share and BPS Analysis by Technology, 2026 and 2036
- Figure 156: Middle East & Africa Market Y-o-Y Growth Comparison by Technology, 2026-2036
- Figure 157: Middle East & Africa Market Attractiveness Analysis by Technology
- Figure 158: Middle East & Africa Market Value Share and BPS Analysis by Throughput, 2026 and 2036
- Figure 159: Middle East & Africa Market Y-o-Y Growth Comparison by Throughput, 2026-2036
- Figure 160: Middle East & Africa Market Attractiveness Analysis by Throughput
- Figure 161: Middle East & Africa Market Value Share and BPS Analysis by Detection Channel, 2026 and 2036
- Figure 162: Middle East & Africa Market Y-o-Y Growth Comparison by Detection Channel, 2026-2036
- Figure 163: Middle East & Africa Market Attractiveness Analysis by Detection Channel
- Figure 164: Global Market - Tier Structure Analysis
- Figure 165: Global Market - Company Share Analysis


