Purified Phosphoric Acid Market Outlook (2023 to 2033)

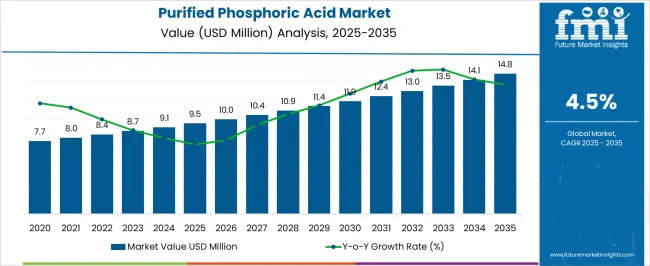
Registering a 4.4% year-on-year growth, global purified phosphoric acid market sales totalled revenues of US$ 8,357.3 million in 2022. Over the forecast period from 2023 to 2033, global demand for purified phosphoric acid is projected to rise at 4.7% CAGR.

The global purified phosphoric acid market size is anticipated to reach US$ 8,702.8 million in 2023 and US$ 13,782.4 million by 2033.

Key Market Shaping Factors:

  • Robust growth of end-use sectors such as pharmaceutical and food & beverage is uplifting global purified phosphoric acid demand
  • Growing demand for high-quality fertilizers globally is expected to fuel purified phosphoric acid sales
  • Rising usage of purified phosphoric acid in animal nutrition and water treatment applications might boost the global market
  • Increasing popularity of purified phosphoric acid as an ideal preservative and acidulant in food & beverage sector is anticipated to create growth prospects for the market
  • Burgeoning demand for pharmaceutical products requiring PPA for their production is likely to generate ample opportunities for purified phosphoric acid manufacturers
  • Surging popularity of wet process phosphoric acid is projected to further boost the target market

High-quality purified phosphoric acid is referred to as a premium-grade form of acid that undergoes rigorous purification processes to eliminate impurities and contaminants.

Purified phosphoric acid is widely used in diverse sectors, including agriculture, food & beverages, electronics, chemicals, and pharmaceuticals. Its versatile applications range from fertilizer production and pH regulation to drug synthesis and electronic component manufacturing.

To meet the demand for purified phosphoric acid, manufacturers have developed advanced purification techniques that can remove impurities and contaminants from the acid. These techniques include distillation, ion exchange, and adsorption.

Purified phosphoric acid is a high-quality form of phosphoric acid that is widely used in diverse sectors due to its versatile applications. The focus within the purified phosphoric acid market is centered on the production and distribution of this refined variant to meet the specific requirements of various industries.

The purified phosphoric acid market is witnessing substantial growth primarily driven by the rising demand from the pharmaceutical and food and beverage sectors.

Purified phosphoric acid is being widely used as a preservative, acidulant, buffering agent, and excipient in food & beverage and pharmaceutical sectors. Hence, growth of these sectors is expected to eventually uplift purified phosphoric acid demand.

Purified phosphoric acid is being increasingly used as a food additive, especially in the production of soft drinks & food products. Increasing consumption of processed foods and beverages is expected to fuel purified phosphoric acid sales.

Manufacturers of purified phosphoric acid are actively expanding their production capacities, with a particular emphasis on pharmaceutical grade products. These products command higher prices and offer greater profit margins for manufacturers compared to other grades of purified phosphoric acid.

To maximize profitability, various manufacturers prefer captive manufacturing, wherein they establish in-house production facilities for purified phosphoric acid.

Growing usage of purified phosphoric acid in the electronics sector for producing semiconductors, PCBs, and electronic displays, along with its application in etching, cleaning, and specialized coatings is expected to boost the market.

As the electronic sector continues to advance and the demand for electronic devices rises, sales of purified phosphoric acid are expected to increase rapidly.

Another prominent factor boosting the target market is the rising demand for agrochemicals. Factors such as food insecurity triggered by population explosion and reduction in arable land are encouraging the adoption of agrochemicals made from ingredients like phosphoric acid.

The Food and Agriculture Organization (FAO) of the United Nations revealed that severe food insecurity rose from 10.9% in 2020 to 11.7% in 2021. This food insecurity issue is compelling farmers globally to use phosphate fertilizers to enhance their crop production. Driven by this, demand for PPA is expected to rise rapidly as it is being widely used for making agrochemicals.

Attributes Key Insights
Purified Phosphoric Acid Market Size (2022) US$ 8,357.3 million
Estimated Market Size (2023E) US$ 8,702.8 million
Projected Market Value (2033F) US$ 13,782.4 million
Value-based CAGR (2023 to 2033) 4.7%

Don't pay for what you don't need

Customize your report by selecting specific countries or regions and save 30%!

2018 to 2022 Global Purified Phosphoric Acid Sales Outlook Compared to Demand Forecast from 2023 to 2033

As per Future Market Insights (FMI), historically from 2018 to 2022, global sales of purified phosphoric acid increased at 4.3% CAGR. It attained a valuation of about US$ 8,357.3 million at the end of 2022.

Looking ahead, the target market is expected to thrive at a CAGR of around 4.7% during the assessment period. This is due to increasing demand for purified phosphoric acid from pharmaceutical, food & beverage, and other sectors and growing agricultural activities in emerging markets.

Factors such as raw material availability, technological advancements, and government regulations are also impacting market growth. Subsequently, increasing demand for eco-friendly and sustainable products is expected to contribute to market growth.

Purified phosphoric acid is in high demand in the food & beverage and pharmaceutical sectors owing to its specific properties, including its preservative nature.

In the food & beverage sector, the use of acidulants and preservatives has become increasingly important as processed foods become more prevalent. Purified phosphoric acid is widely used in carbonated beverages, jams, jellies, and processed meats due to its acidic properties and preservative effects.

Growing demand for clean-label ingredients has led to an increase in the use of PPA as a natural acidulant, replacing artificial additives.

In the pharmaceutical sector, PPA plays a critical role as an ingredient, excipient, and buffering agent. It is used in the formulation and manufacturing of medications such as tablets, capsules, and liquid formulations.

Purified phosphoric acid is essential in regulating the pH levels of pharmaceutical formulations, ensuring stability and efficacy. It serves as a buffering agent, maintaining the desired pH range during the drug manufacturing process.

The demand for high-quality products in the pharmaceutical sector, driven by the industry's strict quality standards and the need for precise formulations, is likely to foster market development.

Purified phosphoric acid is a versatile and essential ingredient in the food & beverage sector, serving as an acidulant and preservative, and in the pharmaceutical sector, it is relied upon for its ability to regulate pH levels and act as a buffering agent in medication formulations.

The demand for purified phosphoric acid is driven by specific factors in both sectors, highlighting its critical role in the production and manufacturing of various products.

What Opportunities are Available for Manufacturers and Distributors in the Market?

Manufacturers can capitalize on the latest technologies and production methods to optimize the efficiency and quality of purified phosphoric acid production. This can involve implementing innovative purification techniques, optimizing process parameters, and incorporating automation and digitization in production facilities.

The new improvements can result in higher yields, reduced energy consumption, improved product purity, and overall cost savings. Engaging in research and development (R&D) activities can help manufacturers stay ahead of the curve in the industry.

Vertical integration offers manufacturers the opportunity to control the entire supply chain, from raw material sourcing to the production and distribution of purified phosphoric acid.

By integrating back into the production of raw materials or forward into distribution and marketing, manufacturers can exert greater control over quality, cost, and supply reliability. This can lead to improved coordination, shorter lead times, and reduced dependency on external suppliers, ultimately enhancing competitiveness in the market.

The manufacturers and suppliers should consider investing in technological advancements and vertical integration to capitalize on the opportunities available in the purified phosphoric acid market.

Nikhil Kaitwade
Nikhil Kaitwade

Principal Consultant

Talk to Analyst

Find your sweet spots for generating winning opportunities in this market.

What Factors are Restraining Growth in the Global Purified Phosphoric Acid Market?

The production costs of purified phosphoric acid pose a significant challenge to the market. The purification process required to obtain high-purity phosphoric acid is complex and resource-intensive, resulting in elevated production expenses compared to other forms of phosphoric acid.

Numerous factors contribute to these high costs, including the need for multiple intricate steps such as filtration, concentration, and acidulation. These processes require substantial energy inputs, leading to increased production expenses, particularly in regions with high energy prices.

Advanced purification technologies and equipment are necessary to achieve the desired level of purity. These sophisticated systems, including filtration mechanisms, separation techniques, and chemical treatments, are costly to install, operate, and maintain.

Ensuring consistent quality is vital for purified phosphoric acid, particularly for applications in the food and pharmaceutical sectors. This necessitates rigorous quality control measures and regular testing throughout the production process, further adding to the overall production costs.

What Factors Contribute to the Significant Share of East Asia and North America in the Global Market?

Regionally, East Asia and North America are prominent markets for purified phosphoric acid globally. It is projected that these regions will contribute more than 60% of the total market value, primarily owing to their high consumption levels.

In East Asia and North America, countries such as China and the United States have substantial domestic markets for pharmaceutical products. This is fuelled by factors like population growth, increased healthcare expenditure, and the prevalence of chronic diseases.

There is a significant consumption of purified phosphoric acid in these regions as an ingredient, excipient, or buffering agent in pharmaceutical formulations. This demand is driven by the necessity for high-quality pharmaceutical products to address the healthcare requirements of the population.

Similarly, robust growth of food & beverage sector in these regions is expected to elevate purified phosphoric acid demand. This is because purified phosphoric acid is being widely used in various applications, including pH adjustment, acidification, emulsification, and flavor enhancement in the food & beverage sector.
Get the data you need at a Fraction of the cost

Personalize your report by choosing insights you need
and save 40%!

Country-wise Insights

What is Fueling Demand for Purified Phosphoric Acid in the United States?

Rising Spending on Pharmaceuticals Fueling Purified Phosphoric Acid Demand in the United States

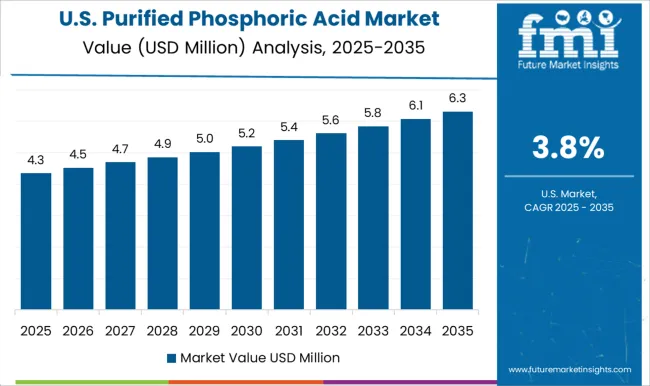
According to Future Market Insights (FMI), the United States is likely to remain one of the dominant markets for purified phosphoric acid during the assessment period. Demand for phosphoric acid in the country is driven by rapid expansion of pharmaceutical sector.

Increasing spending on medicines across the United States is emerging as a prominent factor creating a high demand for purified phosphoric acid. This is attributable to rising usage of purified phosphoric acid for making a wide range of pharmaceutical formulations.

The United States is the leading country when it comes to healthcare spending. As per the U.S. Department of Health and Human Services, United States prescription drug expenditures totaled a massive valuation of US$ 370 billion in 2019. This in turn is positively impacting purified phosphoric acid sales.

Category-wise Insights

Which Product Type is in High Demand in the Global Market?

Demand Remains High for Food Grade Purified Phosphoric Acid

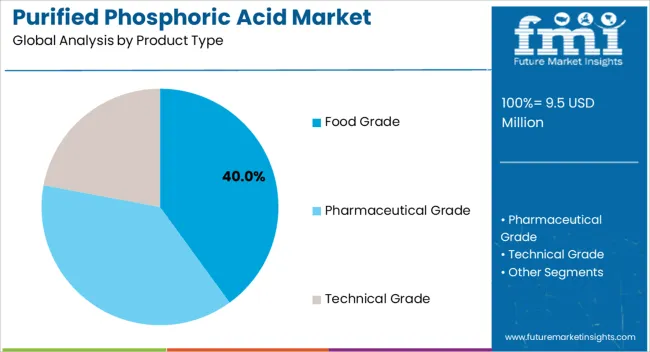
Based on product type, demand is expected to remain high for food-grade purified phosphoric acid. Currently, the target segment dominates the global market with a share of more than 37%. This is attributable to rising usage of food-grade PPA as an acidulant, pH adjuster, and preservative in the food & beverage sector.

The high demand from the food sector results in prominent shares of food-grade purified phosphoric acid. In the food sector, purified phosphoric acid is widely used as an ingredient in various food products.

Purified phosphoric acid is commonly used as an acidulant to enhance the flavor and preserve the shelf life of food products. It is used in the production of soft drinks, fruit juices, jams, and jellies.

Purified phosphoric acid is also used in the production of processed meats, such as bacon and sausage, to enhance the flavor and preserve the quality of the meat.

Rising demand for processed and packaged food products due to changing lifestyles is expected to play a key role in fueling purified phosphoric acid sales during the assessment period.

Which Application will Generate Significant Revenues in the Target Market?

Pharmaceutical Application to Generate Significant Revenues

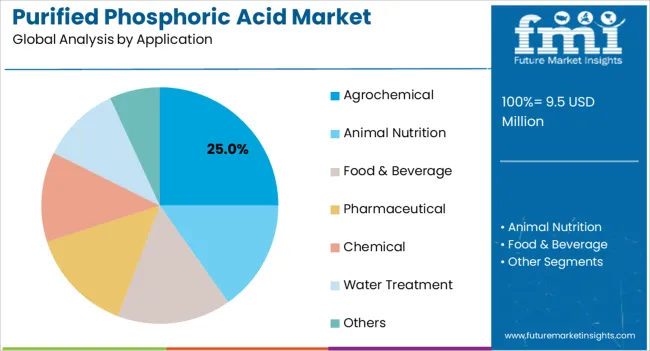
On the basis of application, pharmaceutical segment leads the global market with more than 28% market shares. This is due to rising usage of purified phosphoric acid for the preparation of various pharmaceutical formulations.

Purified phosphoric acid is utilized as an ingredient in the production of certain pharmaceuticals. The main factor which contributes the most to the value shares in the global market is the price of PPA used in pharmaceutical applications. The price of PPA consumed in pharmaceuticals is high compared to the PPA used in the food and beverages sector.

Purified phosphoric acid serves as an API in medications, contributing to their therapeutic properties or serving as a component in drug formulation. It functions as an excipient, a substance added to pharmaceutical formulations for various purposes such as improving drug stability, solubility, or bioavailability.

Purified phosphoric acid is in high demand in the pharmaceutical sector owing to its unique properties and applications. It is an important ingredient in various pharmaceutical formulations, including oral liquids, tablets, and capsules. It is used as an excipient, buffering agent, and acidulant.

One of the primary factors for the high demand for purified phosphoric acid in the pharmaceutical sector is its ability to maintain the pH level of a formulation. It is an effective acidulant that can be used to adjust the pH level of a product to ensure that it is safe for human consumption.

Purified phosphoric acid can also be used as a buffering agent to maintain the pH level of a product over a wide range of temperatures and conditions.

Another factor for the high demand for purified phosphoric acid in the pharmaceutical sector is its role in the manufacturing of essential drugs. For example, it is used in the production of penicillin, a widely used antibiotic. Penicillin is produced through a chemical reaction that requires purified phosphoric acid as a reactant.

Rising production & consumption of various pharmaceutical formulations that require purified phosphoric acid for their preparation is projected to boost the target segment through 2033.

Competitive Landscape

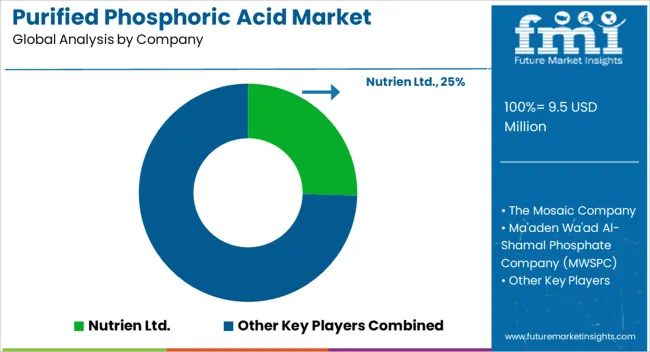
Key manufacturers hold around 40% to 45% market share in the global market. The market is expected to be fairly consolidated as prominent purified phosphoric acid manufacturers are holding a significant share of the market.

Leading players are continuously engaging in boosting their production capacity and updating their product portfolio. To gain maximum profits, companies are also utilizing strategies such as partnerships, mergers, agreements, alliances, acquisitions, etc.

Recent developments:

  • In 2022, Nutrien Ltd. and Innophos Holdings, Inc. entered into a three-year agreement for the supply of Purified Phosphoric Acid (PPA) by Nutrien Ltd. to Innophos Holdings, Inc. for the production of phosphate-based products.
  • OCP Group SA stated in 2022 that it will be expanding its operations by opening a new factory for manufacturing purified phosphoric acid.

Purified Phosphoric Acid Industry Report Scope

Attribute Details
Estimated Market Size (2023) US$ 8,702.8 million
Projected Market Size (2033) US$ 13,782.4 million
Anticipated Growth Rate (2023 to 2033) 4.7% CAGR
Forecast Period 2023 to 2033
Historical Data Available for 2018 to 2022
Market Analysis US$ Million for Value and Tons for Volume
Key Regions Covered North America, Latin America, Western Europe, Eastern Europe, Central Asia, Russia & Belarus, Balkan & Baltics, East Asia, South Asia Pacific, and Middle East Africa
Key Market Segments Covered Product Type, Application, and Region
Key Companies Profiled
  • Nutrien Ltd.
  • The Mosaic Company
  • Ma'aden Wa'ad Al-Shamal Phosphate Company (MWSPC)
  • ICL Group Ltd.
  • Hubei Xingfa Chemicals Group Co., Ltd
  • Yara International ASA
  • OCP Group
  • Jordan Phosphates Mines Company
  • The Mosaic Company
  • OCI Co. Ltd.
  • PhosAgro
  • EuroChem Group
  • Gujarat State Fertilizers Corporation Limited
  • Gujarat Alkalis and Chemicals Ltd.
  • Industries Chimiques du Senegal

Global Purified Phosphoric Acid Market Segmentation

By Product Type:

  • Food Grade
  • Pharmaceutical Grade
  • Technical Grade

By Application:

  • Agrochemical
  • Animal Nutrition
  • Food & Beverage
  • Pharmaceutical
  • Chemical
  • Water Treatment
  • Others

By Region:

  • North America
  • Latin America
  • Western Europe
  • Eastern Europe
  • Central Asia
  • Russia & Belarus
  • Balkan & Baltics
  • East Asia
  • South Asia Pacific
  • Middle East Africa

Frequently Asked Questions

What is the value of the Global Purified Phosphoric Acid market until 2023?

The global purified phosphoric acid market is valued at US$ 8,702.8 million in 2023.

Who are the Leading Industry Players?

Nutrien Ltd., The Mosaic Company, and Ma'aden Wa'ad Al-Shamal Phosphate Company (MWSPC) are the leading industry players.

Which is the Key Segment by Product Type in the Market?

Food-grade purified phosphoric acid is the key segment by product type.

What is the Global Purified Phosphoric Acid Market’s Historical Performance?

The global market surged at a 4.3% CAGR from 2018 to 2022.

Which Region is Dominating the Global Purified Phosphoric Acid Industry?

North America is anticipated to dominate the industry during the forecast period.

Table of Content

1. Executive Summary

    1.1. Global Market Outlook

    1.2. Demand Side Trends

    1.3. Supply Side Trends

    1.4. Type Roadmap

    1.5. Analysis and Recommendations

2. Market Overview

    2.1. Market Coverage / Taxonomy

    2.2. Market Definition / Scope / Limitations

3. Key Market Trends

    3.1. Key Trends Impacting the Market

    3.2. Product Innovation / Development Trends

4. Key Success Factors

    4.1. Product Adoption / Usage Analysis

    4.2. Product USP’s / Features

    4.3. Strategic Promotional Strategies

5. Global Market Demand Analysis 2018 to 2022 and Forecast, 2023 to 2033

    5.1. Historical Market Volume (Tons) Analysis, 2018 to 2022

    5.2. Current and Future Market Volume (Tons) Projections, 2023 to 2033

    5.3. Y-o-Y Growth Trend Analysis

6. Global Market - Pricing Analysis

    6.1. Regional Pricing Analysis By Product Type

    6.2. Global Average Pricing Analysis Benchmark

7. Global Market Demand (in Value or Size in US$ Million) Analysis 2018 to 2022 and Forecast, 2023 to 2033

    7.1. Historical Market Value (US$ Million) Analysis, 2018 to 2022

    7.2. Current and Future Market Value (US$ Million) Projections, 2023 to 2033

        7.2.1. Y-o-Y Growth Trend Analysis

        7.2.2. Absolute $ Opportunity Analysis

8. Market Background

    8.1. Macro-Economic Factors

        8.1.1. Global GDP Growth Outlook

        8.1.2. Global Chemical Industry Overview

        8.1.3. Global Pharmaceutical Industry Overview

        8.1.4. Global Food and Beverage Overview

        8.1.5. Global Agrochemical Industry Overview

        8.1.6. Global Manufacturing Value Added by Key Countries

        8.1.7. Other Macro Economic Factors

    8.2. Forecast Factors - Relevance & Impact

        8.2.1. GDP Growth Forecast

        8.2.2. Manufacturing Industry Forecast

        8.2.3. Increasing Urbanization

        8.2.4. Expanding Retail sector & Logistics

        8.2.5. Per Capita Consumption Expenditure By Consumers of End-Products

        8.2.6. Other Forecast Factors

    8.3. Value Chain

        8.3.1. Raw Product Types Suppliers

        8.3.2. Product Manufacturers

        8.3.3. Probable End-Users

        8.3.4. Avg. Profitability Margins

    8.4. Global Supply Demand Analysis

    8.5. COVID-19 Crisis – Impact Assessment

        8.5.1. Current Statistics

        8.5.2. Short-Mid-Long Term Outlook

        8.5.3. Likely Rebound

    8.6. Market Dynamics

        8.6.1. Drivers

        8.6.2. Restraints

        8.6.3. Opportunity Analysis

    8.7. Patent Analysis

    8.8. Parent Market Overview

    8.9. Production Process

    8.10. Production Capacity of Key Players

    8.11. Trade Flow Analysis

9. Global Market Analysis 2018 to 2022 and Forecast 2023 to 2033, By Product Type

    9.1. Introduction / Key Findings

    9.2. Historical Market Size (US$ Million) and Volume Analysis By Product Type, 2018 to 2022

    9.3. Current and Future Market Size (US$ Million) and Volume Analysis and Forecast By Product Type, 2023 to 2033

            9.3.1.1. Food Grade

            9.3.1.2. Pharmaceutical Grade

            9.3.1.3. Technical Grade

    9.4. Market Attractiveness Analysis By Product Type

10. Global Market Analysis 2018 to 2022 and Forecast 2023 to 2033, By Application

    10.1. Introduction / Key Findings

    10.2. Historical Market Size (US$ Million) and Volume Analysis By Application, 2018 to 2022

    10.3. Current and Future Market Size (US$ Million) and Volume Analysis and Forecast By Application, 2023 to 2033

        10.3.1. Agrochemical

        10.3.2. Animal Nutrition

        10.3.3. Food & Beverage

        10.3.4. Pharmaceutical

        10.3.5. Chemical

        10.3.6. Water Treatment

        10.3.7. Others

    10.4. Market Attractiveness Analysis By Application

11. Global Market Analysis 2018 to 2022 and Forecast 2023 to 2033, by Region

    11.1. Introduction

    11.2. Historical Market Size (US$ Million) and Volume Analysis By Region, 2018 to 2022

    11.3. Current Market Size (US$ Million) and Volume Analysis and Forecast By Region, 2023 to 2033

        11.3.1. North America

        11.3.2. Latin America

        11.3.3. Western Europe

        11.3.4. Eastern Europe

        11.3.5. Central Asia

        11.3.6. Russia & Belarus

        11.3.7. Balkan & Baltic Countries

        11.3.8. Middle East and Africa

        11.3.9. East Asia

        11.3.10. South Asia and Pacific

    11.4. Market Attractiveness Analysis By Region

12. North America Market Analysis 2018 to 2022 and Forecast 2023 to 2033

    12.1. Introduction

    12.2. Pricing Analysis

    12.3. Historical Market Size (US$ Million) and Volume Trend Analysis By Market Taxonomy, 2018 to 2022

    12.4. Market Size (US$ Million) and Volume Forecast By Market Taxonomy, 2023 to 2033

        12.4.1. By Country

            12.4.1.1. United States

            12.4.1.2. Canada

        12.4.2. By Product Type

        12.4.3. By Application

    12.5. Market Attractiveness Analysis

        12.5.1. By Country

        12.5.2. By Product Type

        12.5.3. By Application

    12.6. Market Trends

    12.7. Key Market Participants - Intensity Mapping

    12.8. Drivers and Restraints - Impact Analysis

13. Latin America Market Analysis 2018 to 2022 and Forecast 2023 to 2033

    13.1. Introduction

    13.2. Pricing Analysis

    13.3. Historical Market Size (US$ Million) and Volume Trend Analysis By Market Taxonomy, 2018 to 2022

    13.4. Market Size (US$ Million) and Volume Forecast By Market Taxonomy, 2023 to 2033

        13.4.1. By Country

            13.4.1.1. Brazil

            13.4.1.2. Mexico

            13.4.1.3. Argentina

            13.4.1.4. Rest of Latin America

        13.4.2. By Product Type

        13.4.3. By Application

    13.5. Market Attractiveness Analysis

        13.5.1. By Country

        13.5.2. By Product Type

        13.5.3. By Application

    13.6. Market Trends

    13.7. Key Market Participants - Intensity Mapping

    13.8. Drivers and Restraints - Impact Analysis

14. Western Europe Market Analysis 2018 to 2022 and Forecast 2023 to 2033

    14.1. Introduction

    14.2. Pricing Analysis

    14.3. Historical Market Size (US$ Million) and Volume Trend Analysis By Market Taxonomy, 2018 to 2022

    14.4. Market Size (US$ Million) and Volume Forecast By Market Taxonomy, 2023 to 2033

        14.4.1. By Country

            14.4.1.1. Germany

            14.4.1.2. Italy

            14.4.1.3. France

            14.4.1.4. United Kingdom

            14.4.1.5. Spain

            14.4.1.6. BENELUX

            14.4.1.7. NORDICS

            14.4.1.8. Rest of Western Europe

        14.4.2. By Product Type

        14.4.3. By Application

    14.5. Market Attractiveness Analysis

        14.5.1. By Country

        14.5.2. By Product Type

        14.5.3. By Application

    14.6. Market Trends

    14.7. Key Market Participants - Intensity Mapping

    14.8. Drivers and Restraints - Impact Analysis

15. Eastern Europe Market Analysis 2018 to 2022 and Forecast 2023 to 2033

    15.1. Introduction

    15.2. Pricing Analysis

    15.3. Historical Market Size (US$ Million) and Volume Trend Analysis By Market Taxonomy, 2018 to 2022

    15.4. Market Size (US$ Million) and Volume Forecast By Market Taxonomy, 2023 to 2033

        15.4.1. By Country

            15.4.1.1. Poland

            15.4.1.2. Hungary

            15.4.1.3. Romania

            15.4.1.4. Czech Republic

            15.4.1.5. Rest of Eastern Europe

        15.4.2. By Product Type

        15.4.3. By Application

    15.5. Market Attractiveness Analysis

        15.5.1. By Country

        15.5.2. By Product Type

        15.5.3. By Application

    15.6. Market Trends

    15.7. Key Market Participants - Intensity Mapping

    15.8. Drivers and Restraints - Impact Analysis

16. Central Asia Market Analysis 2018 to 2022 and Forecast 2023 to 2033

    16.1. Introduction

    16.2. Pricing Analysis

    16.3. Historical Market Size (US$ Million) and Volume Trend Analysis By Market Taxonomy, 2018 to 2022

    16.4. Market Size (US$ Million) and Volume Forecast By Market Taxonomy, 2023 to 2033

        16.4.1. By Product Type

        16.4.2. By Application

    16.5. Market Attractiveness Analysis

        16.5.1. By Product Type

        16.5.2. By Application

    16.6. Market Trends

    16.7. Key Market Participants - Intensity Mapping

    16.8. Drivers and Restraints - Impact Analysis

17. Russia & Belarus Market Analysis 2018 to 2022 and Forecast 2023 to 2033

    17.1. Introduction

    17.2. Pricing Analysis

    17.3. Historical Market Size (US$ Million) and Volume Trend Analysis By Market Taxonomy, 2018 to 2022

    17.4. Market Size (US$ Million) and Volume Forecast By Market Taxonomy, 2023 to 2033

        17.4.1. By Product Type

        17.4.2. By Application

    17.5. Market Attractiveness Analysis

        17.5.1. By Product Type

        17.5.2. By Application

    17.6. Market Trends

    17.7. Key Market Participants - Intensity Mapping

    17.8. Drivers and Restraints - Impact Analysis

18. Balkan & Baltic Countries Market Analysis 2018 to 2022 and Forecast 2023 to 2033

    18.1. Introduction

    18.2. Pricing Analysis

    18.3. Historical Market Size (US$ Million) and Volume Trend Analysis By Market Taxonomy, 2018 to 2022

    18.4. Market Size (US$ Million) and Volume Forecast By Market Taxonomy, 2023 to 2033

        18.4.1. By Product Type

        18.4.2. By Application

    18.5. Market Attractiveness Analysis

        18.5.1. By Product Type

        18.5.2. By Application

    18.6. Market Trends

    18.7. Key Market Participants - Intensity Mapping

    18.8. Drivers and Restraints - Impact Analysis

19. South Asia and Pacific Market Analysis 2018 to 2022 and Forecast 2023 to 2033

    19.1. Introduction

    19.2. Pricing Analysis

    19.3. Historical Market Size (US$ Million) and Volume Trend Analysis By Market Taxonomy, 2018 to 2022

    19.4. Market Size (US$ Million) and Volume Forecast By Market Taxonomy, 2023 to 2033

        19.4.1. By Country

            19.4.1.1. India

            19.4.1.2. ASEAN

            19.4.1.3. Oceania

            19.4.1.4. Rest of South Asia & Pacific

        19.4.2. By Product Type

        19.4.3. By Application

    19.5. Market Attractiveness Analysis

        19.5.1. By Country

        19.5.2. By Product Type

        19.5.3. By Application

    19.6. Market Trends

    19.7. Key Market Participants - Intensity Mapping

    19.8. Drivers and Restraints - Impact Analysis

20. East Asia Market Analysis 2018 to 2022 and Forecast 2023 to 2033

    20.1. Introduction

    20.2. Pricing Analysis

    20.3. Historical Market Size (US$ Million) and Volume Trend Analysis By Market Taxonomy, 2018 to 2022

    20.4. Market Size (US$ Million) and Volume Forecast By Market Taxonomy, 2023 to 2033

        20.4.1. By Country

            20.4.1.1. China

            20.4.1.2. Japan

            20.4.1.3. South Korea

        20.4.2. By Product Type

        20.4.3. By Application

    20.5. Market Attractiveness Analysis

        20.5.1. By Country

        20.5.2. By Product Type

        20.5.3. By Application

    20.6. Market Trends

    20.7. Key Market Participants - Intensity Mapping

    20.8. Drivers and Restraints - Impact Analysis

21. Middle East and Africa Market Analysis 2018 to 2022 and Forecast 2023 to 2033

    21.1. Introduction

    21.2. Pricing Analysis

    21.3. Historical Market Size (US$ Million) and Volume Trend Analysis By Market Taxonomy, 2018 to 2022

    21.4. Market Size (US$ Million) and Volume Forecast By Market Taxonomy, 2023 to 2033

        21.4.1. By Country

            21.4.1.1. Kingdom of Saudi Arabia

            21.4.1.2. United Arab Emirates

            21.4.1.3. Türkiye

            21.4.1.4. Northern Africa

            21.4.1.5. South Africa

            21.4.1.6. Israel

            21.4.1.7. Rest of Middle East and Africa

        21.4.2. By Product Type

        21.4.3. By Application

    21.5. Market Attractiveness Analysis

        21.5.1. By Country

        21.5.2. By Product Type

        21.5.3. By Application

    21.6. Market Trends

    21.7. Key Market Participants - Intensity Mapping

    21.8. Drivers and Restraints - Impact Analysis

22. Country-wise Market Analysis

    22.1. Introduction

        22.1.1. Market Value Proportion Analysis, By Key Countries

        22.1.2. Global Vs. Country Growth Comparison

    22.2. United States Market Analysis

        22.2.1. By Product Type

        22.2.2. By Application

    22.3. Canada Market Analysis

        22.3.1. By Product Type

        22.3.2. By Application

    22.4. Mexico Market Analysis

        22.4.1. By Product Type

        22.4.2. By Application

    22.5. Brazil Market Analysis

        22.5.1. By Product Type

        22.5.2. By Application

    22.6. Argentina Market Analysis

        22.6.1. By Product Type

        22.6.2. By Application

    22.7. Germany Market Analysis

        22.7.1. By Product Type

        22.7.2. By Application

    22.8. Italy Market Analysis

        22.8.1. By Product Type

        22.8.2. By Application

    22.9. France Market Analysis

        22.9.1. By Product Type

        22.9.2. By Application

    22.10. United Kingdom Market Analysis

        22.10.1. By Product Type

        22.10.2. By Application

    22.11. Spain Market Analysis

        22.11.1. By Product Type

        22.11.2. By Application

    22.12. NORDICS Market Analysis

        22.12.1. By Product Type

        22.12.2. By Application

    22.13. Poland Market Analysis

        22.13.1. By Product Type

        22.13.2. By Application

    22.14. Hungary Market Analysis

        22.14.1. By Product Type

        22.14.2. By Application

    22.15. Romania Market Analysis

        22.15.1. By Product Type

        22.15.2. By Application

    22.16. Czech Republic Market Analysis

        22.16.1. By Product Type

        22.16.2. By Application

    22.17. China Market Analysis

        22.17.1. By Product Type

        22.17.2. By Application

    22.18. Japan Market Analysis

        22.18.1. By Product Type

        22.18.2. By Application

    22.19. South Korea Market Analysis

        22.19.1. By Product Type

        22.19.2. By Application

    22.20. India Market Analysis

        22.20.1. By Product Type

        22.20.2. By Application

    22.21. ASEAN Market Analysis

        22.21.1. By Product Type

        22.21.2. By Application

    22.22. Australia and New Zealand Market Analysis

        22.22.1. By Product Type

        22.22.2. By Application

    22.23. KSA Market Analysis

        22.23.1. By Product Type

        22.23.2. By Application

    22.24. United Arab Emirates Market Analysis

        22.24.1. By Product Type

        22.24.2. By Application

    22.25. Northern Africa Market Analysis

        22.25.1. By Product Type

        22.25.2. By Application

    22.26. Türkiye Market Analysis

        22.26.1. By Product Type

        22.26.2. By Application

    22.27. South Africa Market Analysis

        22.27.1. By Product Type

        22.27.2. By Application

    22.28. Israel Market Analysis

        22.28.1. By Product Type

        22.28.2. By Application

23. Market Structure Analysis

    23.1. Market Analysis by Tier of Companies (Rust Remover)

    23.2. Market Concentration

    23.3. Market Share Analysis of Top Players

    23.4. Production Capacity Analysis

    23.5. Market Presence Analysis

        23.5.1. By Regional Footprint of Players

24. Competition Analysis

    24.1. Competition Dashboard

    24.2. Competition Benchmarking

    24.3. Competition Deep Dive

        24.3.1. Nutrien Ltd.

            24.3.1.1. Overview

            24.3.1.2. Product Portfolio

            24.3.1.3. Profitability by Market Segments (Product Type/Application/Region)

            24.3.1.4. Sales Footprint

            24.3.1.5. Strategy Overview

        24.3.2. Quaker Chemical Corporation

            24.3.2.1. Overview

            24.3.2.2. Product Portfolio

            24.3.2.3. Profitability by Market Segments (Product Type/Application/Region)

            24.3.2.4. Sales Footprint

            24.3.2.5. Strategy Overview

        24.3.3. Nutrien Ltd.

            24.3.3.1. Overview

            24.3.3.2. Product Portfolio

            24.3.3.3. Profitability by Market Segments (Product Type/Application/Region)

            24.3.3.4. Sales Footprint

            24.3.3.5. Strategy Overview

        24.3.4. The Mosaic Company

            24.3.4.1. Overview

            24.3.4.2. Product Portfolio

            24.3.4.3. Profitability by Market Segments (Product Type/Application/Region)

            24.3.4.4. Sales Footprint

            24.3.4.5. Strategy Overview

        24.3.5. Ma'aden Wa'ad Al-Shamal Phosphate Company (MWSPC)

            24.3.5.1. Overview

            24.3.5.2. Product Portfolio

            24.3.5.3. Profitability by Market Segments (Product Type/Application/Region)

            24.3.5.4. Sales Footprint

            24.3.5.5. Strategy Overview

        24.3.6. ICL Group Ltd.

            24.3.6.1. Overview

            24.3.6.2. Product Portfolio

            24.3.6.3. Profitability by Market Segments (Product Type/Application/Region)

            24.3.6.4. Sales Footprint

            24.3.6.5. Strategy Overview

        24.3.7. Hubei Xingfa Chemicals Group Co., Ltd

            24.3.7.1. Overview

            24.3.7.2. Product Portfolio

            24.3.7.3. Profitability by Market Segments (Product Type/Application/Region)

            24.3.7.4. Sales Footprint

            24.3.7.5. Strategy Overview

        24.3.8. Yara International ASA

            24.3.8.1. Overview

            24.3.8.2. Product Portfolio

            24.3.8.3. Profitability by Market Segments (Product Type/Application/Region)

            24.3.8.4. Sales Footprint

            24.3.8.5. Strategy Overview

        24.3.9. OCP Group

            24.3.9.1. Overview

            24.3.9.2. Product Portfolio

            24.3.9.3. Profitability by Market Segments (Product Type/Application/Region)

            24.3.9.4. Sales Footprint

            24.3.9.5. Strategy Overview

        24.3.10. Jordan Phosphates Mines Company

            24.3.10.1. Overview

            24.3.10.2. Product Portfolio

            24.3.10.3. Profitability by Market Segments (Product Type/Application/Region)

            24.3.10.4. Sales Footprint

            24.3.10.5. Strategy Overview

        24.3.11. The Mosaic Company

            24.3.11.1. Overview

            24.3.11.2. Product Portfolio

            24.3.11.3. Profitability by Market Segments (Product Type/Application/Region)

            24.3.11.4. Sales Footprint

            24.3.11.5. Strategy Overview

        24.3.12. OCI Co. Ltd.

            24.3.12.1. Overview

            24.3.12.2. Product Portfolio

            24.3.12.3. Profitability by Market Segments (Product Type/Application/Region)

            24.3.12.4. Sales Footprint

            24.3.12.5. Strategy Overview

        24.3.13. PhosAgro

            24.3.13.1. Overview

            24.3.13.2. Product Portfolio

            24.3.13.3. Profitability by Market Segments (Product Type/Application/Region)

            24.3.13.4. Sales Footprint

            24.3.13.5. Strategy Overview

        24.3.14. EuroChem Group

            24.3.14.1. Overview

            24.3.14.2. Product Portfolio

            24.3.14.3. Profitability by Market Segments (Product Type/Application/Region)

            24.3.14.4. Sales Footprint

            24.3.14.5. Strategy Overview

        24.3.15. Gujarat State Fertilizers Corporation Limited

            24.3.15.1. Overview

            24.3.15.2. Product Portfolio

            24.3.15.3. Profitability by Market Segments (Product Type/Application/Region)

            24.3.15.4. Sales Footprint

            24.3.15.5. Strategy Overview

        24.3.16. Gujarat Alkalis and Chemicals Ltd.

            24.3.16.1. Overview

            24.3.16.2. Product Portfolio

            24.3.16.3. Profitability by Market Segments (Product Type/Application/Region)

            24.3.16.4. Sales Footprint

            24.3.16.5. Strategy Overview

        24.3.17. Industries Chimiques du Senegal.

            24.3.17.1. Overview

            24.3.17.2. Product Portfolio

            24.3.17.3. Profitability by Market Segments (Product Type/Application/Region)

            24.3.17.4. Sales Footprint

            24.3.17.5. Strategy Overview

25. Primary Insights

26. Assumptions and Acronyms Used

27. Research Methodology

Recommendations

Chemicals & Materials

Phosphate Fertilizer Market

July 2023

REP-GB-15160

253 pages

Chemicals & Materials

Fine Chemicals Market

June 2023

REP-GB-504

502 pages

Chemicals & Materials

Phosphorus Pentasulfide Market

June 2022

REP-GB-8501

290 pages

Explore Chemicals & Materials Insights

View Reports
Future Market Insights

Purified Phosphoric Acid Market

Schedule a Call