The Pump Tubes Market is estimated to be valued at USD 4.7 billion in 2025 and is projected to reach USD 8.1 billion by 2035, registering a compound annual growth rate (CAGR) of 5.5% over the forecast period.
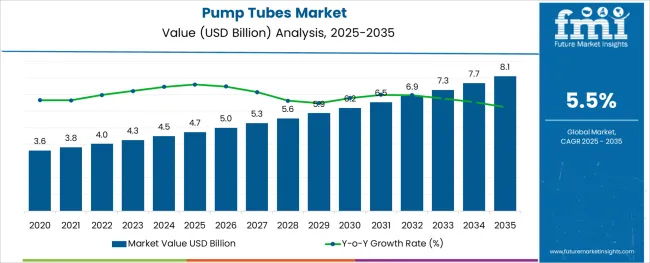
The pump tubes market is witnessing significant growth as manufacturers and brands seek advanced packaging solutions that combine functionality with consumer appeal. Increasing demand for user-friendly, hygienic dispensing systems has propelled pump tubes as preferred packaging formats, particularly in sectors emphasizing product protection and controlled delivery.
Innovations in tube materials, such as lightweight and recyclable polymers, are aligning with sustainability goals and regulatory pressures, further encouraging adoption. The cosmetics and personal care industry remains a dominant end user, driven by rising product variety, premiumization, and increasing skincare and beauty routines worldwide.
Additionally, growth in emerging markets with expanding middle-class populations is opening new avenues for pump tube deployment. The integration of customizable designs, improved sealing technology, and eco-conscious materials is expected to sustain market momentum, with evolving consumer preferences guiding product development and packaging strategies.
The market is segmented by Tube Material, Tube Capacity, and End Use and region. By Tube Material, the market is divided into Polyethylene (PE), Ethylene vinyl alcohol (EVOH), Polyethylene terephthalate (PET), and Polypropylene (PP). In terms of Tube Capacity, the market is classified into 50 to 200 ML, Above 200 ML, and Below 50 ML.
Based on End Use, the market is segmented into Cosmetics & Personal Care and Healthcare. Regionally, the market is classified into North America, Latin America, Western Europe, Eastern Europe, Balkan & Baltic Countries, Russia & Belarus, Central Asia, East Asia, South Asia & Pacific, and the Middle East & Africa.
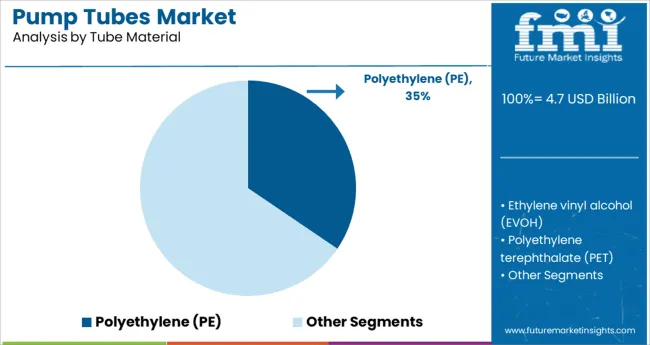
Polyethylene (PE) is anticipated to hold 34.5% of the revenue share in the tube material segment in 2025, making it the leading material type. Its dominance is attributed to a balanced combination of flexibility, chemical resistance, and cost efficiency, which suits a wide variety of viscous and semi-viscous products.
PE’s recyclability and compatibility with various printing and decoration techniques have supported its preference among cosmetics and personal care brands aiming for both aesthetic appeal and sustainability.
The material’s performance in maintaining product integrity and enabling smooth dispensing has further reinforced its position as the most widely adopted tube material in the market.
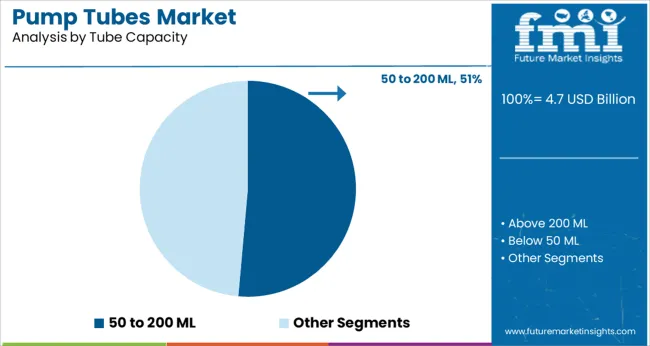
The 50 to 200 ML tube capacity segment is expected to capture 51.4% of the revenue share in 2025, establishing it as the leading capacity range. This preference is driven by its suitability for a broad spectrum of product types, including lotions, creams, gels, and cleansers, which commonly fall within this volume bracket.
Its portability, convenience, and alignment with consumer usage patterns have made it especially popular in personal care and cosmetics packaging. Manufacturers have focused on optimizing tube design and pump compatibility within this size range to enhance user experience and product shelf appeal.
This capacity segment offers an ideal balance between product volume and packaging cost, supporting widespread adoption globally.
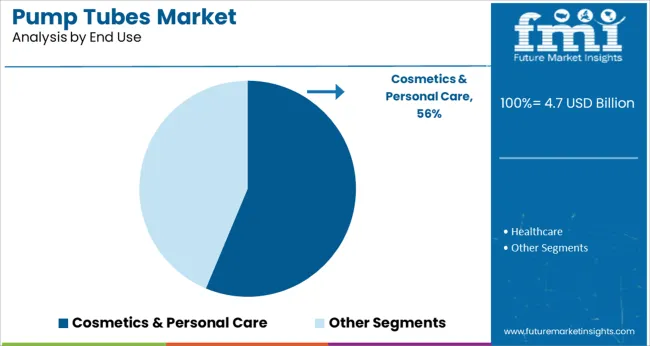
The cosmetics and personal care segment is projected to account for 56.3% of the pump tubes market revenue in 2025, making it the dominant end use industry. This leadership stems from the increasing demand for skincare, haircare, and beauty products that require precise and hygienic dispensing solutions.
The growing consumer focus on personal grooming and the rise of premium and natural product lines have accelerated the use of pump tubes for their ease of use and protection against contamination. Brands are leveraging innovative tube designs and materials to cater to diverse product formulations and target demographics.
Furthermore, expanding retail channels and e-commerce platforms have supported broader product reach, reinforcing pump tubes’ critical role in cosmetics and personal care packaging strategies.
Over the past decade, the burden of dermatological disorders such as acne, eczema, skin cancer, psoriasis, and others is rapidly surging across the globe, owing to increasing ultraviolet (UV) radiation and growing air pollution. For instance, according to the America Academy of Dermatology Association, nearly 9,500 people across the USA. are estimated to be diagnosed with skin cancer every day.
As tubular packaging solutions such as pump tubes are increasingly being used for packaging dermatological products such as ointments, creams, gels, and others, this rise in prevalence of skin diseases is projected to augment growth in the market.
In addition to this, pump tubes offer excellent barrier properties, minimize the transfer of oxygen, and provide protection against environmental factors and bacteria, thereby, improving the shelf-life of the products.
These packaging solutions are extensively being used across the personal care and cosmetics sector for packaging less viscosity liquids, high viscosity liquids, even solids as they provide a layer of protection, preventing the contents from breakage. Thus, increasing sales of personal care and cosmetics products are expected to propel the demand for pump tubes in the global market.
Increasing concerns regarding environmental sustainability and rising customer inclination towards adopting all-natural and eco-friendly personal care & cosmetic products have resulted in shifting preference towards biodegradable packing solutions.
Citing this trend, several industry players are increasingly launching novel organic products with paper-based packagings such as composite cardboard tubes, which is in turn, hindering the demand for pump tubes in the market.
Also, implementation of bans and other regulations concerning the use of plastic across the USA., India, the UK., China, and others is further restraining the growth in the market.
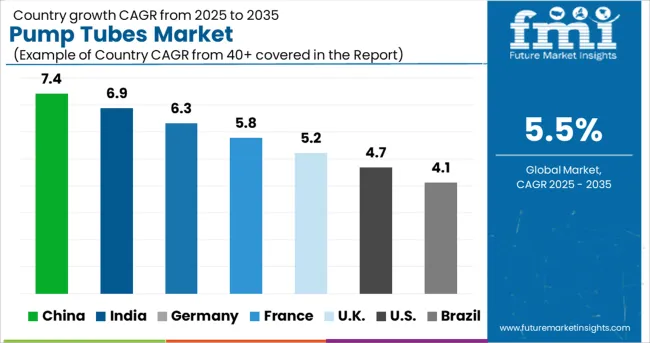
Future Market Insights reveals that Asia Pacific excluding Japan is estimated to register the fastest growth in the global pump tubes market from 2025 to 2035.
Hence, leading industry players are increasingly launching their new brands in countries such as China, India, Australia, and South Korea among others to cater to the growing demand. This is expected to bolster the growth in the market.
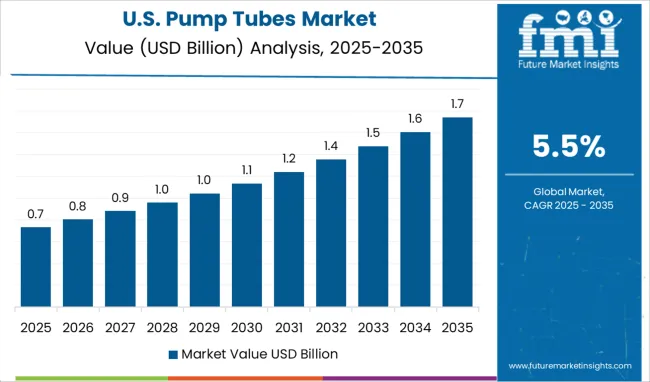
As per FMI, North America is projected to exhibit growth at a rapid CAGR in the pump tubes market during the forecast period 2025 to 2035.
Rising emphasis on enhancing the usability of cosmetic and personal care products to offer a luxurious and sophisticated feel is fueling the demand for highly customizable and technology-oriented airless packaging solutions such as pump tubes across North America. Hence, leading players in the market are aiming on introducing novel products to capitalize on the existing opportunities.
For instance, in 2020, Silgan Dispensing Systems, a USA.-based manufacturer of dispensing closure solutions incorporation with a supplier of tube packaging, Neopac, announced launching a new airless pump tube, Amplify. A multiplicity of such product launches is anticipated to propel the demand for pump tubes in the North America market.
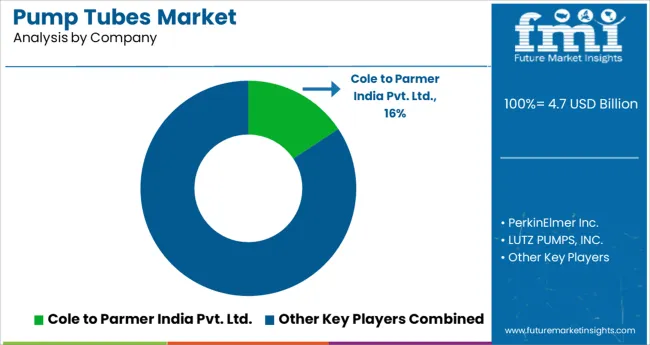
Some of the leading players in the global pump tubes market are Silgan Holdings Inc., Essel Propack Limited, Yangzhou Guanyu Plastic Tube Co., Ltd, Matsa Group, Guangzhou Lisson Plastic Co., Ltd., Albéa S.A., Viva Healthcare Packaging Ltd., TA Plastics Tube Co., Hoffmann Neopac AG, Quadpack Industries, S.A., and Guangzhou Jiangcai Package Co., Ltd.
The market for pump tubes is highly competitive, due to large number of participants and increasing introduction of novel products by leading players
| Report Attribute | Details |
|---|---|
| Growth Rate in Automotive Sector | CAGR of 5.5% from 2025 to 2035 |
| Base Year for Estimation | 2024 |
| Historical Data | 2020 to 2024 |
| Forecast Period | 2025 to 2035 |
| Quantitative Units | Revenue in million and CAGR from 2025 to 2035 |
| Report Coverage | Revenue Forecast, Volume Forecast, Company Ranking, Competitive Landscape, Growth Factors, Trends and Pricing Analysis |
| Segments Covered | Diameter of a Cap, Tube Capacity, Material of Caps, Material of Tubes, End User Industry, Region |
| Countries Covered | North America; Latin America; Western Europe; Eastern Europe; APEJ; Japan; Middle East and Africa |
| Key Companies Profiled | Silgan Holdings Inc.; Essel Propack Limited; Yangzhou Guanyu Plastic Tube Co. Ltd; Matsa Group; Guangzhou Lisson Plastic Co., Ltd.; Albéa S.A.; Viva Healthcare Packaging Ltd.; TA Plastics Tube Co.; Hoffmann Neopac AG; Quadpack Industries; S.A.; Guangzhou Jiangcai Package Co., Ltd |
| Customization | Available Upon Request |
The global pump tubes market is estimated to be valued at USD 4.7 billion in 2025.
It is projected to reach USD 8.1 billion by 2035.
The market is expected to grow at a 5.5% CAGR between 2025 and 2035.
The key product types are polyethylene (pe), ethylene vinyl alcohol (evoh), polyethylene terephthalate (pet) and polypropylene (pp).
50 to 200 ml segment is expected to dominate with a 51.4% industry share in 2025.


Full Research Suite comprises of:
Market outlook & trends analysis
Interviews & case studies
Strategic recommendations
Vendor profiles & capabilities analysis
5-year forecasts
8 regions and 60+ country-level data splits
Market segment data splits
12 months of continuous data updates
DELIVERED AS:
PDF EXCEL ONLINE
Pump Jack Market Forecast Outlook 2025 to 2035
Pump and Dispenser Market Size and Share Forecast Outlook 2025 to 2035
Pump Testers Market Size and Share Forecast Outlook 2025 to 2035
Pumpjacks Market Size and Share Forecast Outlook 2025 to 2035
Pumps Market Size and Share Forecast Outlook 2025 to 2035
Pumpkin Seed Protein Market Size and Share Forecast Outlook 2025 to 2035
Pumped Hydro Storage Market Size and Share Forecast Outlook 2025 to 2035
Pumpkin Pie Spices Market Analysis - Size, Share, and Forecast 2025 to 2035
Pumps and Trigger Spray Market Trends - Growth & Forecast 2025 to 2035
Pump Condiment Dispensers Market - Effortless Portion Control 2025 to 2035
Pumpkin Spice Products Market Trends - Seasonal Demand & Growth 2025 to 2035
Pump Feeders Market Growth - Trends & Forecast 2025 to 2035
Examining Market Share Trends in the Pump and Dispenser Industry
Mud Pumps Market Growth - Trends & Forecast 2025 to 2035
USA Pump and Dispenser Market Report – Demand, Trends & Industry Forecast 2025-2035
Fire Pump Test Meter Market Size and Share Forecast Outlook 2025 to 2035
Heat Pump Market Size and Share Forecast Outlook 2025 to 2035
Vane Pump Market Size and Share Forecast Outlook 2025 to 2035
Heat Pump Market Analysis - Size, Share, and Forecast Outlook 2025 to 2035
Heat Pump Compressors Market Size and Share Forecast Outlook 2025 to 2035

Thank you!
You will receive an email from our Business Development Manager. Please be sure to check your SPAM/JUNK folder too.
Chat With
MaRIA