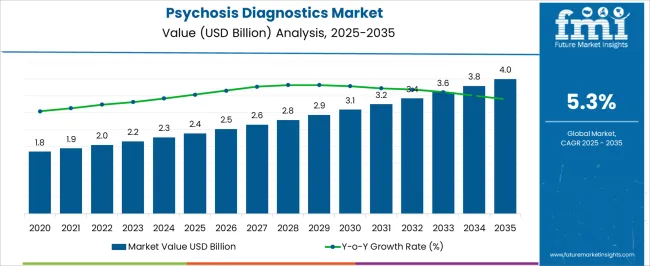
The Psychosis Diagnostics Market is estimated to be valued at USD 2.4 billion in 2025 and is projected to reach USD 4.0 billion by 2035, registering a compound annual growth rate (CAGR) of 5.3% over the forecast period.
| Metric | Value |
|---|---|
| Psychosis Diagnostics Market Estimated Value in (2025 E) | USD 2.4 billion |
| Psychosis Diagnostics Market Forecast Value in (2035 F) | USD 4.0 billion |
| Forecast CAGR (2025 to 2035) | 5.3% |
The psychosis diagnostics market is expanding steadily due to rising awareness of mental health disorders, improved access to psychiatric care, and growing emphasis on early intervention. Increasing prevalence of psychotic conditions and advancements in diagnostic imaging, biomarker research, and digital mental health tools are accelerating adoption.
Healthcare systems are prioritizing integrated approaches that combine clinical assessments with advanced diagnostic methods to improve accuracy and treatment outcomes. Investments in hospital infrastructure, mental health programs, and telepsychiatry are supporting broader availability of diagnostic solutions.
Regulatory support and public initiatives addressing mental health stigma are further enhancing the adoption of structured diagnostic tools. The future outlook remains positive as precision psychiatry and personalized treatment models continue to shape the landscape, enabling early detection and better management of psychosis across diverse patient populations.
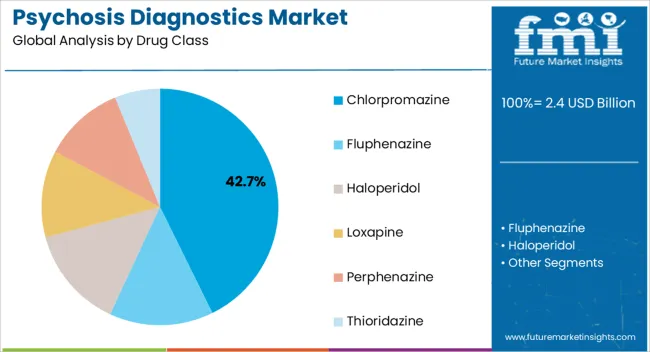
The chlorpromazine drug class segment is projected to account for 42.70% of the total market by 2025, making it the dominant category. Its prevalence is supported by established clinical efficacy, wide availability, and cost effectiveness compared to newer alternatives.
The segment has also benefited from longstanding inclusion in essential medicines lists, ensuring consistent utilization across healthcare systems.
Continued reliance on chlorpromazine in acute management and chronic treatment plans has reinforced its strong market share, supported by affordability and proven therapeutic outcomes.
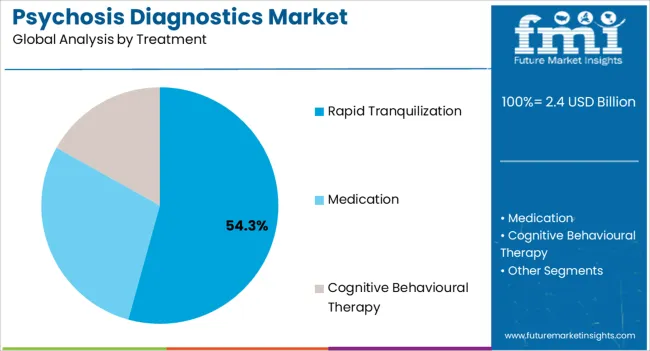
The rapid tranquilization treatment segment is expected to represent 54.30% of total revenue by 2025, highlighting its leadership within the treatment category. This growth is being driven by the urgent need for immediate symptom management in acute psychotic episodes, particularly within emergency and inpatient settings.
The ability to stabilize patients quickly and prevent harm to themselves or others has made this approach highly valued among clinicians.
Its role in improving patient outcomes during critical interventions has solidified rapid tranquilization as the leading treatment method in psychosis care.
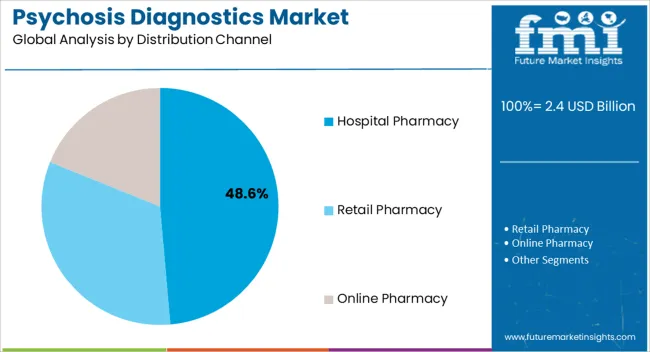
The hospital pharmacy distribution channel is projected to capture 48.60% of the market by 2025, making it the leading distribution route. This dominance is driven by the concentration of acute psychosis cases in hospital environments where immediate diagnosis and treatment are required.
Hospital pharmacies serve as primary points of access for both emergency medications and structured diagnostic pathways, ensuring consistent supply and adherence to treatment protocols.
Their integration within psychiatric care units and emergency departments further enhances their role, positioning hospital pharmacies as the primary distribution channel in the psychosis diagnostics market.
According to market research and competitive intelligence provider Future Market Insights- the market for Psychosis diagnostics reflected a value of 2.1% during the historical period, 2020 to 2025.
The global psychosis diagnostics market grew during this period due to factors such as the increasing prevalence of psychotic disorders, growing awareness and acceptance of mental health disorders, and advances in diagnostic technologies.
Factors such as the increasing demand for non-invasive diagnostic procedures, the rising adoption of precision medicine, and the growing use of biomarkers in diagnostic tests are expected to drive market growth.
Overall, the psychosis diagnostics market is expected to continue to grow in the coming years as advancements in diagnostic technologies, increasing awareness of mental health disorders, and growing demand for personalized and precision medicine drive innovation and adoption of new diagnostic tools and tests.
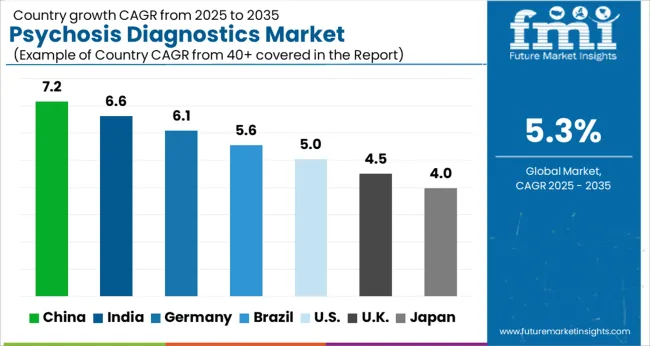
Thus, the market for Psychosis diagnostics is expected to register a CAGR of 5.3% in the forecast period 2025 to 2035.
Increasing prevalence of psychotic disorders driving growth of market
The global prevalence of psychotic disorders is increasing, which is driving the demand for diagnostics tools and tests to accurately diagnose and treat these conditions. There have been significant advancements in diagnostic technologies, such as neuroimaging techniques, which can provide detailed images of the brain and help identify abnormalities associated with psychotic disorders.
There is a growing awareness and acceptance of mental health disorders, which is reducing the stigma associated with these conditions and increasing the demand for accurate diagnosis and treatment. Many governments around the world are investing in research and development of new diagnostic tools and tests for psychotic disorders, which is driving market growth.
As healthcare expenditure continues to increase globally, more resources are being allocated towards the development of new diagnostic tools and tests for psychotic disorders. There is a growing demand for personalized and precision medicine, which involves the use of advanced diagnostics tools and tests to identify specific biomarkers associated with psychotic disorders and develop targeted treatments. This is driving the development of new diagnostic technologies and tools.
Availability of diagnostics tools shaping growth of psychosis diagnostics market
Biomarker Testing: Biomarker testing involves the analysis of biological samples, such as blood or cerebrospinal fluid, to identify molecular markers that may be associated with psychotic disorders. Biomarkers can help to inform diagnosis and treatment decisions and may be useful for monitoring disease progression and treatment response.
Imaging Studies: Imaging studies, such as magnetic resonance imaging (MRI) or computed tomography (CT) scans, may be used to evaluate the structure and function of the brain and identify any abnormalities that may be associated with psychotic disorders.
Psychiatric Evaluation: A psychiatric evaluation may be conducted by a psychiatrist or other mental health professional to assess the patient's mental health and diagnose any psychotic disorders. This may involve a series of tests and assessments, including a mental status examination, psychological testing, and diagnostic imaging studies.
Lack of standardized diagnostic criteria along with expensive nature of diagnostic tools hampering market growth
There is a lack of standardized diagnostic criteria for psychotic disorders, which can make it challenging to develop accurate diagnostic tools and tests. Many people with psychotic disorders do not seek medical help due to limited awareness, stigma, and inadequate access to healthcare facilities, which can limit the demand for diagnostic tools and tests.
The cost of diagnostic tools and tests for psychotic disorders can be high, which can limit their availability and accessibility, particularly in low-income countries and regions. The development and approval of new diagnostic tools and tests are subject to stringent regulatory frameworks, which can slow down the pace of innovation and limit market growth.
The availability of reimbursement policies for diagnostic tools and tests can affect their accessibility and affordability for patients, particularly in regions with limited healthcare resources. The use of advanced diagnostic technologies and tests for psychotic disorders raises ethical and privacy concerns, which could affect market growth. All these factors are derailing the progress of the psychosis diagnostics market
Government initiatives and funding favoring market growth in North America
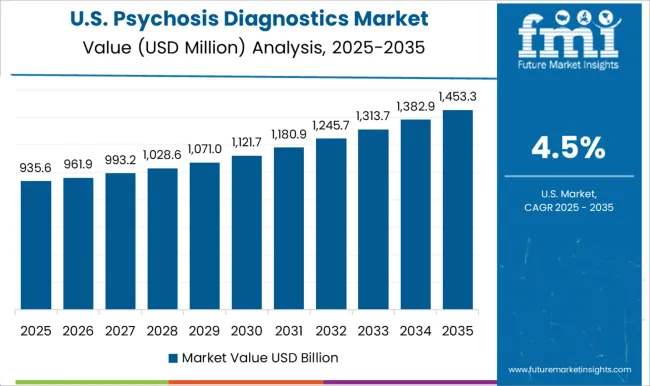
North America is a significant market for psychosis diagnostics due to factors such as the high prevalence of psychotic disorders, the availability of advanced healthcare infrastructure, and significant investment in research and development of new diagnostic tools and tests.
Driven by factors such as the increasing prevalence of psychotic disorders and the availability of advanced diagnostic technologies, the North America psychosis diagnostics market is expected to grow in the upcoming years. The market in North America is characterized by the presence of major players such as QIAGEN, F. Hoffmann-La Roche Ltd, and Siemens Healthineers, among others, who are investing in the development of new diagnostic tools and tests.
The market is also driven by government initiatives and funding for research and development of new diagnostic technologies and tools for psychotic disorders. For example, in 2020, the National Institute of Mental Health (NIMH) in the United States announced funding for research to improve the accuracy of diagnosis and treatment of psychotic disorders.
Overall, the North American psychosis diagnostics market is expected to continue to grow in the coming years, driven by factors such as increasing awareness of mental health disorders, advancements in diagnostic technologies, and growing demand for personalized and precision medicine. Thus, North America is expected to possess 44% market share for psychosis diagnostics market in 2025.
Technological advancements spurring the growth of psychosis diagnostics market in Europe
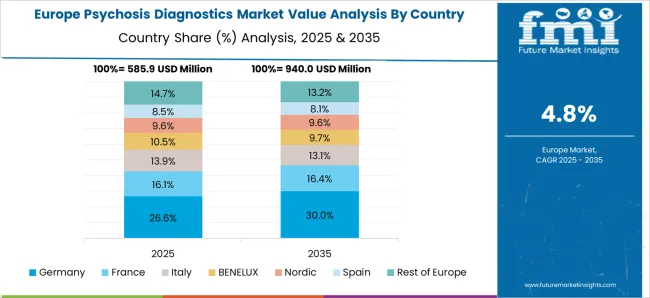
Europe is a significant market for psychosis diagnostics due to factors such as the high prevalence of psychotic disorders, increasing healthcare expenditure, and the availability of advanced healthcare infrastructure. The market is characterized by the presence of major players such as F. Hoffmann-La Roche Ltd, Siemens Healthineers, and Abbott Laboratories, among others, who are investing in the development of new diagnostic tools and tests.
The European Union is investing in research projects to develop new diagnostic tools and treatments for psychotic disorders. Overall, it is anticipated that the Europe market for psychosis diagnostics will witness growth in the upcoming years, propelled by factors like heightened awareness of mental health disorders, technological advancements in diagnostic methods, and an expanding need for individualized and accurate medical care.
Thus, Europe is expected to possess 38% market share for psychosis diagnostics market in 2025.
Adherence to quality standards boosting growth of hospital pharmacies for psychosis diagnostics
Hospital pharmacies often stock specialized medications that may be required for the treatment of psychotic disorders, including antipsychotic medications, mood stabilizers, and antidepressants. These medications may be difficult to obtain at retail pharmacies.
Hospital pharmacies may collaborate with mental health professionals to provide comprehensive care for patients with psychotic disorders. This collaboration can include consultations with psychiatrists, psychiatric pharmacists, and other mental health specialists to ensure that patients receive appropriate medication therapy.
Hospital pharmacies may have access to advanced diagnostic technologies, such as genetic testing and brain imaging, that can aid in the diagnosis and treatment of psychotic disorders. Hospital pharmacies may offer medication management services, such as medication therapy management and medication adherence counseling, which can be particularly important for patients with psychotic disorders who may require complex medication regimens.
Hospital pharmacies are subject to rigorous quality standards and regulatory requirements, which can provide assurance to patients that they are receiving high-quality care. thus, hospital pharmacies are expected to possess 43% market share for psychosis diagnostics market in 2025.
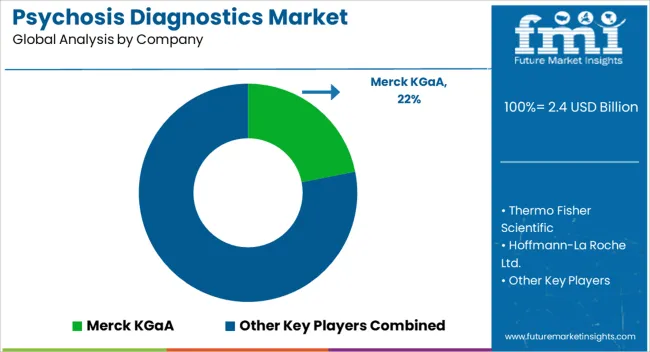
Key players in the psychosis diagnostics market are Merck KGaA, Thermo Fisher Scientific, Hoffmann-La Roche Ltd., Eli Lilly & Company, 3M Company, Teva Pharmaceutical Industries Ltd., GlaxoSmithKline plc, Pfizer, Inc., Sun Pharmaceutical Industries Ltd and Bausch Health
| Report Attribute | Details |
|---|---|
| Market Value in 2025 | USD 2.4 billion |
| Market Value in 2035 | USD 4.0 billion |
| Growth Rate | CAGR of 5.3% from 2025 to 2035 |
| Base Year for Estimation | 2025 |
| Historical Data | 2020 to 2025 |
| Forecast Period | 2025 to 2035 |
| Quantitative Units | Revenue in USD Billion and CAGR from 2025 to 2035 |
| Report Coverage | Revenue Forecast, Volume Forecast, Company Ranking, Competitive Landscape, Growth Factors, Trends and Pricing Analysis |
| Segments Covered | Drug Class, Treatment, Distribution Channel, Region |
| Regions Covered | North America; Latin America; Europe; South Asia; East Asia; Oceania; Middle East & Africa |
| Key Countries Profiled | USA, Canada, Brazil, Mexico, Rest of Latin America, Germany, United kingdom, France, Spain, Italy, Rest of Europe, India, Malaysia, Singapore, Thailand, Rest of South Asia, China, Japan, South Korea, Austria, New Zealand, GCC countries, South Africa, Israel, Rest of MEA |
| Key Companies Profiled | Merck KGaA; Thermo Fisher Scientific; Hoffmann-La Roche Ltd.; Eli Lilly & Company; 3M Company; Teva Pharmaceutical Industries Ltd.; GlaxoSmithKline plc; Pfizer, Inc.; Sun Pharmaceutical Industries Ltd.; Bausch Health |
| Customization | Available Upon Request |
The global psychosis diagnostics market is estimated to be valued at USD 2.4 billion in 2025.
The market size for the psychosis diagnostics market is projected to reach USD 4.0 billion by 2035.
The psychosis diagnostics market is expected to grow at a 5.3% CAGR between 2025 and 2035.
The key product types in psychosis diagnostics market are chlorpromazine, fluphenazine, haloperidol, loxapine, perphenazine and thioridazine.
In terms of treatment, rapid tranquilization segment to command 54.3% share in the psychosis diagnostics market in 2025.


Full Research Suite comprises of:
Market outlook & trends analysis
Interviews & case studies
Strategic recommendations
Vendor profiles & capabilities analysis
5-year forecasts
8 regions and 60+ country-level data splits
Market segment data splits
12 months of continuous data updates
DELIVERED AS:
PDF EXCEL ONLINE
DNA Diagnostics Market Growth - Trends & Forecast 2024 to 2034
HIV Diagnostics Market Overview - Trends & Forecast 2024 to 2034
Food Diagnostics Services Market Size, Growth, and Forecast for 2025–2035
Rabies Diagnostics Market Size and Share Forecast Outlook 2025 to 2035
Cancer Diagnostics Market Analysis - Size, Share and Forecast 2025 to 2035
Tissue Diagnostics Market Size and Share Forecast Outlook 2025 to 2035
Sepsis Diagnostics Market Growth - Trends & Forecast 2025 to 2035
Poultry Diagnostics Market - Demand, Growth & Forecast 2025 to 2035
Protein Diagnostics Market Share, Size and Forecast 2025 to 2035
In Vitro Diagnostics Market Insights - Trends & Forecast 2025 to 2035
Clinical Diagnostics Market Insights – Size, Share & Forecast 2025 to 2035
In-vitro Diagnostics Kit Market Growth & Forecast 2024-2034
Covid-19 Diagnostics Market – Demand, Growth & Forecast 2022-2032
In-Vitro Diagnostics Packaging Market
Connected Diagnostics Market Size and Share Forecast Outlook 2025 to 2035
Molecular Diagnostics In Pharmacogenomics Market Size and Share Forecast Outlook 2025 to 2035
Pneumonia Diagnostics Market Size and Share Forecast Outlook 2025 to 2035
The Companion Diagnostics Market is segmented by product, technology, application and end user from 2025 to 2035
Bacterial Diagnostics in Aquaculture Market Insights - Growth & Forecast 2025 to 2035
Cognitive Diagnostics Market Analysis & Forecast by Diagnosis, Indication, End User and Region through 2035

Thank you!
You will receive an email from our Business Development Manager. Please be sure to check your SPAM/JUNK folder too.
Chat With
MaRIA