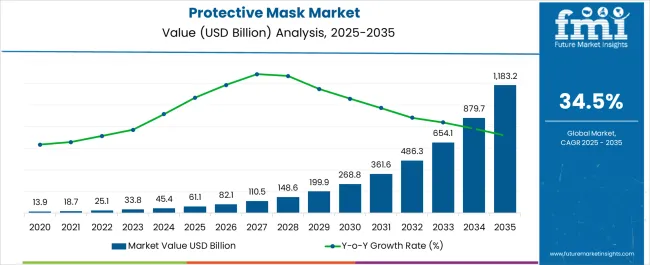
The Protective Mask Market is estimated to be valued at USD 61.1 billion in 2025 and is projected to reach USD 1183.2 billion by 2035, registering a compound annual growth rate (CAGR) of 34.5% over the forecast period.
| Metric | Value |
|---|---|
| Protective Mask Market Estimated Value in (2025 E) | USD 61.1 billion |
| Protective Mask Market Forecast Value in (2035 F) | USD 1183.2 billion |
| Forecast CAGR (2025 to 2035) | 34.5% |
The protective mask market is experiencing stable demand, supported by heightened public health awareness, occupational safety regulations, and persistent risks of airborne infections across healthcare and industrial settings. Regulatory mandates from health authorities and workplace safety bodies have played a critical role in the widespread institutional procurement of masks, while consumer demand has been sustained by changing hygiene behavior.
Innovation in filter efficiency, breathability, and skin-friendly materials is influencing product differentiation and brand adoption. The supply chain has evolved to support domestic sourcing and rapid-scale manufacturing, reducing dependency on global imports.
Moreover, rising concerns over air pollution and allergen exposure in urban environments are expanding the market beyond clinical use. Looking forward, adoption is expected to remain strong due to pandemic preparedness protocols, recurring respiratory outbreaks, and preventive health policies being institutionalized across several regions.
The market is segmented by Material Type, Type, Nature, End Use, and Distribution Channel and region. By Material Type, the market is divided into Polypropylene, Polyurethane, Polyester, Cotton, and Others. In terms of Type, the market is classified into Surgical, Respirator, Procedure, and Others. Based on Nature, the market is segmented into Disposable and Reusable. By End Use, the market is divided into Hospitals & Clinics, Industrial & Institutional, and Personal/Individual Protection. By Distribution Channel, the market is segmented into Pharmacy & Drug Stores, Supermarket & Hypermarket, Specialty Stores, and E-commerce. Regionally, the market is classified into North America, Latin America, Western Europe, Eastern Europe, Balkan & Baltic Countries, Russia & Belarus, Central Asia, East Asia, South Asia & Pacific, and the Middle East & Africa.
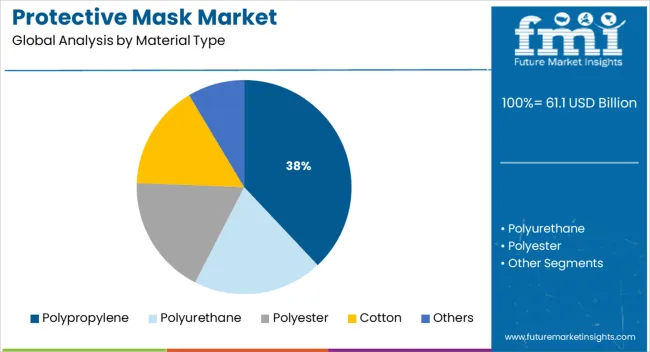
Polypropylene is projected to account for 38.0% of the total revenue share in the protective mask market by 2025, making it the leading material type. This dominance is being attributed to its superior filtration capabilities, cost-efficiency, and compatibility with melt-blown manufacturing methods.
The fiber’s electrostatic properties and structural integrity enhance particulate retention, making it ideal for multi-layered mask construction. Polypropylene's lightweight, non-woven format enables high production throughput and comfort during prolonged wear, which is critical in healthcare and industrial applications.
Its widespread availability and recyclability further contribute to its selection by manufacturers focused on both performance and environmental considerations. As demand grows for masks that meet regulatory standards while offering comfort and protection, polypropylene is expected to remain the preferred base material across disposable mask lines.
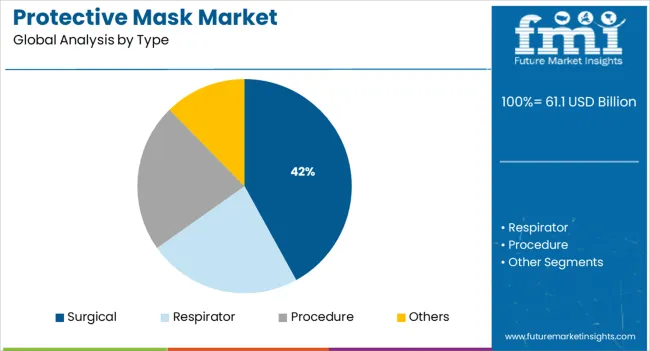
Surgical masks are expected to contribute 42.0% of the protective mask market’s revenue in 2025, establishing this segment as the dominant type. This lead is being driven by standardized adoption in healthcare environments, compliance with infection control protocols, and broad regulatory certification across regions.
Designed to provide barrier protection against fluid penetration and particulate inhalation, surgical masks offer a cost-effective solution for daily clinical use. Hospitals, clinics, and diagnostic centers continue to prioritize surgical masks due to their balance of filtration efficiency, disposability, and skin safety.
Advances in tie-on and ear-loop design, fluid resistance, and antimicrobial treatments are further strengthening their market position. With government bulk procurement, pandemic stockpiling initiatives, and consistent demand from medical institutions, surgical masks are anticipated to maintain a leading role within the protective equipment ecosystem.
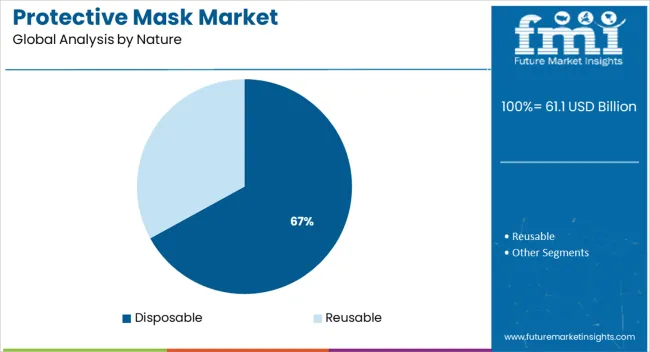
Disposable masks are projected to hold 67.0% of the market share by 2025, positioning them as the preferred choice based on product nature. This growth is being propelled by the convenience, hygiene assurance, and compliance benefits associated with single-use protective gear.
Disposable masks eliminate cross-contamination risk, reduce laundering and sterilization requirements, and are more readily certified under global health safety guidelines. Their adoption is particularly prevalent in environments where consistent protection and high turnover are necessary, such as hospitals, food processing units, and construction sites.
Manufacturers have responded with high-speed, automated production lines that deliver standardized output in bulk volumes. Additionally, disposable formats align with procurement norms in institutional tenders and emergency stock programs. Despite growing environmental concerns, the segment continues to dominate due to affordability, reliability, and end-user preference for ready-to-use, zero-maintenance protective solutions.
The pandemic has devastated the vast bulk of European countries. Nevertheless, due to the mask's wide emergence in dense population nations such as China and India, Asia Pacific is anticipated to expand quickly over the next few years, influencing facial mask usage and demand for protective masks in the region.
Asia Pacific is one of the industry leaders in hospital supplies such as face masks, which might offer trading opportunities. Asia Pacific manufacturers have a sizable client base, especially in China and India. China and India are two of the leading mask-producing countries, each with a substantial face mask advertising strategy.
Governments and non-governmental organizations (NGOs) are recommending protective face masks as the second wave approaches India and other emerging economies. Notably, guidelines issued by industry watchdogs such as the WHO have boded well for both accepted players and newcomers.
Because of their high efficacy, stakeholders are likely to expand the manufacturing of N95 respirators. A noticeable increase in N95 mask production in India and China has coincided with astounding demand from North America and Western Europe.
Major market players are making Research and Development investments to create higher-quality products with more characteristics. Furthermore, corporate entities are boosting strategic collaborations in a bid to expand Research and Development activities.
Face mask mandate and usage are anticipated to rise in the coming years due to innovation, population increase, face mask promotional campaigns, and validation. Business owners place a high value on broadening their service areas in order to increase their market percentage and income from protective masks.
Companies are committed to launching new items in order to meet consumers' needs. Among the leading companies in the protective face, masks industry are 3M, BSN Medical, Honeywell, Coltene, Cardinal Health, and Dentsply Sirona.
There has been a rise in public knowledge about the advantages of using protective face masks.
This is anticipated to fuel the demand for protective masks during the projected period. In addition, due to the unprecedented scope of the disaster, governments all over the world discovered that their emergency supplies were insufficient. This has resulted in an increase in government supply stockpiles to keep up the sales of protective face masks.
A surge in social media marketing drives the protective mask market. Many social media platforms have launched campaigns advocating the usage of face masks to foster a favorable attitude toward using them in the community to prevent the spread of the new coronavirus as a face mask marketing strategy.
Organizations such as the World Health Organization (WHO) and the Centers for Disease Control (CDC) recommend the usage of masks, the protective mask market size has seen an increase in demand from consumers.
Low-profit margins may function as a significant impediment to the market value of coronavirus faces masks over the predicted period. According to an article published by the Middle East North Africa Financial Network (MENAFN), the maximum profit margins of disposable face masks in retail shops were previously pegged at 23 percent. Still, the profit margin has been capped at 15 percent since it has become mandatory use for individuals.
This could limit the sales of protective masks. Furthermore, local producers in countries such as India and China would provide low-cost items, putting pricing pressure on global players. This could result in lower profit margins, which could affect the demand for protective masks on the market.
The unpredictable raw material prices are a major stumbling block to the expansion of the protective mask market share. The key raw resources required for the production of nonwoven materials, metal strips, and earloops for face masks are oil and metal.
Commodity price fluctuations have a significant impact on the cash flows and earnings of businesses in that ecosystem. This is projected to raise the cost of making protective mask filters, putting a damper on the surgical mask market.
For competitors in the protective mask market, emerging markets such as India, Brazil, China, and South Africa provide considerable prospects. The fast-growing elderly population, high patient volumes, rising per capita income, and greater awareness are all driving the need for improved healthcare services in these nations.
This has presented manufacturers with enormous potential for the expansion of masks and respirators.
One of the most often used nonwoven materials for face masks is polypropylene (PP), which is a polymer generated from oil. Due to the large initial investment required in heavy machinery such as hoppers, extruders, and melt spinning systems, PP electret melt-blown nonwoven is a specialist fabric produced by a few numbers of firms throughout the world.
These considerations make it difficult for newcomers to break into the protective mask market.
The protective mask market share is divided into healthcare, oil & gas, mining, construction, manufacturing, and other applications. The healthcare industry has the largest proportion of the global market.
Hospitals and clinics, manufacturing, and other end-use segments make up the industry. Hospitals and clinics are already at capacity as a result of the recent corona outbreak. As a result, as part of their human resource planning, they prioritize workplace health as a face mask business opportunity and employ these masks.
Concerns about COVID-19 spreading will drive up demand for protective masks. In 2024, procedure masks held 40.6 percent of the protective face mask market share. In addition, the increased demand from the general population to counteract the spread of coronavirus illness is likely to contribute to the segment's growth.
The protective mask market will expand as a result of the advantages associated with procedure masks. Furthermore, the masks' effectiveness in reducing the spread of the coronavirus is likely to affect product demand and propel the segment forward.
In terms of distribution channels, pharmacists had the highest market share in 2020.
The existence of pharmacies in both developed and developing nations has contributed to a greater face mask business opportunity. Furthermore, the adoption of face masks through pharmacies is expected to be driven by improvements in healthcare infrastructure and an increase in the number of customers visiting pharmacies.
In 2024, the North American market was valued at USD 6.88 billion. The global market was dominated by North America.
Protective mask filters are popular in North America. A growing client base, the biggest number of COVID-19 events, and a growing awareness of health and personal hygiene are driving the protective mask market in North America.
The coronavirus epidemic affecting many governments is predicted to boost demand in North America by encouraging people to practice good personal hygiene.
The pandemic has hit the majority of European countries hard. However, due to the quick acceptance of masks in densely populated nations such as China and India, Asia Pacific is predicted to grow rapidly in the next years, affecting facial mask consumption and demand for protective masks in the region.
Asia Pacific is one of the top makers of hospital supplies such as face masks, which would likely offer market prospects. Manufacturers in the Asia Pacific region have a significant customer base, particularly in China and India. China and India are two of the major mask-producing countries, with a significant face mask marketing strategy in place.
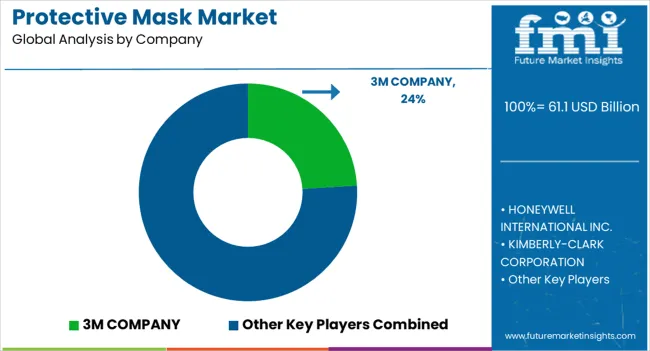
Market leaders are using a variety of growth methods to gain a larger proportion of the protective mask market share and raise their income. In order to tackle the COVID-19 illness, businesses are focusing on increasing the manufacture of coronavirus face masks.
Major market players are investing in research and development to produce higher-quality products with more features. In addition, corporations are pushing strategic collaborations in order to boost their Research and Development activities.
Face mask demand and consumption on the global market is predicted to expand in the coming years as a result of innovation, growth, face mask marketing ideas, and recognition. Businesses place a strong emphasis on expanding their service areas in order to increase the protective mask market share and income. Companies are committed to introducing new products to meet consumer demand.
Recent industry developments:
In September 2024, Angelini Group announced the start of large-scale and consistent surgical mask manufacture in Italy. In the Luxottica production center, four completely automated production lines were established, each specifically specialized for the production of COVID-19 prevention devices. The company's revenue will be greatly boosted as a result of the increased manufacturing capacity of masks & respirators, as well as its market position.
Honeywell stated in May 2024 that its covid mask production line in the United Kingdom would be expanded and that around 4.5 million face masks will be made and delivered to the United Kingdom government on a monthly basis. The move was made as part of the United Kingdom government's response to the country's scarcity of protective masks. The company's production capacity will be increased as a result of this plan.
The global protective mask market is estimated to be valued at USD 61.1 billion in 2025.
The market size for the protective mask market is projected to reach USD 1,183.2 billion by 2035.
The protective mask market is expected to grow at a 34.5% CAGR between 2025 and 2035.
The key product types in protective mask market are polypropylene, polyurethane, polyester, cotton, others, _flexible pvc, _pet, _rubber and _silicon.
In terms of type, surgical segment to command 42.0% share in the protective mask market in 2025.


Full Research Suite comprises of:
Market outlook & trends analysis
Interviews & case studies
Strategic recommendations
Vendor profiles & capabilities analysis
5-year forecasts
8 regions and 60+ country-level data splits
Market segment data splits
12 months of continuous data updates
DELIVERED AS:
PDF EXCEL ONLINE
Protective Glove Market Forecast Outlook 2025 to 2035
Protective Film Market Size and Share Forecast Outlook 2025 to 2035
Protective Earth Resistance Meter Market Size and Share Forecast Outlook 2025 to 2035
Protective Building Materials Market Size and Share Forecast Outlook 2025 to 2035
Protective Wrapping Paper Market Size and Share Forecast Outlook 2025 to 2035
Protective Packaging Market Analysis - Size, Share, and Forecast Outlook 2025 to 2035
Protective Packaging Industry Analysis in United States and Canada - Size, Share, and Forecast 2025 to 2035
Protective Clothing Market - Trends, Growth & Forecast 2025 to 2035
Protective Eyewear Market Trends – Industry Growth & Forecast 2025 to 2035
Market Share Distribution Among Protective Packaging Manufacturers
Market Share Insights of Leading Protective Textiles Providers
Protective Relay Market
Protective Footwear Market
Protective Films Tapes Market
Protective Gowns Market
Protective Goggles Market
ESD Protective Signage Labels Market Size and Share Forecast Outlook 2025 to 2035
Fire Protective Materials Market Size and Share Forecast Outlook 2025 to 2035
Sports Protective Equipment Market Size and Share Forecast Outlook 2025 to 2035
Medical Protective Equipment Market - Growth, Innovations & Forecast 2025 to 2035

Thank you!
You will receive an email from our Business Development Manager. Please be sure to check your SPAM/JUNK folder too.
Chat With
MaRIA