Processed Fruit and Vegetable Market Outlook from 2024 to 2034

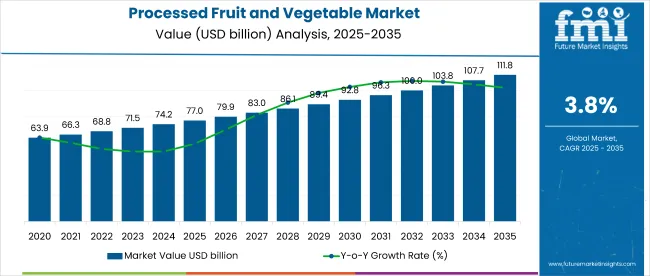
The processed fruit and vegetable market currently holds a valuation of USD 74,134.8 million in 2024. With more local and indigenous companies entering the industry, this valuation is ready to jump to USD 107,500.4 million by 2034, registering a CAGR of 3.8%.

The processed fruit and vegetable industry, in the limelight of sustainable production, processing, and packaging methods, is proliferating considerably. The World Health Organization’s recommendation of consuming at least 400 grams of fruits and vegetables has changed people’s eating habits on a daily basis.

Attributes Details
Processed Fruit and Vegetable Market Value for 2024 USD 74,134.8 million
Projected Market Value for 2034 USD 107,500.4 million
Value-based CAGR of the Market from 2024 to 2034 3.80%

Don't pay for what you don't need

Customize your report by selecting specific countries or regions and save 30%!

Processed Fruit and Vegetable Industry Analysis

  • The desire to include fruits and vegetables on the plate in the daily diet, especially among urban dwellers, is one of the main reasons for this market to flourish in the coming years.
  • With the proliferation of the internet and social media, the general population is getting to learn about a plethora of foreign fruits and vegetables. These vegetables, which can’t be grown domestically, need to be processed for export, aiding market growth.
  • Countries with unsuitable climatic conditions for horticulture also generate significant demand for processed fruits and vegetables to fulfill the nutritional needs of citizens while maintaining a diverse diet.
  • Manufacturers need to provide certain fruits and vegetables, such as mangoes, strawberries, avocados, dragon fruit, etc., throughout the year due to their unprecedented demand.
  • Corporatization of jobs, busy lifestyles, and urbanization have all led to a higher demand for ready-to-eat food options. This has pushed professionals living in urban settings to rely on processed fruits and vegetables to satisfy their cravings.

Restraining Factors Slowing Down the Market Growth of Processed Fruits and Vegetables

  • The general population is still hesitant to consume processed and packaged fruits and vegetables when they can get the same fruits by paying a little extra. There are still some concerns regarding the safety of these products in the minds of people.
  • The consumer base is also worried about the nutritional values of these processed fruits and vegetables. Despite the claims of brands in the market, the negative notion about the deterioration of nutrition, when processed, impedes consumption.
  • Use of harmful preservatives and chemicals to extend the shelf-life of certain fruits and vegetables has caused fatalities in the recent past. News like this affects consumption negatively, especially in countries where people are more health-conscious.
  • Social media influence, health-related advice by fitness nutrition experts, and the trend of eating organic fruits and vegetables are also proving to be a detrimental factor to the growth of this market.
Nandini Roy Choudhury

Principal Consultant

Talk to Analyst

Find your sweet spots for generating winning opportunities in this market.

What can the Companies do to solve these Problems?

  • Effective marketing and advertising strategies can generate trust regarding processed fruits and vegetables in the general population. For this, they can collaborate with people’s favorite nutrition experts to promote their offerings.
  • While packaging, companies can also make sure that precise nutritional values and ingredient lists are printed on the packet. This transparency has the potential to instill confidence about the products in the consumer base.
  • Companies can also embrace sustainable practices, right from procuring to processing and packaging of fruits and vegetables. This is going to attract a substantial amount of eco-conscious consumers toward the market.
  • Companies need to adhere to regulations provided by the authorities when it comes to using preservatives and additives during the processing methods. They can also use natural preservatives to mitigate the use of synthetic ones in their products.

Category-wise Insights

Processed Fruits Stand Out as the Top Choice among the Overall Populace

Attributes Details
Type Fruits
Market Share (2024) 52.30%

Processed fruits, for their longer shelf lives and all-year availability, are slated to hold 52.30% of the total market share in 2024. Processed fruits are in great demand, as compared to vegetables, thanks to the ongoing health and wellness trends in the general population, especially those living in urban settings.

Processing also ensures that consumers get to eat these fruits throughout the year. Transparent labeling and natural preservative practices can instill immense trust in consumers regarding processed fruits, aiding the overall growth of the market.

Frozen Fruits and Vegetables Bring Huge Revenue to the Industry

Attributes Details
Product Frozen
Market Share (2024) 25.60%

Freezing fruits and vegetables below their optimal storage temperature can help manufacturers retain their freshness. Frozen fruits and vegetables are accounted to hold a major chunk, i.e. 25.6%, of the global market.

Frozen fruits and vegetables offer almost the same amount of taste, texture, nutrition, and flavor to the consumers seeking on-the-go consumption without compromising on the quality. These fruits also are lighter on the pockets as compared to their fresh counterparts. This makes them a suitable choice for consumers on strict budgets or people who live with limited access to fresh produce.

Get the data you need at a Fraction of the cost

Personalize your report by choosing insights you need
and save 40%!

Country-wise Insights

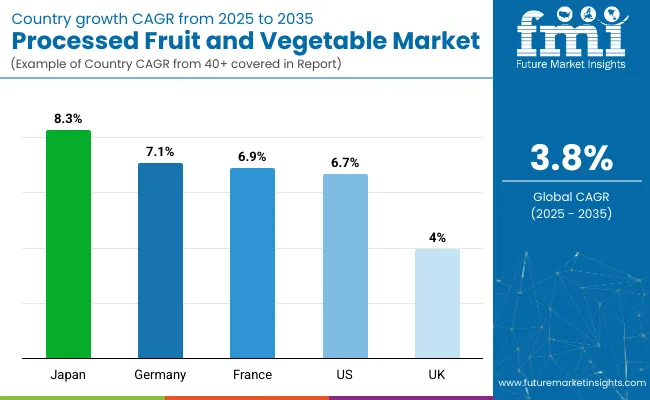
Processed fruits and vegetables are consumed all over the world. However, the market growth in countries like India, China, Germany, Japan, and the United States is better. Drawing from these statistics, it can be concluded that the demand for processed fruits and vegetables is relatively high in Asian countries. This can be attributed to their enormous population, emerging eCommerce platforms, large primary sector, and large-scale vegetarianism.

Countries CAGR (2024 to 2034)
India 8.60%
Japan 8.30%
China 7.90%
Germany 7.10%
United States 6.70%

Large-scale Availability to Benefit India’s Processed Fruit and Vegetable Market

The market in India is slated to develop at a CAGR of 8.60% during the forecasted period. India is blessed with diverse climatic conditions where a broad spectrum of fruits and vegetables are grown.

The nation is known for its mangoes, apples, grapes, bananas, strawberries, etc. in the international market. This abundant availability of fruits and vegetables creates a conducive environment for fruit and vegetable processing companies in the nation to curate innovative offerings.

Japan’s Processed Fruit and Vegetable Market to Profit from Import-oriented Demand

Japan is also one of the most lucrative countries in this market. It is very likely to progress at a CAGR of 8.30%. Japan, geographically, is a very small country with limited arable land for the cultivation of fruits and vegetables. This pushes Japan to import certain fruits and vegetables from the neighboring countries.

To tackle the problem of transportation time, these fruits and vegetables are often processed by keeping them in preservatives or by adding chemical additives in them. This extends the shelf-life of these products while substantially contributing to the growth of this market.

Enormous Primary Sector to Fuel China’s Processed Fruit and Vegetable Market

China, like India, also has a high population engaged in the primary sector. The market in China is set to progress at a 7.9% CAGR through 2034, showcasing the country’s conducive scope for players.

China is home to an enormous arable land and a substantial amount of the population is engaged in the primary sector. Due to these factors, surplus produce of fruits and vegetables is generated every year. With the growing veganism and the e-commerce boost, this produce is processed and marketed domestically and internationally.

Close Proximity to Mediterranean Countries to Elevate Market Growth in Germany

The market in Germany is also a promising one. It is slated to inflate at a CAGR of 7.1% through 2034, making it a highly lucrative pocket for producers of processed fruits and vegetables.

Germany’s geographical proximity to Mediterranean countries, like Spain, Italy, France, Tunisia, etc., which are some of the largest producers of fruits and vegetables in the world, facilitates high-quality and fresh raw materials for fruit processing. This proximity also reduces the transportation time, bringing fresh produce to these manufacturing units.

Germany’s sport-loving community also generates unprecedented demand for healthy and organic fruits and vegetables. This will bode well for the overall market performance.

Health-conscious Trends to Shape United States Processed Fruit and Vegetable Market

The United States is one of the most vibrant markets for processed fruits and vegetables. It is inclined to flourish at a CAGR of 6.7% through 2034.

The market in the United States is filled with companies that cater to the demands of a growing health-conscious and vegan populace. These companies also collaborate with fitness club chains to provide them with fresh fruits and vegetables.

The hospitality sector in the nation also generates huge demand for processed fruits and vegetables. The nation, every year, serves around 20 million tourists of different nationalities. Hotels and restaurants in the United States have to make sure that they have fruits and vegetables from each region on their menus.

Competitive Landscape

The processed fruit and vegetable market, when seen from the marketing point of view, is a much more mature one. Numerous local and international companies have had a strong foothold in the market.

Things have drastically changed with the advent of eCommerce platforms in emerging economies. These companies are directly supplying fruits and vegetables to supermarkets and food chains. For instance, Hessing Supervers, headquartered in Noord-Holland, Netherlands, is a company that offers a wide range of products including pre-cut vegetables, processed fruits, and meal salads, directly to supermarkets, fast food chains, wholesalers, catering companies, and inflight caterers.

Another company, Nile Agro Industries, is one of the largest companies in Egypt specializing in agricultural processing. The company concentrates on frozen vegetables, frozen fruits, juices, pickles, jams, olive oil, and vinegar.

Recent Developments

  • In March 2024, AgriNurture, Inc. completed its acquisition of Australian firm Freshness First Pty. Ltd. Nearly five years after initiating the process, ANI took full control of the company, previously announced in October 2018, with the deal finalizing for USD 0.65.
  • In November 2023, Saudi Arabia witnessed the establishment of a joint venture between NADEC and Del Monte aimed at increasing fresh commodities production and distribution. NADEC secured a 37.5% stake in the new company, which specialized in various goods, including fruits, vegetables, and juices.

Key Companies

  • Kellogg NA Co.
  • Bühler
  • Welch's
  • Sysco Corporation
  • Mott's LLP
  • Krones AG
  • Bonduelle
  • USA Foods
  • Dole Foods
  • Jr. Simplot

Key Coverage in the Processed Fruit and Vegetable Market
  • Opportunity Available in the Dehydrated Fruits and Vegetables Market
  • Competitive Analysis of the Fruit and Vegetable Processing Industry
  • Overview of Canned Fruits and Vegetables Market
  • Emerging Trends in Frozen Fruits and Vegetables
  • Impact of Value-added Fruits and Vegetables Market

Key Segments Covered in the Processed Fruit and Vegetable Market

By Type:

  • Fruits
  • Vegetables

By Processing Equipment:

  • Processing
  • Pre-processing
  • Seasoning
  • Washing
  • Filling
  • Packaging

By Product:

  • Fresh
  • Canned
  • Fresh-Cut
  • Drying & Dehydration
  • Frozen

By Region:

  • North America
  • Latin America
  • Europe
  • Asia Pacific
  • Middle East and Africa

Frequently Asked Questions

How Much is the Processed Fruit and Vegetable Market Currently Worth?

The processed fruit and vegetable market is valued at USD 74,134.8 million in 2024.

What is the Sales Forecast for Processed Fruits and Vegetables through 2034?

The processed fruit and vegetable market is expected to reach USD 107,500.4 million by 2034.

At What Rate is the Processed Fruit and Vegetable Market Growing?

The processed fruit and vegetable market is developing at a CAGR of 3.80% through 2034.

Which are the Key Companies in the Processed Fruit and Vegetable Market?

Kellogg NA Co., Bühler, Welch's, Sysco Corporation, Mott's LLP, Krones AG, Bonduelle, USA Foods, Dole Foods, Jr. Simplot, etc., are some top players in the processed fruit and vegetable market.

What was the Overall Value of the Processed Fruit and Vegetables Market in 2019?

The valuation of the processed fruits and vegetables market in 2019 was USD 63,700 million.

Table of Content

1. Executive Summary

    1.1. Global Market Outlook

    1.2. Demand-side Trends

    1.3. Supply-side Trends

    1.4. Technology Roadmap Analysis

    1.5. Analysis and Recommendations

2. Market Overview

    2.1. Market Coverage / Taxonomy

    2.2. Market Definition / Scope / Limitations

3. Market Background

    3.1. Market Dynamics

        3.1.1. Drivers

        3.1.2. Restraints

        3.1.3. Opportunity

        3.1.4. Trends

    3.2. Scenario Forecast

        3.2.1. Demand in Optimistic Scenario

        3.2.2. Demand in Likely Scenario

        3.2.3. Demand in Conservative Scenario

    3.3. Opportunity Map Analysis

    3.4. Product Life Cycle Analysis

    3.5. Supply Chain Analysis

        3.5.1. Supply Side Participants and their Roles

            3.5.1.1. Manufacturer

            3.5.1.2. Mid-Level Participants (Traders)

            3.5.1.3. Wholesalers and Distributors

        3.5.2. Value Added and Value Created at Node in the Supply Chain

        3.5.3. List of Raw Material Suppliers

        3.5.4. List of Existing and Potential Buyer’s

    3.6. Investment Feasibility Matrix

    3.7. Value Chain Analysis

        3.7.1. Profit Margin Analysis

        3.7.2. Wholesalers and Distributors

        3.7.3. Retailers

    3.8. PESTLE and Porter’s Analysis

    3.9. Regulatory Landscape

        3.9.1. By Key Regions

        3.9.2. By Key Countries

    3.10. Regional Parent Market Outlook

    3.11. Production and Consumption Statistics

    3.12. Import and Export Statistics

4. Global Market Analysis 2019 to 2023 and Forecast, 2024 to 2034

    4.1. Historical Market Size Value (US$ Million) & Volume (Units) Analysis, 2019 to 2023

    4.2. Current and Future Market Size Value (US$ Million) & Volume (Units) Projections, 2024 to 2034

        4.2.1. Y-o-Y Growth Trend Analysis

        4.2.2. Absolute $ Opportunity Analysis

5. Global Market Analysis 2019 to 2023 and Forecast 2024 to 2034, By Capacity

    5.1. Introduction / Key Findings

    5.2. Historical Market Size Value (US$ Million) & Volume (Units) Analysis By Capacity, 2019 to 2023

    5.3. Current and Future Market Size Value (US$ Million) & Volume (Units) Analysis and Forecast By Capacity, 2024 to 2034

        5.3.1. Less Than 100 ML

        5.3.2. 101 ML to 250 ML

        5.3.3. 251 ML to 500 ML

        5.3.4. More Than 500 ML

    5.4. Y-o-Y Growth Trend Analysis By Capacity, 2019 to 2023

    5.5. Absolute $ Opportunity Analysis By Capacity, 2024 to 2034

6. Global Market Analysis 2019 to 2023 and Forecast 2024 to 2034, By End Use

    6.1. Introduction / Key Findings

    6.2. Historical Market Size Value (US$ Million) & Volume (Units) Analysis By End Use, 2019 to 2023

    6.3. Current and Future Market Size Value (US$ Million) & Volume (Units) Analysis and Forecast By End Use, 2024 to 2034

        6.3.1. Food & Beverage

        6.3.2. Cosmetics & Personal Care

        6.3.3. Pharmaceutical

        6.3.4. Consumer Durables

    6.4. Y-o-Y Growth Trend Analysis By End Use, 2019 to 2023

    6.5. Absolute $ Opportunity Analysis By End Use, 2024 to 2034

7. Global Market Analysis 2019 to 2023 and Forecast 2024 to 2034, By Distribution Channel

    7.1. Introduction / Key Findings

    7.2. Historical Market Size Value (US$ Million) & Volume (Units) Analysis By Distribution Channel, 2019 to 2023

    7.3. Current and Future Market Size Value (US$ Million) & Volume (Units) Analysis and Forecast By Distribution Channel, 2024 to 2034

        7.3.1. Online

        7.3.2. Offline

    7.4. Y-o-Y Growth Trend Analysis By Distribution Channel, 2019 to 2023

    7.5. Absolute $ Opportunity Analysis By Distribution Channel, 2024 to 2034

8. Global Market Analysis 2019 to 2023 and Forecast 2024 to 2034, By Region

    8.1. Introduction

    8.2. Historical Market Size Value (US$ Million) & Volume (Units) Analysis By Region, 2019 to 2023

    8.3. Current Market Size Value (US$ Million) & Volume (Units) Analysis and Forecast By Region, 2024 to 2034

        8.3.1. North America

        8.3.2. Latin America

        8.3.3. Western Europe

        8.3.4. Eastern Europe

        8.3.5. South Asia and Pacific

        8.3.6. East Asia

        8.3.7. Middle East and Africa

    8.4. Market Attractiveness Analysis By Region

9. North America Market Analysis 2019 to 2023 and Forecast 2024 to 2034, By Country

    9.1. Historical Market Size Value (US$ Million) & Volume (Units) Trend Analysis By Market Taxonomy, 2019 to 2023

    9.2. Market Size Value (US$ Million) & Volume (Units) Forecast By Market Taxonomy, 2024 to 2034

        9.2.1. By Country

            9.2.1.1. USA

            9.2.1.2. Canada

        9.2.2. By Capacity

        9.2.3. By End Use

        9.2.4. By Distribution Channel

    9.3. Market Attractiveness Analysis

        9.3.1. By Country

        9.3.2. By Capacity

        9.3.3. By End Use

        9.3.4. By Distribution Channel

    9.4. Key Takeaways

10. Latin America Market Analysis 2019 to 2023 and Forecast 2024 to 2034, By Country

    10.1. Historical Market Size Value (US$ Million) & Volume (Units) Trend Analysis By Market Taxonomy, 2019 to 2023

    10.2. Market Size Value (US$ Million) & Volume (Units) Forecast By Market Taxonomy, 2024 to 2034

        10.2.1. By Country

            10.2.1.1. Brazil

            10.2.1.2. Mexico

            10.2.1.3. Rest of Latin America

        10.2.2. By Capacity

        10.2.3. By End Use

        10.2.4. By Distribution Channel

    10.3. Market Attractiveness Analysis

        10.3.1. By Country

        10.3.2. By Capacity

        10.3.3. By End Use

        10.3.4. By Distribution Channel

    10.4. Key Takeaways

11. Western Europe Market Analysis 2019 to 2023 and Forecast 2024 to 2034, By Country

    11.1. Historical Market Size Value (US$ Million) & Volume (Units) Trend Analysis By Market Taxonomy, 2019 to 2023

    11.2. Market Size Value (US$ Million) & Volume (Units) Forecast By Market Taxonomy, 2024 to 2034

        11.2.1. By Country

            11.2.1.1. Germany

            11.2.1.2. UK

            11.2.1.3. France

            11.2.1.4. Spain

            11.2.1.5. Italy

            11.2.1.6. Rest of Western Europe

        11.2.2. By Capacity

        11.2.3. By End Use

        11.2.4. By Distribution Channel

    11.3. Market Attractiveness Analysis

        11.3.1. By Country

        11.3.2. By Capacity

        11.3.3. By End Use

        11.3.4. By Distribution Channel

    11.4. Key Takeaways

12. Eastern Europe Market Analysis 2019 to 2023 and Forecast 2024 to 2034, By Country

    12.1. Historical Market Size Value (US$ Million) & Volume (Units) Trend Analysis By Market Taxonomy, 2019 to 2023

    12.2. Market Size Value (US$ Million) & Volume (Units) Forecast By Market Taxonomy, 2024 to 2034

        12.2.1. By Country

            12.2.1.1. Poland

            12.2.1.2. Russia

            12.2.1.3. Czech Republic

            12.2.1.4. Romania

            12.2.1.5. Rest of Eastern Europe

        12.2.2. By Capacity

        12.2.3. By End Use

        12.2.4. By Distribution Channel

    12.3. Market Attractiveness Analysis

        12.3.1. By Country

        12.3.2. By Capacity

        12.3.3. By End Use

        12.3.4. By Distribution Channel

    12.4. Key Takeaways

13. South Asia and Pacific Market Analysis 2019 to 2023 and Forecast 2024 to 2034, By Country

    13.1. Historical Market Size Value (US$ Million) & Volume (Units) Trend Analysis By Market Taxonomy, 2019 to 2023

    13.2. Market Size Value (US$ Million) & Volume (Units) Forecast By Market Taxonomy, 2024 to 2034

        13.2.1. By Country

            13.2.1.1. India

            13.2.1.2. Bangladesh

            13.2.1.3. Australia

            13.2.1.4. New Zealand

            13.2.1.5. Rest of South Asia and Pacific

        13.2.2. By Capacity

        13.2.3. By End Use

        13.2.4. By Distribution Channel

    13.3. Market Attractiveness Analysis

        13.3.1. By Country

        13.3.2. By Capacity

        13.3.3. By End Use

        13.3.4. By Distribution Channel

    13.4. Key Takeaways

14. East Asia Market Analysis 2019 to 2023 and Forecast 2024 to 2034, By Country

    14.1. Historical Market Size Value (US$ Million) & Volume (Units) Trend Analysis By Market Taxonomy, 2019 to 2023

    14.2. Market Size Value (US$ Million) & Volume (Units) Forecast By Market Taxonomy, 2024 to 2034

        14.2.1. By Country

            14.2.1.1. China

            14.2.1.2. Japan

            14.2.1.3. South Korea

        14.2.2. By Capacity

        14.2.3. By End Use

        14.2.4. By Distribution Channel

    14.3. Market Attractiveness Analysis

        14.3.1. By Country

        14.3.2. By Capacity

        14.3.3. By End Use

        14.3.4. By Distribution Channel

    14.4. Key Takeaways

15. Middle East and Africa Market Analysis 2019 to 2023 and Forecast 2024 to 2034, By Country

    15.1. Historical Market Size Value (US$ Million) & Volume (Units) Trend Analysis By Market Taxonomy, 2019 to 2023

    15.2. Market Size Value (US$ Million) & Volume (Units) Forecast By Market Taxonomy, 2024 to 2034

        15.2.1. By Country

            15.2.1.1. GCC Countries

            15.2.1.2. South Africa

            15.2.1.3. Israel

            15.2.1.4. Rest of MEA

        15.2.2. By Capacity

        15.2.3. By End Use

        15.2.4. By Distribution Channel

    15.3. Market Attractiveness Analysis

        15.3.1. By Country

        15.3.2. By Capacity

        15.3.3. By End Use

        15.3.4. By Distribution Channel

    15.4. Key Takeaways

16. Key Countries Market Analysis

    16.1. USA

        16.1.1. Pricing Analysis

        16.1.2. Market Share Analysis, 2023

            16.1.2.1. By Capacity

            16.1.2.2. By End Use

            16.1.2.3. By Distribution Channel

    16.2. Canada

        16.2.1. Pricing Analysis

        16.2.2. Market Share Analysis, 2023

            16.2.2.1. By Capacity

            16.2.2.2. By End Use

            16.2.2.3. By Distribution Channel

    16.3. Brazil

        16.3.1. Pricing Analysis

        16.3.2. Market Share Analysis, 2023

            16.3.2.1. By Capacity

            16.3.2.2. By End Use

            16.3.2.3. By Distribution Channel

    16.4. Mexico

        16.4.1. Pricing Analysis

        16.4.2. Market Share Analysis, 2023

            16.4.2.1. By Capacity

            16.4.2.2. By End Use

            16.4.2.3. By Distribution Channel

    16.5. Germany

        16.5.1. Pricing Analysis

        16.5.2. Market Share Analysis, 2023

            16.5.2.1. By Capacity

            16.5.2.2. By End Use

            16.5.2.3. By Distribution Channel

    16.6. UK

        16.6.1. Pricing Analysis

        16.6.2. Market Share Analysis, 2023

            16.6.2.1. By Capacity

            16.6.2.2. By End Use

            16.6.2.3. By Distribution Channel

    16.7. France

        16.7.1. Pricing Analysis

        16.7.2. Market Share Analysis, 2023

            16.7.2.1. By Capacity

            16.7.2.2. By End Use

            16.7.2.3. By Distribution Channel

    16.8. Spain

        16.8.1. Pricing Analysis

        16.8.2. Market Share Analysis, 2023

            16.8.2.1. By Capacity

            16.8.2.2. By End Use

            16.8.2.3. By Distribution Channel

    16.9. Italy

        16.9.1. Pricing Analysis

        16.9.2. Market Share Analysis, 2023

            16.9.2.1. By Capacity

            16.9.2.2. By End Use

            16.9.2.3. By Distribution Channel

    16.10. Poland

        16.10.1. Pricing Analysis

        16.10.2. Market Share Analysis, 2023

            16.10.2.1. By Capacity

            16.10.2.2. By End Use

            16.10.2.3. By Distribution Channel

    16.11. Russia

        16.11.1. Pricing Analysis

        16.11.2. Market Share Analysis, 2023

            16.11.2.1. By Capacity

            16.11.2.2. By End Use

            16.11.2.3. By Distribution Channel

    16.12. Czech Republic

        16.12.1. Pricing Analysis

        16.12.2. Market Share Analysis, 2023

            16.12.2.1. By Capacity

            16.12.2.2. By End Use

            16.12.2.3. By Distribution Channel

    16.13. Romania

        16.13.1. Pricing Analysis

        16.13.2. Market Share Analysis, 2023

            16.13.2.1. By Capacity

            16.13.2.2. By End Use

            16.13.2.3. By Distribution Channel

    16.14. India

        16.14.1. Pricing Analysis

        16.14.2. Market Share Analysis, 2023

            16.14.2.1. By Capacity

            16.14.2.2. By End Use

            16.14.2.3. By Distribution Channel

    16.15. Bangladesh

        16.15.1. Pricing Analysis

        16.15.2. Market Share Analysis, 2023

            16.15.2.1. By Capacity

            16.15.2.2. By End Use

            16.15.2.3. By Distribution Channel

    16.16. Australia

        16.16.1. Pricing Analysis

        16.16.2. Market Share Analysis, 2023

            16.16.2.1. By Capacity

            16.16.2.2. By End Use

            16.16.2.3. By Distribution Channel

    16.17. New Zealand

        16.17.1. Pricing Analysis

        16.17.2. Market Share Analysis, 2023

            16.17.2.1. By Capacity

            16.17.2.2. By End Use

            16.17.2.3. By Distribution Channel

    16.18. China

        16.18.1. Pricing Analysis

        16.18.2. Market Share Analysis, 2023

            16.18.2.1. By Capacity

            16.18.2.2. By End Use

            16.18.2.3. By Distribution Channel

    16.19. Japan

        16.19.1. Pricing Analysis

        16.19.2. Market Share Analysis, 2023

            16.19.2.1. By Capacity

            16.19.2.2. By End Use

            16.19.2.3. By Distribution Channel

    16.20. South Korea

        16.20.1. Pricing Analysis

        16.20.2. Market Share Analysis, 2023

            16.20.2.1. By Capacity

            16.20.2.2. By End Use

            16.20.2.3. By Distribution Channel

    16.21. GCC Countries

        16.21.1. Pricing Analysis

        16.21.2. Market Share Analysis, 2023

            16.21.2.1. By Capacity

            16.21.2.2. By End Use

            16.21.2.3. By Distribution Channel

    16.22. South Africa

        16.22.1. Pricing Analysis

        16.22.2. Market Share Analysis, 2023

            16.22.2.1. By Capacity

            16.22.2.2. By End Use

            16.22.2.3. By Distribution Channel

    16.23. Israel

        16.23.1. Pricing Analysis

        16.23.2. Market Share Analysis, 2023

            16.23.2.1. By Capacity

            16.23.2.2. By End Use

            16.23.2.3. By Distribution Channel

17. Market Structure Analysis

    17.1. Competition Dashboard

    17.2. Competition Benchmarking

    17.3. Market Share Analysis of Top Players

        17.3.1. By Regional

        17.3.2. By Capacity

        17.3.3. By End Use

        17.3.4. By Distribution Channel

18. Competition Analysis

    18.1. Competition Deep Dive

        18.1.1. Bottle Up

            18.1.1.1. Overview

            18.1.1.2. Product Portfolio

            18.1.1.3. Profitability by Market Segments

            18.1.1.4. Sales Footprint

            18.1.1.5. Strategy Overview

                18.1.1.5.1. Marketing Strategy

                18.1.1.5.2. Product Strategy

                18.1.1.5.3. Channel Strategy

        18.1.2. Worthy

            18.1.2.1. Overview

            18.1.2.2. Product Portfolio

            18.1.2.3. Profitability by Market Segments

            18.1.2.4. Sales Footprint

            18.1.2.5. Strategy Overview

                18.1.2.5.1. Marketing Strategy

                18.1.2.5.2. Product Strategy

                18.1.2.5.3. Channel Strategy

        18.1.3. BE O Lifestyle

            18.1.3.1. Overview

            18.1.3.2. Product Portfolio

            18.1.3.3. Profitability by Market Segments

            18.1.3.4. Sales Footprint

            18.1.3.5. Strategy Overview

                18.1.3.5.1. Marketing Strategy

                18.1.3.5.2. Product Strategy

                18.1.3.5.3. Channel Strategy

        18.1.4. LYSPACKAGING

            18.1.4.1. Overview

            18.1.4.2. Product Portfolio

            18.1.4.3. Profitability by Market Segments

            18.1.4.4. Sales Footprint

            18.1.4.5. Strategy Overview

                18.1.4.5.1. Marketing Strategy

                18.1.4.5.2. Product Strategy

                18.1.4.5.3. Channel Strategy

        18.1.5. Berry Global Inc.

            18.1.5.1. Overview

            18.1.5.2. Product Portfolio

            18.1.5.3. Profitability by Market Segments

            18.1.5.4. Sales Footprint

            18.1.5.5. Strategy Overview

                18.1.5.5.1. Marketing Strategy

                18.1.5.5.2. Product Strategy

                18.1.5.5.3. Channel Strategy

        18.1.6. SHENZHEN UNIQUE PACK CO., LTD.

            18.1.6.1. Overview

            18.1.6.2. Product Portfolio

            18.1.6.3. Profitability by Market Segments

            18.1.6.4. Sales Footprint

            18.1.6.5. Strategy Overview

                18.1.6.5.1. Marketing Strategy

                18.1.6.5.2. Product Strategy

                18.1.6.5.3. Channel Strategy

        18.1.7. Reyoung Corp.

            18.1.7.1. Overview

            18.1.7.2. Product Portfolio

            18.1.7.3. Profitability by Market Segments

            18.1.7.4. Sales Footprint

            18.1.7.5. Strategy Overview

                18.1.7.5.1. Marketing Strategy

                18.1.7.5.2. Product Strategy

                18.1.7.5.3. Channel Strategy

        18.1.8. The Natural Bottle

            18.1.8.1. Overview

            18.1.8.2. Product Portfolio

            18.1.8.3. Profitability by Market Segments

            18.1.8.4. Sales Footprint

            18.1.8.5. Strategy Overview

                18.1.8.5.1. Marketing Strategy

                18.1.8.5.2. Product Strategy

                18.1.8.5.3. Channel Strategy

        18.1.9. Suzhou Fomalhaut Eco-Pack Material Tech Co., Ltd.

            18.1.9.1. Overview

            18.1.9.2. Product Portfolio

            18.1.9.3. Profitability by Market Segments

            18.1.9.4. Sales Footprint

            18.1.9.5. Strategy Overview

                18.1.9.5.1. Marketing Strategy

                18.1.9.5.2. Product Strategy

                18.1.9.5.3. Channel Strategy

        18.1.10. Eurobottle

            18.1.10.1. Overview

            18.1.10.2. Product Portfolio

            18.1.10.3. Profitability by Market Segments

            18.1.10.4. Sales Footprint

            18.1.10.5. Strategy Overview

                18.1.10.5.1. Marketing Strategy

                18.1.10.5.2. Product Strategy

                18.1.10.5.3. Channel Strategy

19. Assumptions & Acronyms Used

20. Research Methodology

Recommendations

Food and Beverage

IQF Fruits & Vegetables Market

August 2024

REP-GB-913

250 pages

Food and Beverage

Fruit Concentrate Puree Market

March 2024

REP-GB-102

338 pages

Food and Beverage

Frozen Fruits and Vegetables Market

February 2023

REP-GB-16656

324 pages

Food and Beverage

Canned Fruits Market

December 2022

REP-GB-15983

324 pages

Explore Food and Beverage Insights

View Reports
Future Market Insights

Processed Fruit and Vegetable Market

Schedule a Call