Printed Labels Market Outlook

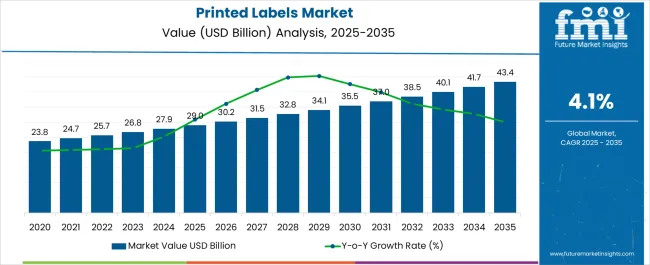
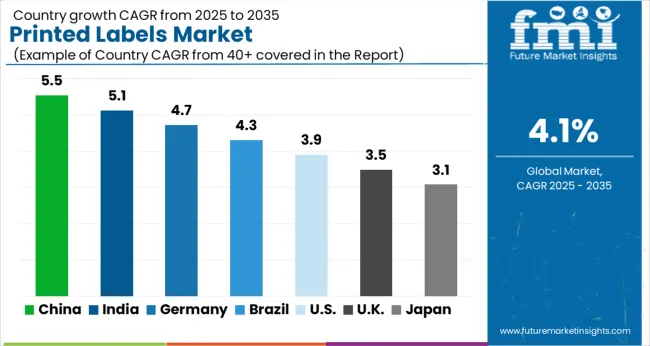
The global printed labels market size is projected to be worth US$ 26.8 Billion in 2023. The market is likely to surpass US$ 40.1 Billion by 2033 at a CAGR of 4.1% during the forecast period.

The printed labels market apart is the growing demand for interactive and smart labels. These labels incorporate technologies like Near Field Communication (NFC), QR codes, and augmented reality to provide consumers with interactive experiences, product authentication, and additional information. With a simple scan or tap, consumers can access product details, promotional offers, or even personalized content, enhancing their overall engagement and interaction with the brand. This innovative use of technology in printed labels not only adds value to the consumer experience but also offers brands new opportunities for data collection, consumer insights, and targeted marketing strategies.

With increasing awareness about environmental concerns, consumers and businesses alike are seeking labels made from recycled materials or those that are biodegradable and compostable. This shift towards sustainable labeling has prompted manufacturers to invest in innovative printing technologies and materials that meet these eco-friendly criteria. With consumers seeking unique and tailored experiences, brands are leveraging digital printing techniques to create labels that stand out on the shelves. Digital printing enables cost-effective short runs, variable data printing, and quick turnaround times, allowing businesses to efficiently produce customized labels with vibrant colors, intricate designs, and even personalized messages. This trend has opened up opportunities for smaller businesses and niche markets to enter the label printing industry.

Driving Factors Propelling the Demand for Printed Labels Include:

  • Industries combating counterfeiting and ensuring product traceability are adopting serialized and track-and-trace labels with unique identifiers like barcodes or QR codes to monitor and verify product movement throughout the supply chain.
  • The rising popularity of smart labels, equipped with technologies like RFID, NFC, or sensors, allows for functionalities such as real-time monitoring, temperature tracking, expiration date management, and interactive consumer engagement.
  • Different sectors, such as healthcare, logistics, and retail, have unique labeling needs, such as tamper-evident labels, freezer-grade labels, or labels resistant to harsh environmental conditions, driving the demand for specialized label solutions.
  • The growing economies and expanding industries in regions like Asia-Pacific and Latin America are driving the demand for printed labels across various sectors, including consumer goods, automotive, and electronics.
  • Advancements in printing technologies, such as digital printing, allow for cost-effective short runs, quick turnaround times, and high-quality printing, further driving the demand for printed labels.

Major Restraint Factors Holding Back the Printed Labels Market:

  • The increasing digitalization of information and the emergence of e-labeling alternatives can pose a restraint to the printed labels market.
  • Some types of printed labels, such as those with time-sensitive information or perishable content like variable data, have a limited shelf life. This limitation can lead to inventory management challenges and potential waste if labels become outdated or unusable.
  • Fluctuations in the prices of raw materials, such as inks, adhesives, and label substrates, can impact the profitability of printed label manufacturers. Price volatility adds uncertainty to cost calculations and can affect pricing strategies and margins.

Parallel Growth Opportunities Are Witnessing for Market Growth:

  • The integration of printed labels with intelligent packaging technologies opens up new growth opportunities. By incorporating sensors, indicators, or interactive elements into labels, businesses can provide real-time product information, enhance consumer engagement, and enable supply chain visibility.
  • The healthcare and pharmaceutical sectors present significant growth opportunities for smart labels. Smart labels can assist in medication adherence, temperature monitoring during transportation, and counterfeit prevention, thereby ensuring patient safety and regulatory compliance.
  • The rise in personalized nutrition and dietary requirements offers growth potential for printed labels. Labels that incorporate personalized nutritional information, allergen alerts, or dietary guidelines can help consumers make informed choices and cater to their individual needs.
  • The increasing focus on sustainability creates opportunities for printed labels made from eco-friendly materials, such as recycled or biodegradable options.
  • Continued advancements in digital printing technologies provide growth opportunities for the printed labels market. High-speed digital printers, improved color accuracy, and compatibility with a wide range of label materials enable efficient customization and information, shorter print runs, and faster time-to-market.

Latest Key Trends Propelling in Printed Labels Market:

  • Printed labels are being used as a platform for on-pack digital marketing initiatives. Brands incorporate QR codes, promotional hashtags, or social media handles on labels to encourage consumers to engage with them online, share experiences, and participate in brand campaigns.
  • Minimalistic and clean label designs are gaining traction, particularly in the food and beverage industry. These labels feature simple typography, clear product information, and uncluttered visuals, appealing to consumers seeking transparency and a clean aesthetic.
  • The integration of smart packaging elements, such as sensors or indicators, with printed labels is on the rise. These labels enable functionalities such as temperature monitoring, freshness indicators, or product authentication, enhancing product safety, quality, and consumer trust.
  • AR labels are gaining popularity as an innovative way to engage consumers. By scanning a label with a smartphone or a dedicated app, users can access interactive digital content, such as product information, videos, or games, creating an immersive and memorable brand experience.
Attribute Details
Printed Labels Market Size (2023) US$ 26.8 billion
Printed Labels Market Projected Size (2033) US$ 40.1 billion
Value CAGR (2023 to 2033) 4.1%

Don't pay for what you don't need

Customize your report by selecting specific countries or regions and save 30%!

2018 to 2022 Global Printed Labels Market Demand Outlook Compared to 2023 to 2033 Forecast

From 2018 to 2022, the global printed labels market experienced a CAGR of 2.1%, reaching a market size of US$ 25.8 billion in 2023.

The historic demand outlook for the printed labels market has witnessed significant growth and transformation over the years. The significance of visually appealing and informative labels to attract and engage consumers and this led to a growing demand for high-quality, eye-catching labels that could effectively communicate product attributes, branding elements, and regulatory information. With the proliferation of supermarkets, department stores, and e-commerce platforms, the need for clear and visually striking labels became crucial for product identification and differentiation. The retail boom, particularly in emerging markets, fuelled the demand for printed labels across a wide range of industries, including food and beverages, personal care, pharmaceuticals, and consumer electronics.

Future Market Outlook Global Printed Labels Market

The future market outlook for the global printed labels industry is highly promising, with the increasing demand for sustainable labeling solutions. The shift towards sustainability presents a significant opportunity for the printed labels industry to develop and offer labels made from recycled materials, biodegradable substrates, and other environmentally friendly alternatives. The rise of smart packaging, Internet of Things (IoT) devices, and augmented reality (AR) is expected to revolutionize the way labels are used and interacted with. Labels equipped with sensors, RFID tags enabling real-time tracking, product authentication, and interactive experiences for consumers. These innovations will enhance supply chain visibility, improve product safety, and create engaging brand experiences, contributing to the overall growth of the printed labels industry.
Ismail Sutaria
Ismail Sutaria

Principal Consultant

Talk to Analyst

Find your sweet spots for generating winning opportunities in this market.

Country-wise Insights

The United States to Account Significant Market Share in Printed Labels Market

Country USA
Market Size (US$ billion) by End of Forecast Period (2033) US$ 11.2 billion
CAGR % 2023 to End of Forecast (2033) 3.6%

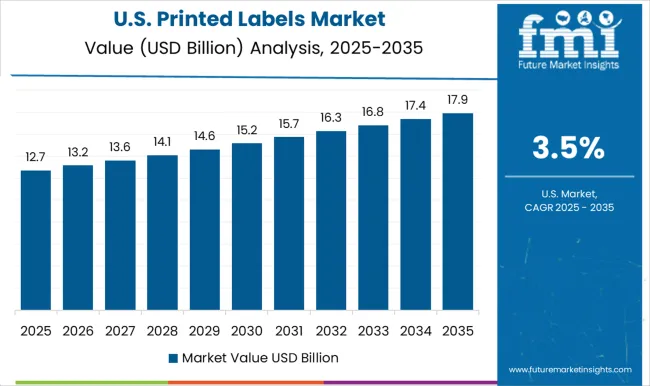
The United States commands a substantial market share in the global printed labels market, solidifying its position in the industry. With its thriving economy and advanced manufacturing capabilities, the country has created a highly competitive market for printed labels. The aspects of the USA market is its emphasis on technological advancements. American companies have been quick to adopt innovative printing techniques and materials, such as digital printing, eco-friendly inks, and smart labels with RFID technology. This focus on cutting-edge solutions has allowed USA manufacturers to offer a wide range of customized and high-quality printed labels, catering to diverse industries like food and beverage, pharmaceuticals, retail, and logistics. Furthermore, the United States' extensive network of distribution channels and well-established retail sector provides many opportunities for printed label manufacturers to reach a vast consumer base. The market's dynamism, coupled with its commitment to innovation, positions the United States as a dominant force in the global printed labels market on a global scale.

Burgeoning Retail Sector, in India to Boost the Market

Country India
Market Size (US$ billion) by End of Forecast Period (2033) US$ 2.5 billion
CAGR % 2023 to End of Forecast (2033) 5.7%

India has emerged as a strong market base for the printed labels market, exhibiting notable growth and offering unique opportunities. The country's expanding economy, burgeoning retail sector, and increasing consumer awareness have contributed to its significance in the industry. One distinctive aspect of the Indian market is its diverse and vibrant packaging landscape. With a rich cultural heritage and a multitude of languages, Indian consumers value personalized and region-specific packaging, which drives the demand for printed labels that cater to these preferences. Additionally, the country's large population and rising middle class have led to a surge in consumer goods, pharmaceuticals, and food and beverage industries, all of which heavily rely on printed labels for branding and product information.
China Own Expected Notable Growth Potential in Printed Labels Market

Country China
Market Size (US$ billion) by End of Forecast Period (2033) US$ 4.8 billion
CAGR % 2023 to End of Forecast (2033) 5.2%

China has made significant strides in digital printing technologies, such as UV and laser printing, allowing for high-resolution and precise label printing. This technological prowess positions Chinese manufacturers at the forefront of innovation in the industry, attracting both domestic and international clients seeking cutting-edge printing solutions. The country has experienced a digital revolution, with a vast number of consumers embracing online shopping and mobile commerce. This has created a tremendous demand for printed labels that provide secure and convenient packaging, delivery tracking, and brand identification for online purchases. Chinese companies have responded to this demand by offering specialized label solutions for e-commerce, including tamper-evident labels, QR codes, and variable data printing. With its technological prowess, booming e-commerce sector, favourable geographic location, and government support, China's expected notable growth potential in the printed labels market positions it as a key player and a driving force for the industry's future development.

Category-wise Insights

How Pressure Sensitive Labels Segment Holds the Major Market in Printed Labels Market?

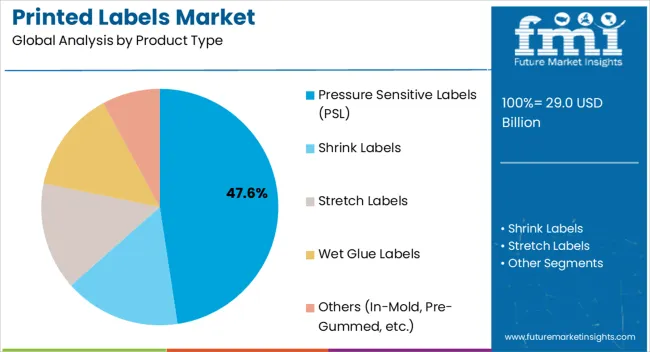
The pressure sensitive labels segment is expected to dominate the printed labels industry with a CAGR of 4.9% from 2022 to 2033. Pressure-sensitive labels hold a major market share in the printed labels industry due to their unique characteristics and advantages. Pressure-sensitive labels are highly preferred for their ease of application, making them suitable for both manual and automatic labeling processes across various industries. Additionally, pressure-sensitive labels are known for their durability and resistance to moisture, chemicals, and abrasion, ensuring that the label remains intact and legible throughout the product's lifecycle.

How Food Industry is Driving the Printed Labels Market?

The food segment is expected to dominate the printed labels industry with a CAGR of 5.1% from 2022 to 2033. Food products require labels that provide clear and accurate information about ingredients, allergens, nutritional values, expiration dates, and proper handling instructions. Compliance with food safety regulations is of utmost importance, and printed labels help to convey vital information to consumers, promoting transparency and trust in the food supply chain. As the food service industry continues to prioritize food safety, product information, and branding, the demand for printed labels remains strong.
Get the data you need at a Fraction of the cost

Personalize your report by choosing insights you need
and save 40%!

How Market Players Stay Competitive in Printed Labels Market?

In the fiercely competitive printed labels market, market players employ innovative strategies to maintain a strong competitive edge. By leveraging AR technology, companies can create interactive labels that provide an immersive and engaging experience for consumers. These labels can be scanned using a smartphone or tablet, unlocking digital content such as product information, videos, or promotional offers. By staying at the forefront of technology and leveraging unique experiences, companies can forge stronger connections with consumers and stay ahead of their competitors in the printed labels market.

Key Strategies in Printed Labels Market:

Product Innovation

Product innovation in this industry is the development of smart labels embedded with sensors and data-tracking capabilities. This innovative approach not only enhances product safety and efficiency but also opens up new possibilities for supply chain optimization, consumer engagement, and brand transparency.

Customization:

Customization is particularly valuable in industries like pharmaceuticals, where each product requires unique identification and tracking. Additionally, variable data printing techniques allows for targeted marketing campaigns by printed labels with personalized messages or offers tailored to specific customer segments.

Sustainability:

Sustainability in this market is the utilization of innovative materials derived from renewable sources. Market players are exploring options such as plant-based or bio-based label materials that reduce dependence on fossil fuels and have a lower carbon footprint. For instance, labels made from bamboo, sugarcane, or other agricultural residues offer an eco-friendly alternative to traditional petroleum-based materials. Additionally, companies are exploring water-based or solvent-free inks that minimize harmful volatile organic compounds and reduce environmental impact during the printing process.

Strategic Expansion:

Strategic expansion is a key aspect of staying competitive in the printed labels market, and market players employ various unique approaches to broaden their reach and capture new opportunities. Strategic expansion approach positions market players as trusted partners capable of delivering seamless and integrated labeling solutions, giving them a competitive advantage over standalone label providers in the market.

Key Players in the Printed Labels Market

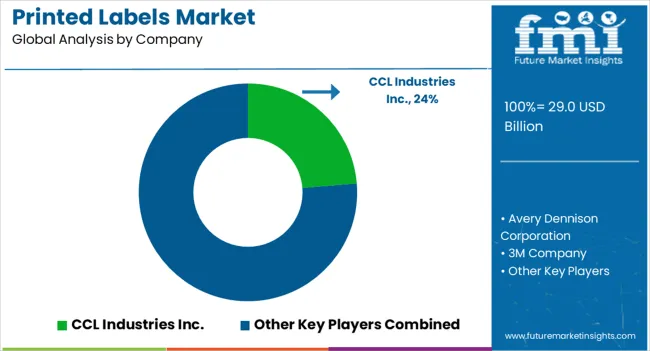
  • CCL Industries Inc.
  • Avery Dennison Corporation
  • 3M Company
  • Fuji Seal International, Inc.
  • Multi-Color Corporation
  • Klöckner Pentaplast Europe GmbH & Co. KG
  • Walle Corporation
  • Anchor Printing
  • UPM Raflatac
  • BRADY Corp
  • Sato Holdings Corporation
  • Weber Packaging Solutions, Inc.
  • H Derksen & Sons Company
  • Traco Manufacturing, Inc.
  • Fort Dearborn Company
  • Edwards Label, Inc.
  • Resource Label Group, LLC

Segmentation Analysis of the Printed Labels Market

Product Type:

  • Pressure Sensitive Labels (PSL)
  • Shrink Labels
  • Stretch Labels
  • Wet Glue Labels
  • Others (In-mold, Pre-gummed, etc.)

Material:

  • Plastic
  • Paper
  • Aluminium

Printing Technology:

  • Flexographic
  • Digital
  • Gravure
  • Offset
  • Letterpress

End Use:

  • Food
    • Bakery & Confectionaries
    • Dairy Products
    • Baby Food
    • Chilled/Frozen Food
    • Others (Snacks, Pet Food, etc.)
  • Beverages
    • Alcoholic
    • Non-Alcoholic
  • Healthcare
  • Cosmetics & Personal Care
  • Homecare & Toiletries
  • Chemicals
  • Automobiles
  • Others Industrial

Frequently Asked Questions

How Much Is the Market Currently Worth?

In 2023, the market has the potential to garner a valuation of US$ 26.8 Billion.

How Has the Market Performed in the Past?

From 2018 to 2022, sales climbed significantly at an HCAGR of 2.1%.

What is the CAGR of the Printed Labels Market?

The market is anticipated to develop at a CAGR of 4.1% through 2033.

Which Size Is the Market Envisioned to Be In 2033?

The size of the global market is predicted to be US$ 40.1 Billion by 2033.

What Is the Market CAGR of The United States?

Through 2033, the United States market is going to expand at a CAGR of 3.6%.

What Is the Growth Outlook of the India Market?

Through 2033, the Indian market is going to expand at a CAGR of 5.7%.

Table of Content
1. Executive Summary
    1.1. Global Market Outlook
    1.2. Market Analysis
    1.3. Analysis and Recommendations
2. Market Overview
    2.1. Market Coverage / Taxonomy
    2.2. Market Definition / Scope / Limitations
3. Key Market Trends
    3.1. Key Trends Impacting the Market
    3.2. Sustainable Trends
    3.3. Technological Trends
    3.4. Product Innovation / Development Trends
4. Key Success Factors
    4.1. Product Adoption / Usage Analysis
    4.2. Product USPs / Features
    4.3. Strategic Promotional Strategies
    4.4. Go-to-market Strategies
5. Global Market Demand Analysis 2018 to 2022 and Forecast, 2023 to 2033
    5.1. Historical Market Volume (Tons) Analysis, 2018 to 2022
    5.2. Current and Future Market Volume (Tons) Projections, 2023 to 2033
    5.3. Y-o-Y Growth Trend Analysis
6. Global Market - Pricing Analysis
    6.1. Regional Pricing Analysis
    6.2. Global Average Pricing Analysis Benchmark
7. Global Market Demand (in Value or Size in US$ Million) Analysis 2018 to 2022 and Forecast, 2023 to 2033
    7.1. Historical Market Value (US$ Million) Analysis, 2018 to 2022
    7.2. Current and Future Market Value (US$ Million) Projections, 2023 to 2033
        7.2.1. Y-o-Y Growth Trend Analysis
        7.2.2. Absolute $ Opportunity Analysis
8. Market Background
    8.1. Global Packaging Market Overview
    8.2. Forecast Factors - Relevance & Impact
    8.3. Value Chain Analysis & Profitability Margin
        8.3.1. Exhaustive List of Raw Suppliers
        8.3.2. Exhaustive List of Distribution Machines/ Converters/Distributors
        8.3.3. Exhaustive List of Brand Owners/ Customer Base
    8.4. Case-based Scenario – Impact Assessment
        8.4.1. Current Statistics
        8.4.2. Short-Mid-Long Term Outlook
        8.4.3. Likely Rebound
    8.5. Market Dynamics
        8.5.1. Drivers
        8.5.2. Restraints
        8.5.3. Opportunity Analysis
    8.6. Supply Demand Analysis
        8.6.1. Import /Export Analysis
9. Global Market Analysis 2018 to 2022 and Forecast 2023 to 2033, By Product Type
    9.1. Introduction/Key Findings
    9.2. Historical Market Size (US$ Million) and Volume (Tons) Analysis By Machine Type, 2018-2022
    9.3. Current and Future Market Size (US$ Million) and Volume (Tons) Analysis and Forecast By Machine Type, 2023-2033
        9.3.1. Pressure Sensitive Labels (PSL)
        9.3.2. Shrink Labels
        9.3.3. Stretch Labels
        9.3.4. Wet Glue Labels
        9.3.5. Others (In-mold, Pre-gummed, etc.)
    9.4. Market Attractiveness Analysis By Product Type
10. Global Market Analysis 2018 to 2022 and Forecast 2023 to 2033, By Material 
    10.1. Introduction / Key Findings
    10.2. Historical Market Size (US$ Million) and Volume (Tons) Analysis By Material, 2018 to 2022
    10.3. Current and Future Market Size (US$ Million) and Volume (Tons) Analysis and Forecast By Material, 2023 to 2033
        10.3.1. Plastic
        10.3.2. Paper
        10.3.3. Aluminum
    10.4. Market Attractiveness Analysis By Material
11. Global Market Analysis 2018 to 2022 and Forecast 2023 to 2033, By Printing Technology 
    11.1. Introduction / Key Findings
    11.2. Historical Market Size (US$ Million) and Volume (Tons) Analysis By Printing Technology, 2018 to 2022
    11.3. Current and Future Market Size (US$ Million) and Volume (Tons) Analysis and Forecast By Printing Technology, 2023 to 2033
        11.3.1. Flexographic
        11.3.2. Digital
        11.3.3. Gravure
        11.3.4. Offset
        11.3.5. Letterpress
    11.4. Market Attractiveness Analysis By Printing Technology
12. Global Market Analysis 2018 to 2022 and Forecast 2023 to 2033, By End Use
    12.1. Introduction / Key Findings
    12.2. Historical Market Size (US$ Million) and Volume (Tons) Analysis By End Use, 2018 to 2022
    12.3. Current and Future Market Size (US$ Million) and Volume (Tons) Analysis and Forecast By End Use, 2023 to 2033
        12.3.1. Food
            12.3.1.1. Bakery & Confectionaries
            12.3.1.2. Dairy Products
            12.3.1.3. Baby Food
            12.3.1.4. Chilled/ Frozen Food
            12.3.1.5. Others (Snacks, Pet Food, etc.)
        12.3.2. Beverages
            12.3.2.1. Alcoholic
            12.3.2.2. Non-Alcoholic
        12.3.3. Healthcare
        12.3.4. Cosmetics & Personal Care
        12.3.5. Homecare & Toiletries
        12.3.6. Chemicals
        12.3.7. Automobiles
        12.3.8. Others Industrial
    12.4. Market Attractiveness Analysis By End Use
13. Global Market Analysis 2018 to 2022 and Forecast 2023 to 2033, By Region
    13.1. Introduction / Key Findings
    13.2. Historical Market Size (US$ Million) and Volume (Tons) Analysis By Region, 2018 to 2022
    13.3. Current and Future Market Size (US$ Million) and Volume (Tons) Analysis and Forecast By Region, 2023 to 2033
        13.3.1. North America
        13.3.2. Latin America
        13.3.3. East Asia
        13.3.4. South Asia & Pacific
        13.3.5. Western Europe
        13.3.6. Eastern Europe
        13.3.7. Central Asia
        13.3.8. Russia & Belarus
        13.3.9. Balkan & Baltic Countries
        13.3.10. Middle East and Africa (MEA)
    13.4. Market Attractiveness Analysis By Region
14. North America Market Analysis 2018 to 2022 and Forecast 2023 to 2033
    14.1. Introduction / Key Findings
    14.2. Historical Market Size (US$ Million) and Volume (Tons) Analysis by Market Taxonomy, 2018 to 2022
    14.3. Current Market Size (US$ Million) and Volume (Tons) Analysis and Forecast by Market Taxonomy, 2023 to 2033
        14.3.1. By Region
            14.3.1.1. USA
            14.3.1.2. Canada
        14.3.2. By Product Type
        14.3.3. By Material
        14.3.4. By Printing Technology
        14.3.5. By End Use
    14.4. Market Attractiveness Analysis
        14.4.1. By Region
        14.4.2. By Product Type
        14.4.3. By Material
        14.4.4. By Printing Technology
        14.4.5. By End Use
15. Latin America Market Analysis 2018 to 2022 and Forecast 2023 to 2033
    15.1. Introduction / Key Findings
    15.2. Historical Market Size (US$ Million) and Volume (Tons) Analysis by Market Taxonomy, 2018 to 2022
    15.3. Current Market Size (US$ Million) and Volume (Tons) Analysis and Forecast by Market Taxonomy, 2023 to 2033
        15.3.1. By Region
            15.3.1.1. Brazil
            15.3.1.2. Mexico
            15.3.1.3. Argentina
            15.3.1.4. Rest of Latin America
        15.3.2. By Material
        15.3.3. By Product Type
        15.3.4. By End Use
    15.4. Market Attractiveness Analysis
        15.4.1. By Region
        15.4.2. By Product Type
        15.4.3. By Material
        15.4.4. By Printing Technology
        15.4.5. By End Use
16. East Asia Market Analysis 2018 to 2022 and Forecast 2023 to 2033
    16.1. Introduction / Key Findings
    16.2. Historical Market Size (US$ Million) and Volume (Tons) Analysis by Market Taxonomy, 2018 to 2022
    16.3. Current Market Size (US$ Million) and Volume (Tons) Analysis and Forecast by Market Taxonomy, 2023 to 2033
        16.3.1. By Region
            16.3.1.1. China
            16.3.1.2. Japan
            16.3.1.3. South Korea
        16.3.2. By Product Type
        16.3.3. By Material
        16.3.4. By End Use
    16.4. Market Attractiveness Analysis
        16.4.1. By Region
        16.4.2. By Product Type
        16.4.3. By Material
        16.4.4. By Printing Technology
        16.4.5. By End Use
17. South Asia & Pacific Market Analysis 2018 to 2022 and Forecast 2023 to 2033
    17.1. Introduction / Key Findings
    17.2. Historical Market Size (US$ Million) and Volume (Tons) Analysis by Market Taxonomy, 2018 to 2022
    17.3. Current Market Size (US$ Million) and Volume (Tons) Analysis and Forecast by Market Taxonomy, 2023 to 2033
        17.3.1. By Region
            17.3.1.1. India
            17.3.1.2. ASEAN
            17.3.1.3. Australia & New Zealand
        17.3.2. By Product Type
        17.3.3. By Material
        17.3.4. By Printing Technology
        17.3.5. By End Use
    17.4. Market Attractiveness Analysis
        17.4.1. By Region
        17.4.2. By Product Type
        17.4.3. By Material
        17.4.4. By Printing Technology
        17.4.5. By End Use
18. Western Europe Market Analysis 2018 to 2022 and Forecast 2023 to 2033
    18.1. Introduction / Key Findings
    18.2. Historical Market Size (US$ million) and Volume (Tons) Analysis by Market Taxonomy, 2018 to 2022
    18.3. Current Market Size (US$ million) and Volume (Tons) Analysis and Forecast by Market Taxonomy, 2023 to 2033
        18.3.1. By Region
            18.3.1.1. Germany
            18.3.1.2. France
            18.3.1.3. Spain
            18.3.1.4. Italy
            18.3.1.5. United Kingdom
            18.3.1.6. BENELUX
            18.3.1.7. Nordics
            18.3.1.8. Rest of Western Europe
        18.3.2. By Product Type
        18.3.3. By Material
        18.3.4. By End Use
    18.4. Market Attractiveness Analysis
        18.4.1. By Region
        18.4.2. By Product Type
        18.4.3. By Material
        18.4.4. By Printing Technology
        18.4.5. By End Use
19. Eastern Europe Market Analysis 2018 to 2022 and Forecast 2023 to 2033
    19.1. Introduction / Key Findings
    19.2. Historical Market Size (US$ million) and Volume (Tons) Analysis by Market Taxonomy, 2018 to 2022
    19.3. Current Market Size (US$ million) and Volume (Tons) Analysis and Forecast by Market Taxonomy, 2023 to 2033
        19.3.1. By Region
            19.3.1.1. Poland
            19.3.1.2. Hungary
            19.3.1.3. Austria
            19.3.1.4. Czech Republic
            19.3.1.5. Rest of Eastern Europe
        19.3.2. By Product Type
        19.3.3. By Material
        19.3.4. By End Use
    19.4. Market Attractiveness Analysis
        19.4.1. By Region
        19.4.2. By Product Type
        19.4.3. By Material
        19.4.4. By Printing Technology
        19.4.5. By End Use
20. Central Asia Market Analysis 2018 to 2022 and Forecast 2023 to 2033
    20.1. Introduction / Key Findings
    20.2. Historical Market Size (US$ million) and Volume (Tons) Analysis by Market Taxonomy, 2018 to 2022
    20.3. Current Market Size (US$ million) and Volume (Tons) Analysis and Forecast by Market Taxonomy, 2023 to 2033
        20.3.1. By Region
            20.3.1.1. Kazakhstan
            20.3.1.2. Kyrgyzstan
            20.3.1.3. Tajikistan
            20.3.1.4. Turkmenistan
            20.3.1.5. Uzbekistan
        20.3.2. By Product Type
        20.3.3. By Material
        20.3.4. By End Use
    20.4. Market Attractiveness Analysis
        20.4.1. By Region
        20.4.2. By Product Type
        20.4.3. By Material
        20.4.4. By Printing Technology
        20.4.5. By End Use
21. Russia & Belarus Market Analysis 2018 to 2022 and Forecast 2023 to 2033
    21.1. Introduction / Key Findings
    21.2. Historical Market Size (US$ million) and Volume (Tons) Analysis by Market Taxonomy, 2018 to 2022
    21.3. Current Market Size (US$ million) and Volume (Tons) Analysis and Forecast by Market Taxonomy, 2023 to 2033
        21.3.1. By Region
            21.3.1.1. Russia
            21.3.1.2. Belarus
        21.3.2. By Product Type
        21.3.3. By Material
        21.3.4. By End Use
        21.3.5. By End Use
    21.4. Market Attractiveness Analysis
        21.4.1. By Region
        21.4.2. By Product Type
        21.4.3. By Material
        21.4.4. By Printing Technology
        21.4.5. By End Use
22. Balkan & Baltic Countries Market Analysis 2018 to 2022 and Forecast 2023 to 2033
    22.1. Introduction / Key Findings
    22.2. Historical Market Size (US$ million) and Volume (Tons) Analysis by Market Taxonomy, 2018 to 2022
    22.3. Current Market Size (US$ million) and Volume (Tons) Analysis and Forecast by Market Taxonomy, 2023 to 2033
        22.3.1. By Region
            22.3.1.1. Romania
            22.3.1.2. Greece
            22.3.1.3. Bulgaria
        22.3.2. By Product Type
        22.3.3. By Material
        22.3.4. By End Use
    22.4. Market Attractiveness Analysis
        22.4.1. By Region
        22.4.2. By Product Type
        22.4.3. By Material
        22.4.4. By Printing Technology
        22.4.5. By End Use
23. Middle East & Africa Market Analysis 2018 to 2022 and Forecast 2023 to 2033
    23.1. Introduction / Key Findings
    23.2. Historical Market Size (US$ million) and Volume (Tons) Analysis by Market Taxonomy, 2018 to 2022
    23.3. Current Market Size (US$ million) and Volume (Tons) Analysis and Forecast by Market Taxonomy, 2023 to 2033
        23.3.1. By Region
            23.3.1.1. GCC Countries
            23.3.1.2. Turkey
            23.3.1.3. Northern Africa
            23.3.1.4. South Africa
            23.3.1.5. Israel
            23.3.1.6. Saudi Arabia
        23.3.2. By Product Type
        23.3.3. By Material
        23.3.4. By Printing Technology
        23.3.5. By End Use
    23.4. Market Attractiveness Analysis
        23.4.1. By Region
        23.4.2. By Product Type
        23.4.3. By Material
        23.4.4. By Printing Technology
        23.4.5. By End Use
24. Region wise Market Analysis 2023 & 2033
    24.1. USA Market Analysis
        24.1.1. By Product Type
        24.1.2. By Material
        24.1.3. By Printing Technology
        24.1.4. By End Use
    24.2. Canada Market Analysis
        24.2.1. By Product Type
        24.2.2. By Material
        24.2.3. By Printing Technology
        24.2.4. By End Use
    24.3. Brazil Market Analysis
        24.3.1. By Product Type
        24.3.2. By Material
        24.3.3. By Printing Technology
        24.3.4. By End Use
    24.4. Mexico Market Analysis
        24.4.1. By Product Type
        24.4.2. By Material
        24.4.3. By Printing Technology
        24.4.4. By End Use
    24.5. Germany Market Analysis
        24.5.1. By Product Type
        24.5.2. By Material
        24.5.3. By Printing Technology
        24.5.4. By End Use
    24.6. UK Market Analysis
        24.6.1. By Product Type
        24.6.2. By Material
        24.6.3. By Printing Technology
        24.6.4. By End Use
    24.7. Spain Market Analysis
        24.7.1. By Product Type
        24.7.2. By Material
        24.7.3. By End Use
    24.8. France Market Analysis
        24.8.1. By Product Type
        24.8.2. By Material
        24.8.3. By Printing Technology
        24.8.4. By End Use
    24.9. Italy Market Analysis
        24.9.1. By Product Type
        24.9.2. By Material
        24.9.3. By Printing Technology
        24.9.4. By End Use
    24.10. Russia Market Analysis
        24.10.1. By Product Type
        24.10.2. By Material
        24.10.3. By Printing Technology
        24.10.4. By End Use
    24.11. China Market Analysis
        24.11.1. By Product Type
        24.11.2. By Material
        24.11.3. By Printing Technology
        24.11.4. By End Use
    24.12. Japan Market Analysis
        24.12.1. By Product Type
        24.12.2. By Material
        24.12.3. By Printing Technology
        24.12.4. By End Use
25. Market Structure Analysis
    25.1. Market Analysis by Tier of Companies
    25.2. Market Share Analysis of Top Players
    25.3. Market Presence Analysis
26. Competition Analysis
    26.1. Competition Dashboard
    26.2. Competition Benchmarking
    26.3. Competition Deep Dive
        26.3.1. CCL Industries Inc.
            26.3.1.1. Overview
            26.3.1.2. Product Portfolio
            26.3.1.3. Profitability by Market Segments (Material /Product/Region)
            26.3.1.4. Sales Footprint
            26.3.1.5. Strategy Overview
        26.3.2. Avery Dennison Corporation
            26.3.2.1. Overview
            26.3.2.2. Product Portfolio
            26.3.2.3. Profitability by Market Segments (Material /Product/Region)
            26.3.2.4. Sales Footprint
            26.3.2.5. Strategy Overview
        26.3.3. 3M Company
            26.3.3.1. Overview
            26.3.3.2. Product Portfolio
            26.3.3.3. Profitability by Market Segments (Material /Product/Region)
            26.3.3.4. Sales Footprint
            26.3.3.5. Strategy Overview
        26.3.4. Fuji Seal International, Inc.
            26.3.4.1. Overview
            26.3.4.2. Product Portfolio
            26.3.4.3. Profitability by Market Segments (Material /Product/Region)
            26.3.4.4. Sales Footprint
            26.3.4.5. Strategy Overview
        26.3.5. Multi-Color Corporation
            26.3.5.1. Overview
            26.3.5.2. Product Portfolio
            26.3.5.3. Profitability by Market Segments (Material /Product/Region)
            26.3.5.4. Sales Footprint
            26.3.5.5. Strategy Overview
        26.3.6. Klockner Pentaplast Europe GmbH & Co. KG
            26.3.6.1. Overview
            26.3.6.2. Product Portfolio
            26.3.6.3. Profitability by Market Segments (Material /Product/Region)
            26.3.6.4. Sales Footprint
            26.3.6.5. Strategy Overview
        26.3.7. Walle Corporation
            26.3.7.1. Overview
            26.3.7.2. Product Portfolio
            26.3.7.3. Profitability by Market Segments (Material /Product/Region)
            26.3.7.4. Sales Footprint
            26.3.7.5. Strategy Overview
        26.3.8. Anchor Printing
            26.3.8.1. Overview
            26.3.8.2. Product Portfolio
            26.3.8.3. Profitability by Market Segments (Material /Product/Region)
            26.3.8.4. Sales Footprint
            26.3.8.5. Strategy Overview
        26.3.9. UPM Raflatac
            26.3.9.1. Overview
            26.3.9.2. Product Portfolio
            26.3.9.3. Profitability by Market Segments (Material /Product/Region)
            26.3.9.4. Sales Footprint
            26.3.9.5. Strategy Overview
        26.3.10. BRADY Corporation
            26.3.10.1. Overview
            26.3.10.2. Product Portfolio
            26.3.10.3. Profitability by Market Segments (Material /Product/Region)
            26.3.10.4. Sales Footprint
            26.3.10.5. Strategy Overview
        26.3.11. Sato Holdings Corporation
            26.3.11.1. Overview
            26.3.11.2. Product Portfolio
            26.3.11.3. Profitability by Market Segments (Material /Product/Region)
            26.3.11.4. Sales Footprint
            26.3.11.5. Strategy Overview
        26.3.12. Weber Packaging Solutions, Inc.
            26.3.12.1. Overview
            26.3.12.2. Product Portfolio
            26.3.12.3. Profitability by Market Segments (Material /Product/Region)
            26.3.12.4. Sales Footprint
            26.3.12.5. Strategy Overview
        26.3.13. H Derksen & Sons Company
            26.3.13.1. Overview
            26.3.13.2. Product Portfolio
            26.3.13.3. Profitability by Market Segments (Material /Product/Region)
            26.3.13.4. Sales Footprint
            26.3.13.5. Strategy Overview
        26.3.14. Traco Manufacturing, Inc.
            26.3.14.1. Overview
            26.3.14.2. Product Portfolio
            26.3.14.3. Profitability by Market Segments (Material /Product/Region)
            26.3.14.4. Sales Footprint
            26.3.14.5. Strategy Overview
        26.3.15. Fort Dearborn Company
            26.3.15.1. Overview
            26.3.15.2. Product Portfolio
            26.3.15.3. Profitability by Market Segments (Material /Product/Region)
            26.3.15.4. Sales Footprint
            26.3.15.5. Strategy Overview
        26.3.16. Edwards Label, Inc.
            26.3.16.1. Overview
            26.3.16.2. Product Portfolio
            26.3.16.3. Profitability by Market Segments (Material /Product/Region)
            26.3.16.4. Sales Footprint
            26.3.16.5. Strategy Overview
        26.3.17. Resource Label Group, LLC
            26.3.17.1. Overview
            26.3.17.2. Product Portfolio
            26.3.17.3. Profitability by Market Segments (Material /Product/Region)
            26.3.17.4. Sales Footprint
            26.3.17.5. Strategy Overview
27. Assumptions and Acronyms Used
28. Research Methodology

Explore Packaging Insights

View Reports
Future Market Insights

Printed Labels Market

Schedule a Call