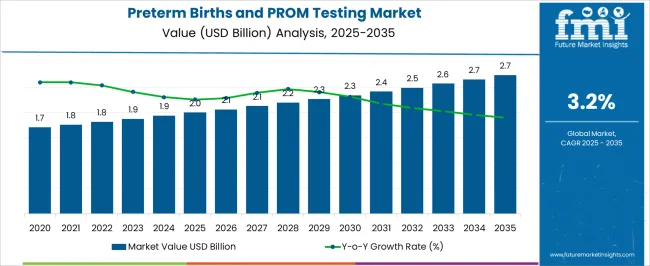
The Preterm Births and PROM Testing Market is estimated to be valued at USD 2.0 billion in 2025 and is projected to reach USD 2.7 billion by 2035, registering a compound annual growth rate (CAGR) of 3.2% over the forecast period.
| Metric | Value |
|---|---|
| Preterm Births and PROM Testing Market Estimated Value in (2025 E) | USD 2.0 billion |
| Preterm Births and PROM Testing Market Forecast Value in (2035 F) | USD 2.7 billion |
| Forecast CAGR (2025 to 2035) | 3.2% |
The preterm births and PROM testing market is gaining traction due to the rising global burden of premature deliveries and increased clinical focus on early detection and intervention. Premature rupture of membranes represents a critical risk factor in preterm births and is associated with significant neonatal morbidity and mortality.
As healthcare systems place greater emphasis on maternal and fetal monitoring, the adoption of diagnostic tools that enable timely and accurate risk assessment has accelerated. Clinical protocols now integrate rapid and non invasive testing methods to evaluate rupture status and predict preterm labor, supporting safer delivery outcomes.
Technological advancements in biochemical assays, along with greater awareness among obstetric care providers, are driving demand. The outlook remains promising as policy makers and healthcare providers seek to reduce complications and improve outcomes through earlier and more precise prenatal diagnostics.
The market is segmented by Test Type and region. By Test Type, the market is divided into Biochemical Markers, Pelvic exam, Ultrasound, Uterine Monitoring, Nitazine Test, Ferning Test, Pooling, PAMG-1 Immunoassay, IGFBP Test, Fetal Fibronectin (fFN), and Other Test Types. Regionally, the market is classified into North America, Latin America, Western Europe, Eastern Europe, Balkan & Baltic Countries, Russia & Belarus, Central Asia, East Asia, South Asia & Pacific, and the Middle East & Africa.
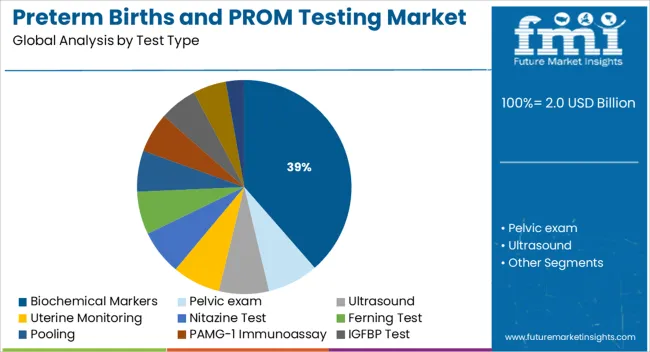
The biochemical markers segment is projected to contribute 38.60% of total market revenue by 2025 within the test type category, establishing it as the leading segment. This prominence is attributed to the high sensitivity and specificity of biochemical markers in detecting premature rupture of membranes and predicting the likelihood of preterm labor.
Markers such as placental alpha microglobulin one and insulin like growth factor binding protein have demonstrated superior clinical performance in early diagnosis compared to traditional physical assessment methods. Their application supports timely clinical decision making, reduces unnecessary hospital admissions, and enhances patient outcomes.
The non invasive nature of these tests and their ability to be conducted at the point of care have further strengthened their adoption in both hospital and outpatient settings. As healthcare continues to prioritize precision diagnostics in prenatal care, biochemical markers remain the preferred choice due to their diagnostic accuracy and clinical reliability.
World Health Organization statistics show that across the globe, around 15 Million preterm births occur annually, and more than one out of every 10 babies are born preterm. Studies have shown that around 12% of births in the USA are preterm. The increased use of fertility treatments to conceive and the higher global maternity age have led to an increase in the number of multiple births.
France’s latest Perinatal Survey puts the country’s Preterm births at 7.5%, with the frequency being preterm being 6.0% for a single birth and 47.5% for a multiple pregnancy delivery. According to data from the CDC, in 2020 17% of infant deaths were due to preterm birth and low birth weight. Infants born before 24 months have only a 50% chance of survival and over 40% of the babies who make it suffer long-term health complications. However, more than 3/4th of preterm babies can be saved with timely and early identification through testing and subsequent medical care.
A study conducted found that 3% of pregnancies have an occurrence of PROM or Premature Rupture of Membranes. At term, PROM is a complication in nearly 8% of pregnancies. PROM is a large cause of preterm births, accounting for almost a third of preterm deliveries. One of the most serious consequences of the term PROM is the chances of intrauterine infection, with the risk increasing with the duration. According to a study, mothers with a PROM duration of over 72 hours showed a much higher risk of placental infection. Their babies, if born preterm due to PROM complications were also at a higher risk for pneumonia and intracranial hemorrhage.
Since as of yet there is no guaranteed way to prevent PROM from occurring, an accurate assessment of thorough testing is essential to the management and care of these pregnancies in order to ensure the well-being of both the mother and the child. PROM also has a high risk of recurrence, between 16% to 32%, so the frequent observation and testing of mothers who display any possible symptoms are encouraged in order to prevent any complications. This, as well as the fact that providers and researchers are working on studying PROM and Preterm births and are working on rapidly developing new technology and tests, which is leading to the growth in demand.
Point-of-Care or POC testing, through which a diagnosis can occur at the time and place of patient care has been a growing field for research. This form of testing can increase access to treatment, especially in remote or resource-scarce areas since it does not require one to send samples away to far-off labs and wait for several days for the results.
Low-cost POC diagnostics when supported by effective treatment strategies, will increase testing, can reduce PROM-related complications, and ensure its management even in low-resource countries and regions. Research is attempting to reduce per-test cost and enhance the accuracy of results, which will benefit the market significantly if there is enough development.
Studies find that Urea and Creatinine based PROM testing, measures with a spectrometer and an enzymatic-based essay, respectively show promise for sensitive and specific detection. As per studies a significant amount of pregnant women around the globe do not have access to ultrasounds or other diagnostic tools. Rapid POC tests are a viable solution for untapped markets in less resource-rich areas and regions such as the Middle East and Africa(MEA) and Asia Pacific, where Preterm birth rates are high.
The prevalent method for testing preterm birth due to preterm labor is fetal fibronectin tests, in which the presence of fetal fibronectin in vaginal discharge is tested for, in some cases accompanied by a transvaginal ultrasound test. The results of this test, which are either positive or negative, indicate whether labor will occur in the following two weeks. With a negative fFN test indicating less than 1% risk of delivery in the upcoming 2 weeks, the test is widely used because of this high negative predictive value, since if the results are negative, the healthcare provider and the expecting mother, especially women who may have been symptomatic but are not in true labor and can avoid the use of strong medication and further invasive testing unless absolutely necessary.
While the most prevalent fFN tests currently in use are a solid-phase enzyme-linked immunosorbent assay or ELISA, a rapid bedside version of the test, which can take around 30 minutes to show results, unlike the ELISA which requires 4 to 48 hours after being sent to a laboratory, is expected to boost demand for this type of testing.
The preterm birth and PROM testing market in North America was held at USD 1.9 Million in 2024. By 2035, the market is expected to reach a valuation of USD 2 Million, growing at a CAGR of 3.4% from 2025 to 2035.
According to data from the CDC, the provisional number of births in the USA grew by 1% from the previous year, in contrast to the 2% average decline since 2014. Further, even though the 15 to 24 age group saw a decline in birth rates, birth rates rose for later pregnancies in the 25 to 49 age group. Further, the preterm birth rate rose to the highest reported levels since 2007, with a 4% increase in 2024 compared to that in 2024.
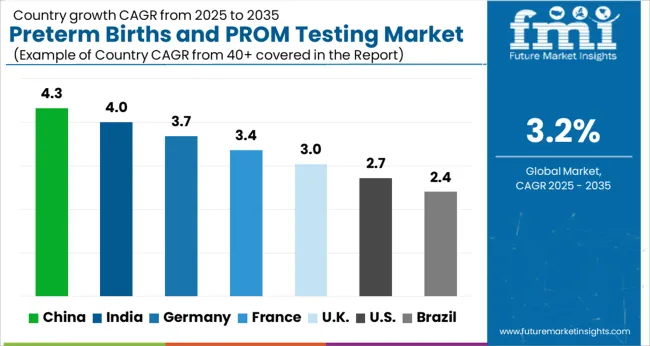
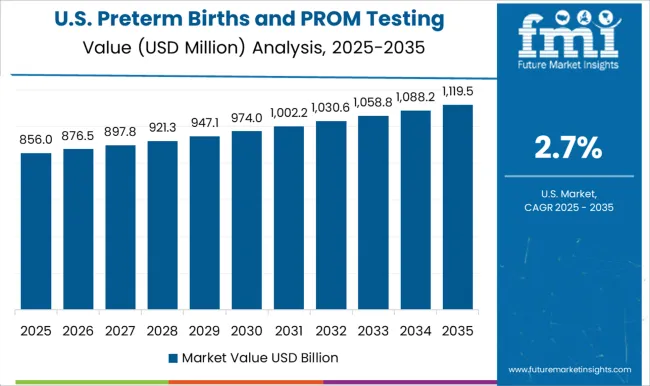
The USA has a significant proportion of births that have preterm and PROM complications, with 12% being preterm and 3% dealing with PROM-related complications. This is owing to several demographic factors of the American population. However, technological advancements, availability of resources, and an increase in approvals for testing methods mean that the USA is the highest contributor to revenue, having witnessed a 3.1% CAGR from 2020 to 2025 and having a forecasted CAGR of 3.4%, with a USA USD 219.7 Absolute Dollar growth.
The preterm birth and PROM testing market in the United Kingdom was held at USD 1.9 Million in 2024. The market is expected to reach a valuation of USD 2.7 Million by 2035, growing at a CAGR of 2.6% from 2025 to 2035.
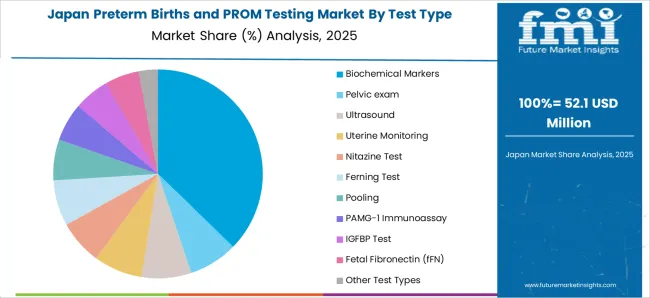
In Japan, the preterm birth and PROM testing market is projected to gross an absolute dollar opportunity of USD 28.7 Million during the forecast period. By 2035, the market is expected to reach USD 98 Million.
The preterm birth and PROM testing market in South Korea was held at USD 37 Million in 2024. The market is likely to be valued at USD 54 Million by 2035, growing at a CAGR of 3.5%.
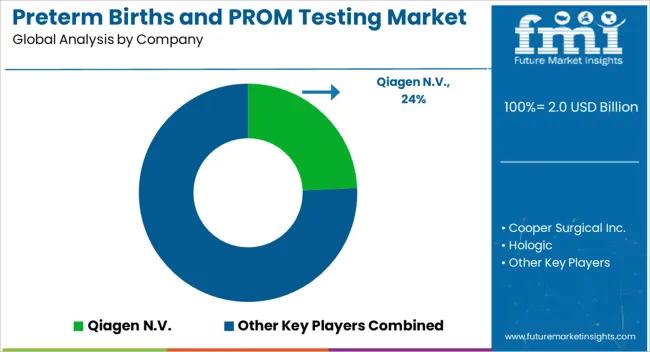
Preterm Birth and PROM testing providers are focused on increasing the efficiency, accuracy, and affordability of their tests. The key companies operating in the market include Qiagen N.V., Cooper Surgical Inc., Hologic, Abbott, Biosynex, Medixbiochemica, Sera Prognostics, IQ Products, Creative Diagnostics, Nanjing Liming Biological Preparations Co., Ltd., Clinical Innovations, LLC, and Bioserv Diagnostic GmbH.
Some of the recent development in Preterm Birth and PROM testing are as follows:
Similarly, recent developments related to companies manufacturing Preterm Birth and PROM testing have been tracked by the team at Future Market Insights, which is available in the full report.
The global preterm births and PROM testing market is estimated to be valued at USD 2.0 billion in 2025.
The market size for the preterm births and PROM testing market is projected to reach USD 2.7 billion by 2035.
The preterm births and PROM testing market is expected to grow at a 3.2% CAGR between 2025 and 2035.
The key product types in preterm births and PROM testing market are biochemical markers, pelvic exam, ultrasound, uterine monitoring, nitazine test, ferning test, pooling, pamg-1 immunoassay, igfbp test, fetal fibronectin (ffn) and other test types.
In terms of , segment to command 0.0% share in the preterm births and PROM testing market in 2025.


Full Research Suite comprises of:
Market outlook & trends analysis
Interviews & case studies
Strategic recommendations
Vendor profiles & capabilities analysis
5-year forecasts
8 regions and 60+ country-level data splits
Market segment data splits
12 months of continuous data updates
DELIVERED AS:
PDF EXCEL ONLINE
Preterm Birth Diagnostic Test Kit Market Forecast and Outlook 2025 to 2035
Preterm Birth Prevention and Management Market Analysis - Size, Share, and Forecast 2025 to 2035
Testing, Inspection & Certification Market Growth – Trends & Forecast 2025 to 2035
5G Testing Market Size and Share Forecast Outlook 2025 to 2035
AB Testing Software Market Size and Share Forecast Outlook 2025 to 2035
5G Testing Equipment Market Analysis - Size, Growth, and Forecast 2025 to 2035
Eye Testing Equipment Market Size and Share Forecast Outlook 2025 to 2035
HSV Testing Market Size and Share Forecast Outlook 2025 to 2035
IoT Testing Equipment Market Size and Share Forecast Outlook 2025 to 2035
GMO Testing Services Market Insights – Food Safety & Regulatory Compliance 2024 to 2034
GMP Testing Services Market
LTE Testing Equipment Market Growth – Trends & Forecast 2019-2027
Drug Testing Systems Market Size and Share Forecast Outlook 2025 to 2035
Tire Testing Machine Market Size and Share Forecast Outlook 2025 to 2035
Self-Testing Market Analysis - Size, Share, and Forecast 2025 to 2035
Food Testing Services Market Size, Growth, and Forecast for 2025–2035
Bend Testing Machine Market Growth - Trends & Forecast 2025 to 2035
An Analysis of the Leak testing Machine Market by Detectors and Sensors Hardware Type through 2035
Soil Testing Market Growth - Trends & Forecast 2025 to 2035
Examining Food Testing Services Market Share & Industry Outlook

Thank you!
You will receive an email from our Business Development Manager. Please be sure to check your SPAM/JUNK folder too.
Chat With
MaRIA