Prenatal Nutrition Market Size and Share Forecast Outlook 2025 to 2035

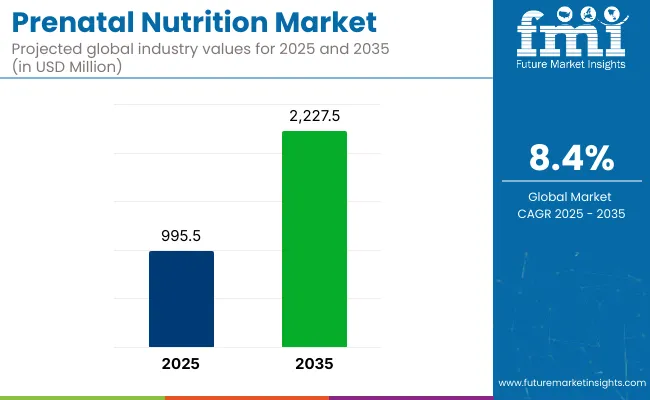
The global prenatal nutrition market is valued at USD 995.5 million in 2025 and is expected to reach USD 2,227.5 million by 2035, reflecting a CAGR of 8.4%.
Quick Stats for Prenatal Nutrition Market

  • Market Value (2025): USD 995.5 million
  • Forecast Value (2035): USD 2,227.5 million
  • Forecast CAGR: 8.4%
  • Product Leader in 2025: Supplements (52% Market Share)
  • Top Sales Channel: Over-the-counter Supplements (58% Market Share)
  • Key Growth Region: Asia Pacific (fastest-growing market in Japan with 6.7% CAGR)

Prenatal Nutrition Market

Metric Values
Estimated Size (2025) USD 995.5 million
Projected value (2035) USD 2,227.5 million
CAGR (2025 to 2035) 8.4%

Factors driving this growth include the rising aging maternal population, growing awareness of targeted nutritional supplementation during pregnancy, and the increasing prevalence of nutritional deficiencies such as iron and folic acid. Moreover, the market expansion is likely to be supported by premiumization trends as more women invest in specialized prenatal products addressing age-related needs, gestational health, and fetal development.

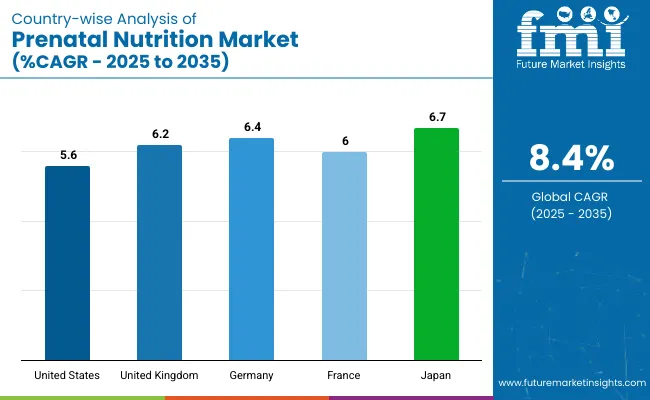
The USA is projected to remain the largest market for prenatal nutrition products, driven by robust innovations in nutritional formulations, though expanding at a moderate CAGR of 5.6%. In contrast, Japan and Germany are anticipated to register significant growth, rising at significant CAGRs of 6.7% and 6.4% respectively. Supplement sare projected to lead the product type with a prominent market share of 52%.Over-the-counter supplements account for 58% of the market share by sales channel.

The market accounts for approximately 6-8% of the overall maternal and child nutrition market, reflecting its niche yet essential role in targeted maternal health. Within the broader dietary supplements market, prenatal nutrition contributes around 1-2%, driven by its specialized consumer base of pregnant women.

It holds nearly 0.5-1% share in the functional foods and beverages market, where fortified foods are a minor category. In the health and wellness nutrition market, prenatal products represent less than 1% due to their focused demographic. However, within women’s health nutrition, prenatal nutrition commands a significant 15-18% share, reflecting its critical positioning.

Analyzing Prenatal Nutrition Market by Top Investment Segments

The market is segmented into product type, primary ingredients, sales channels, and region. By product type, it is segmented into functional food (protein bars, protein powders, cereals, cookies, soups, nutrient-rich stews, crisps & others [snacks, meal replacements]), beverages (herbal teas, fortified milk, ready-to-drink smoothies, electrolyte drinks), and supplements (vitamins and minerals, herbal supplements, calcium supplements, iron supplements, omega-3 fatty acids, probiotics, magnesium supplements and others [multivitamins, DHA blends]).

By primary ingredients, it includes folic acid, iron, calcium, vitamin D, omega-3 fatty acids, magnesium, protein, zinc, choline, and vitamin C. By sales channel, it is segmented into prescription supplements (institutional sales - hospitals and clinics), over-the-counter supplements (drug stores and pharmacies, hypermarkets/supermarkets, convenience stores, health and wellness stores, specialty stores, departmental stores, other retail store) and online retail (company website, third-party/mass merchandiser). By region, it covers North America, Latin America, Europe, East Asia, South Asia, Oceania, and MEA.
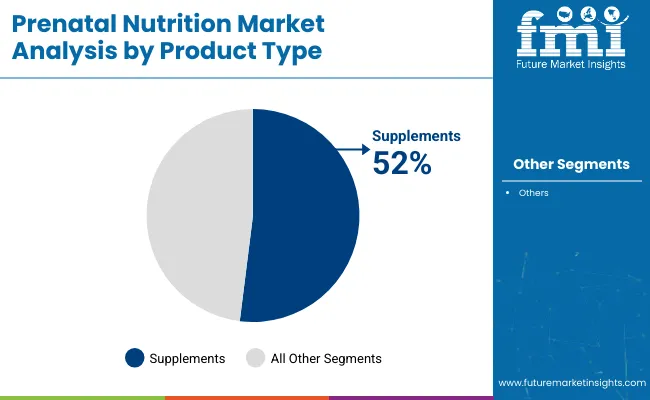
By Product Type, Supplements Account for 52% of the Market Share

Prenatal Nutrition Market Analysis By Product Type

The supplements segment is likely to remain the largest within product types, accounting for over 52% share in 2025, due to their ability to deliver targeted nutrients such as iron, folic acid, and omega-3, which are essential for maternal and fetal health.
  • Rising adoption driven by targeted nutrient formulations
  • Gummy and chewable supplement formats are gaining popularity
  • Iron and omega-3 supplements remain highly recommended products

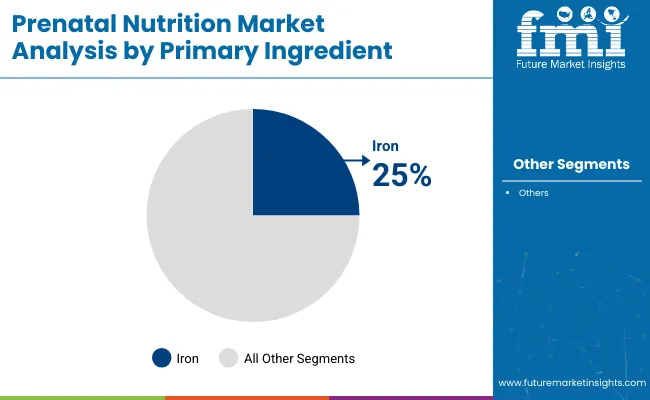
By Primary Ingredient, Iron Accounts for 25% of the Market Share

Prenatal Nutrition Market Analysis By Primary Ingredient

Iron is projected to be the leading primary ingredient segment with a market share of around 25% in 2025. Its dominance is attributed to its crucial role in hemoglobin production and oxygen transport, especially as blood volume increases during pregnancy.
  • Addresses anemia risk during pregnancy
  • Widely recommended as part of standard prenatal care
  • Fortified foods with iron are gaining traction among consumers

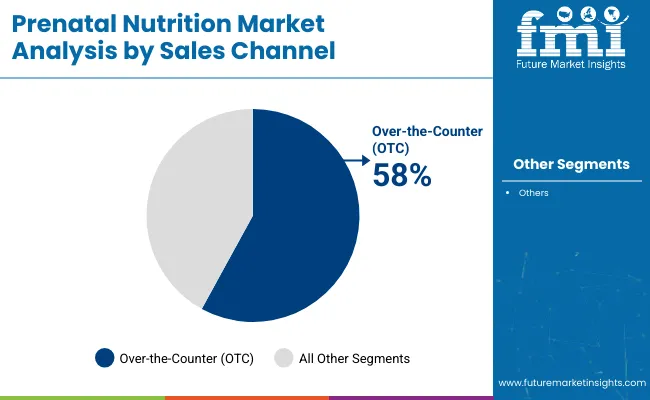
By Sales Channel, Over-the-Counter (OTC) Supplements Account for 58% of the Market Share

Prenatal Nutrition Market Analysis By Sales Channel

The over-the-counter supplements segment is anticipated to dominate sales channels, holding nearly 58% market share in 2025. Its growth is driven by the widespread availability of prenatal products in pharmacies, supermarkets, and health stores, making them easily accessible to consumers without requiring a prescription.

  • High accessibility through pharmacies and supermarkets
  • Rising consumer preference for self-managed prenatal care
  • Expanded shelf space for prenatal products in retail stores

Top Prenatal Nutrition Market Dynamics

Recent Trends in the Prenatal Nutrition Market

  • Rising adoption of personalized prenatal supplements tailored to genetic and health profiles.
  • Increasing preference for clean-label, organic, and non-GMO prenatal products among health-conscious consumers.

Challenges in the Prenatal Nutrition Market
  • The high cost of premium prenatal nutrition products limits adoption in low-income regions.
  • Limited awareness about comprehensive prenatal nutrition beyond iron and folic acid in developing countries.

Analyzing Top Countries Manufacturing and Supplying Prenatal Nutrition Products

Country Wise Analysis Of Prenatal Nutrition Market

Among the top five countries in the prenatal nutrition market, Japan is projected to record the highest CAGR at 6.7% from 2025 to 2035, driven by strong government programs and cultural emphasis on maternal health. Germany follows with a CAGR of 6.4%, supported by preventive healthcare initiatives and high organic product demand.

The United Kingdom is expected to grow at 6.2% CAGR, reflecting NHS-backed nutrition guidelines and plant-based trends. France is projected at 6.0% CAGR, driven by public health campaigns and premium product demand, while the USA records the lowest among these at 5.6% CAGR, despite its strong market size and innovation focus.

The report covers an in-depth analysis of 40+ countries; five top-performing OECD countries are highlighted below.

United States Prenatal Nutrition Market Analysis

The prenatal nutrition revenue in the USA is projected to grow at a CAGR of 5.6% from 2025 to 2035. Growth is driven by high awareness about maternal health, continuous innovation in nutritional formulations, and the strong presence of major companies offering advanced supplements such as probiotics, omega-3 enriched products, and organic blends.

  • Continuous innovation in prenatal supplement formulations.
  • High awareness and physician-recommended prenatal care driving demand.
  • Strong dominance of clean-label and organic prenatal nutrition products.

Prenatal Nutrition Demand Analysis in the UK

The prenatal nutrition market in the UK is anticipated to expand at a CAGR of around 6.2% between 2025 and 2035. Growth is supported by the NHS’s robust prenatal care programs that emphasize maternal nutrition, increasing consumer preference for fortified foods and supplements, and the rising adoption of plant-based prenatal products.

  • NHS guidelines emphasize prenatal nutrition during pregnancy.
  • Growing demand for plant-based and sustainable prenatal products.
  • Strong retail network offering extensive prenatal nutrition product ranges.

Germany Prenatal Nutrition Sales Analysis

The revenue from prenatal nutrition in Germany is expected to rise at a CAGR of 6.4% from 2025 to 2035. This growth is underpinned by the country’s strong emphasis on preventive maternal healthcare, which integrates nutritional guidelines into routine prenatal check-ups.

  • Preventive maternal healthcare is driving prenatal supplement adoption.
  • High demand for organic and allergen-free prenatal nutrition products.
  • Stringent EU regulations ensure superior product quality and safety.

Prenatal Nutrition Demand Analysis in France

The sales of prenatal nutrition products in France are predicted to flourish at a CAGR of approximately 6.0% from 2025 to 2035. Growth is driven by increasing awareness among expectant mothers about the importance of targeted prenatal nutrition, coupled with the influence of public health campaigns promoting folic acid and iron intake.

  • Public health campaigns promoting essential prenatal nutrient intake.
  • Strong nutraceutical industry ensuring product availability.
  • Growing demand for premium and sustainably sourced prenatal products.

Japan Prenatal Nutrition Market Analysis

The prenatal nutrition market in Japan is projected to grow at a CAGR of 6.7% between 2025 and 2035. Growth is driven by high maternal health awareness, extensive government health programs promoting prenatal care, and the cultural emphasis on nutrition during pregnancy.

  • Extensive government programs promoting prenatal health and nutrition.
  • Rising demand for functional foods fortified with prenatal nutrients.
  • Innovation in convenient delivery formats is enhancing market adoption.

Leading Prenatal Nutrition Product Suppliers

The market is moderately fragmented, with a mix of multinational leaders and numerous small to medium enterprises competing across product categories. Top companies such as Nestlé, Abbott Nutrition, Unilever, Church & Dwight Co. Inc., and Garden of Life are leveraging strong brand portfolios, broad distribution networks, and innovation capabilities to maintain market dominance.

Competition centers on differentiated formulations, clean-label certifications, pricing strategies, and regional expansions to capture emerging markets.

Company strategies increasingly focus on developing personalized and targeted prenatal supplements, expanding organic and non-GMO product lines, and forming partnerships with healthcare providers and digital health platforms to build trust and credibility.

Recent Prenatal Nutrition Industry News

In 2024, Nestlé launched Materna Pre and Materna Nausea, two new nutritional solutions designed for women’s fertility and to ease pregnancy-related symptoms such as nausea and vomiting.

Prenatal Nutrition Market Report Scope

Report Attributes Details
Current Total Market Size (2025) USD 995.5 million
Projected Market Size (2035) USD 2,227.5 million
CAGR (2025 to 2035) 8.4%
Base Year for Estimation 2024
Historical Period 2020 to 2024
Projections Period 2025 to 2035
Market Analysis Parameters Revenue in USD million/Volume in units
By Product Type Functional Food (Protein Bars, Protein Powders, Cereals, Cookies, Soups, Nutrient-Rich Stews, Crisps, Others [snacks, meal replacements]), Beverages (Herbal Teas, Fortified Milk, Ready-to-Drink Smoothies, Electrolyte Drinks), Supplements (Vitamins and Minerals, Herbal Supplements, Calcium Supplements, Iron Supplements, Omega-3 Fatty Acids, Probiotics, Magnesium Supplements, Others (multivitamins, DHA blends))
By Primary Ingredient Folic Acid, Iron, Calcium, Vitamin D, Omega-3 Fatty Acids, Magnesium, Protein, Zinc, Choline, Vitamin C
By Sales Channel Prescription Supplements (Institutional Sales - Hospitals and Clinics), Over the Counter Supplements (Drug Stores and Pharmacies, Hypermarkets/Supermarkets, Convenience Stores, Health and Wellness Stores, Specialty Stores, Departmental Stores, Other Retail Stores), Online Retail (Company Website, Third Party/Mass Merchandiser)
Regions Covered North America, Latin America, Europe, East Asia, South Asia, Oceania, the Middle East and Africa
Countries Covered United States, Canada, United Kingdom, Germany, France, China, Japan, South Korea, Brazil, Australia
Key Players Nestlé S.A., Country Life LLC, Abbott Nutrition, Church & Dwight Co. Inc., Garden of Life, Vitamin Angels, Ritual, New Chapter Inc., Rainbow Light, PlusPlus Lifesciences LLP, CE CHEM, Avion Pharmaceuticals LLC, Perdays Health Functional Food Pty Ltd, Exeltis USA Inc., Mead Johnson & Company LLC, AdvaCare Pharma, Unilever, Otsuka Pharmaceutical Co. Ltd, Gelita AG, Mead Johnson & Company LLC.
Additional Attributes Dollar sales by value, market share analysis by region, and country-wise analysis

Key Segmentation

By Product Type:

As per product type, the industry has been categorized into Functional Food (Protein Bars, Protein Powders, Cereals, Cookies, Soups, Nutrient-Rich Stews, Crips, Others), Beverages (Herbal Teas, Fortified Milk, Ready-To-Drink Smoothies, Electrolyte Drinks), Supplements (Vitamins and Minerals, Herbal Supplements, Calcium Supplements, Iron Supplements, Omega-3 Fatty Acids, Probiotics, Herbal Supplements, Magnesium Supplements, Others)

By Primary Ingredient:

This segment is further categorized into Folic Acid, Iron, Calcium, Vitamin D, Omega-3 Fatty Acids, Magnesium, Protein, Zinc, Choline, and Vitamin C.

By Sales Channel:

As per sales channel, the industry has been categorized into Prescription Supplements (Rx)/ (Institutional Sales (Hospital and Clinics)), Over the Counter Supplements (OTC) (Drug Stores and Pharmacies, Hypermarkets/Supermarkets, Convenience Stores, Health and wellness Stores, Specialty Stores, Departmental Stores, Other Retail Stores), Online Retail (Company Website, 3rd party/Mass Merchandiser)

By Region:

As per Region, North America, Latin America, Western Europe, Eastern Europe, East Asia, South Asia & Pacific, Middle East and Africa

Table of Content

  1. Executive Summary
    • Global Market Outlook
    • Demand-side Trends
    • Supply-side Trends
    • Technology Roadmap Analysis
    • Analysis and Recommendations
  2. Market Overview
    • Market Coverage/Taxonomy
    • Market Definition/Scope/Limitations
  3. Market Background
    • Market Dynamics
      • Drivers
      • Restraints
      • Opportunity
      • Trends
    • Scenario Forecast
      • Demand in Optimistic Scenario
      • Demand in Likely Scenario
      • Demand in Conservative Scenario
    • Opportunity Map Analysis
    • Product Life Cycle Analysis
    • Supply Chain Analysis
      • Supply Side Participants and their Roles
        • Producers
        • Mid-Level Participants (Traders/ Agents/ Brokers)
        • Wholesalers and Distributors
      • Value Added and Value Created at Node in the Supply Chain
      • List of Raw Material Suppliers
      • List of Existing and Potential Buyer’s
    • Investment Feasibility Matrix
    • Value Chain Analysis
      • Profit Margin Analysis
      • Wholesalers and Distributors
      • Retailers
    • PESTLE and Porter’s Analysis
    • Regulatory Landscape
      • By Key Regions
      • By Key Countries
    • Regional Parent Market Outlook
    • Production and Consumption Statistics
    • Import and Export Statistics
  4. Global Market Analysis 2020 to 2024 and Forecast, 2025 to 2035
    • Historical Market Size Value (USD Million) & Volume (units) Analysis, 2020 to 2024
    • Current and Future Market Size Value (USD Million) & Volume (units) Projections, 2025 to 2035
      • Y-o-Y Growth Trend Analysis
      • Absolute $ Opportunity Analysis
  5. Global Market Pricing Analysis 2020 to 2024 and Forecast 2025 to 2035
  6. Global Market Analysis 2020 to 2024 and Forecast 2025 to 2035, By Product Type
    • Introduction/Key Findings
    • Historical Market Size Value (USD Million) & Volume (units) Analysis By Product Type, 2020 to 2024
    • Current and Future Market Size Value (USD Million) & Volume (units) Analysis and Forecast By Product Type, 2025 to 2035
      • Functional Food
        • Protein Bars
        • Protein Powders
        • Cereals
        • Cookies
        • Soups
        • Nutrient-Rich Stews
        • Crisps
        • Others
      • Beverages
        • Herbal Teas
        • Fortified Milk
        • Ready-To-Drink Smoothies
        • Electrolyte Drinks
      • Supplements
        • Vitamins and Minerals
        • Herbal Supplements
        • Calcium Supplements
        • Iron Supplements
        • Omega-3 Fatty Acids, Probiotics, Herbal Supplements, Magnesium Supplements, Others.
    • Y-o-Y Growth Trend Analysis By Product Type, 2020 to 2024
    • Absolute $ Opportunity Analysis By Product Type, 2025 to 2035
  7. Global Market Analysis 2020 to 2024 and Forecast 2025 to 2035, By Primary Ingredients
    • Introduction/Key Findings
    • Historical Market Size Value (USD Million) & Volume (units) Analysis By Primary Ingredients, 2020 to 2024
    • Current and Future Market Size Value (USD Million) & Volume (units) Analysis and Forecast By Primary Ingredients, 2025 to 2035
      • Folic Acid
      • Iron
      • Calcium
      • Vitamin D
      • Omega-3 Fatty Acids
      • Magnesium
      • Protein
      • Zinc
      • Choline
      • Vitamin C
    • Y-o-Y Growth Trend Analysis By Primary Ingredients, 2020 to 2024
    • Absolute $ Opportunity Analysis By Primary Ingredients, 2025 to 2035
  8. Global Market Analysis 2020 to 2024 and Forecast 2025 to 2035, By Sales Channel
    • Introduction/Key Findings
    • Historical Market Size Value (USD Million) & Volume (units) Analysis By Sales Channel, 2020 to 2024
    • Current and Future Market Size Value (USD Million) & Volume (units) Analysis and Forecast By Sales Channel, 2025 to 2035
      • Prescription Supplements (Rx)/ (Institutional Sales (Hospital and Clinics))
      • Over the Counter Supplements (OTC)
        • Drug Stores and Pharmacies
        • Hypermarkets/Supermarkets
        • Convenience Stores
        • Health and Wellness Stores
        • Specialty Stores
        • Departmental Stores
        • Other Retail Stores
      • Online Retail
        • Company Website
        • 3rd Party/Mass Merchandiser
    • Y-o-Y Growth Trend Analysis By Sales Channel, 2020 to 2024
    • Absolute $ Opportunity Analysis By Sales Channel, 2025 to 2035
  9. Global Market Analysis 2020 to 2024 and Forecast 2025 to 2035, By Region
    • Introduction
    • Historical Market Size Value (USD Million) & Volume (units) Analysis By Region, 2020 to 2024
    • Current Market Size Value (USD Million) & Volume (units) Analysis and Forecast By Region, 2025 to 2035
      • North America
      • Latin America
      • Western Europe
      • Eastern Europe
      • East Asia
      • South Asia & Pacific
      • Middle East and Africa
    • Market Attractiveness Analysis By Region
  10. North America Market Analysis 2020 to 2024 and Forecast 2025 to 2035, By Country
    • Historical Market Size Value (USD Million) & Volume (units) Trend Analysis By Market Taxonomy, 2020 to 2024
    • Market Size Value (USD Million) & Volume (units) Forecast By Market Taxonomy, 2025 to 2035
      • By Country
        • USA
        • Canada
        • Mexico
      • By Product Type
      • By Primary Ingredients
      • By Sales Channel
    • Market Attractiveness Analysis
      • By Country
      • By Product Type
      • By Primary Ingredients
      • By Sales Channel
    • Key Takeaways
  11. Latin America Market Analysis 2020 to 2024 and Forecast 2025 to 2035, By Country
    • Historical Market Size Value (USD Million) & Volume (units) Trend Analysis By Market Taxonomy, 2020 to 2024
    • Market Size Value (USD Million) & Volume (units) Forecast By Market Taxonomy, 2025 to 2035
      • By Country
        • Brazil
        • Argentina
        • Rest of LATAM
      • By Product Type
      • By Primary Ingredients
      • By Sales Channel
    • Market Attractiveness Analysis
      • By Country
      • By Product Type
      • By Primary Ingredients
      • By Sales Channel
    • Key Takeaways
  12. Western Europe Market Analysis 2020 to 2024 and Forecast 2025 to 2035, By Country
    • Historical Market Size Value (USD Million) & Volume (units) Trend Analysis By Market Taxonomy, 2020 to 2024
    • Market Size Value (USD Million) & Volume (units) Forecast By Market Taxonomy, 2025 to 2035
      • By Country
        • Germany
        • Italy
        • France
        • UK
        • Spain
        • BENELUX
        • Nordic
        • Rest of W.Europe
      • By Product Type
      • By Primary Ingredients
      • By Sales Channel
    • Market Attractiveness Analysis
      • By Country
      • By Product Type
      • By Primary Ingredients
      • By Sales Channel
    • Key Takeaways
  13. Eastern Europe Market Analysis 2020 to 2024 and Forecast 2025 to 2035, By Country
    • Historical Market Size Value (USD Million) & Volume (units) Trend Analysis By Market Taxonomy, 2020 to 2024
    • Market Size Value (USD Million) & Volume (units) Forecast By Market Taxonomy, 2025 to 2035
      • By Country
        • Russia
        • Hungary
        • Poland
        • Balkan & Baltics
        • Rest of E. Europe
      • By Product Type
      • By Primary Ingredients
      • By Sales Channel
    • Market Attractiveness Analysis
      • By Country
      • By Product Type
      • By Primary Ingredients
      • By Sales Channel
    • Key Takeaways
  14. East Asia Market Analysis 2020 to 2024 and Forecast 2025 to 2035, By Country
    • Historical Market Size Value (USD Million) & Volume (units) Trend Analysis By Market Taxonomy, 2020 to 2024
    • Market Size Value (USD Million) & Volume (units) Forecast By Market Taxonomy, 2025 to 2035
      • By Country
        • China
        • Japan
        • South Korea
      • By Product Type
      • By Primary Ingredients
      • By Sales Channel
    • Market Attractiveness Analysis
      • By Country
      • By Product Type
      • By Primary Ingredients
      • By Sales Channel
    • Key Takeaways
  15. South Asia & Pacific Market Analysis 2020 to 2024 and Forecast 2025 to 2035, By Country
    • Historical Market Size Value (USD Million) & Volume (units) Trend Analysis By Market Taxonomy, 2020 to 2024
    • Market Size Value (USD Million) & Volume (units) Forecast By Market Taxonomy, 2025 to 2035
      • By Country
        • India
        • Australia & New Zealand
        • ASEAN
        • Rest of SAP
      • By Product Type
      • By Primary Ingredients
      • By Sales Channel
    • Market Attractiveness Analysis
      • By Country
      • By Product Type
      • By Primary Ingredients
      • By Sales Channel
    • Key Takeaways
  16. Middle East and Africa Market Analysis 2020 to 2024 and Forecast 2025 to 2035, By Country
    • Historical Market Size Value (USD Million) & Volume (units) Trend Analysis By Market Taxonomy, 2020 to 2024
    • Market Size Value (USD Million) & Volume (units) Forecast By Market Taxonomy, 2025 to 2035
      • By Country
        • GCC Countries
        • Northern Africa
        • South Africa
        • Turkiye
        • Rest of MEA
      • By Product Type
      • By Primary Ingredients
      • By Sales Channel
    • Market Attractiveness Analysis
      • By Country
      • By Product Type
      • By Primary Ingredients
      • By Sales Channel
    • Key Takeaways
  17. Key Countries Market Analysis
    • USA
      • Pricing Analysis
      • Market Share Analysis, 2024
        • By Product Type
        • By Primary Ingredients
        • By Sales Channel
    • Canada
      • Pricing Analysis
      • Market Share Analysis, 2024
        • By Product Type
        • By Primary Ingredients
        • By Sales Channel
    • Brazil
      • Pricing Analysis
      • Market Share Analysis, 2024
        • By Product Type
        • By Primary Ingredients
        • By Sales Channel
    • Mexico
      • Pricing Analysis
      • Market Share Analysis, 2024
        • By Product Type
        • By Primary Ingredients
        • By Sales Channel
    • Argentina
      • Pricing Analysis
      • Market Share Analysis, 2024
        • By Product Type
        • By Primary Ingredients
        • By Sales Channel
  18. Market Structure Analysis
    • Competition Dashboard
    • Competition Benchmarking
    • Market Share Analysis of Top Players
      • By Regional
      • By Product Type
      • By Primary Ingredients
      • By Sales Channel
  19. Competition Analysis
    • Competition Deep Dive
      • Nestlé, S.A.
        • Overview
        • Product Portfolio
        • Profitability by Market Segments (Product/Age /Sales Channel/Region)
        • Sales Footprint
        • Strategy Overview
          • Marketing Strategy
          • Product Strategy
          • Channel Strategy
      • Country Life, LLC.
        • Overview
        • Product Portfolio
        • Profitability by Market Segments (Product/Age /Sales Channel/Region)
        • Sales Footprint
        • Strategy Overview
          • Marketing Strategy
          • Product Strategy
          • Channel Strategy
      • Abbott Nutrition
        • Overview
        • Product Portfolio
        • Profitability by Market Segments (Product/Age /Sales Channel/Region)
        • Sales Footprint
        • Strategy Overview
          • Marketing Strategy
          • Product Strategy
          • Channel Strategy
      • Church & Dwight Co. Inc.
        • Overview
        • Product Portfolio
        • Profitability by Market Segments (Product/Age /Sales Channel/Region)
        • Sales Footprint
        • Strategy Overview
          • Marketing Strategy
          • Product Strategy
          • Channel Strategy
      • Garden of Life
        • Overview
        • Product Portfolio
        • Profitability by Market Segments (Product/Age /Sales Channel/Region)
        • Sales Footprint
        • Strategy Overview
          • Marketing Strategy
          • Product Strategy
          • Channel Strategy
      • Vitamin Angels
        • Overview
        • Product Portfolio
        • Profitability by Market Segments (Product/Age /Sales Channel/Region)
        • Sales Footprint
        • Strategy Overview
          • Marketing Strategy
          • Product Strategy
          • Channel Strategy
      • Ritual
        • Overview
        • Product Portfolio
        • Profitability by Market Segments (Product/Age /Sales Channel/Region)
        • Sales Footprint
        • Strategy Overview
          • Marketing Strategy
          • Product Strategy
          • Channel Strategy
      • New Chapter, Inc.
        • Overview
        • Product Portfolio
        • Profitability by Market Segments (Product/Age /Sales Channel/Region)
        • Sales Footprint
        • Strategy Overview
          • Marketing Strategy
          • Product Strategy
          • Channel Strategy
      • Rainbow Light
        • Overview
        • Product Portfolio
        • Profitability by Market Segments (Product/Age /Sales Channel/Region)
        • Sales Footprint
        • Strategy Overview
          • Marketing Strategy
          • Product Strategy
          • Channel Strategy
      • PlusPlus Lifesciences LLP.
        • Overview
        • Product Portfolio
        • Profitability by Market Segments (Product/Age /Sales Channel/Region)
        • Sales Footprint
        • Strategy Overview
          • Marketing Strategy
          • Product Strategy
          • Channel Strategy
      • CE CHEM
        • Overview
        • Product Portfolio
        • Profitability by Market Segments (Product/Age /Sales Channel/Region)
        • Sales Footprint
        • Strategy Overview
          • Marketing Strategy
          • Product Strategy
          • Channel Strategy
      • Avion Pharmaceuticals, LLC
        • Overview
        • Product Portfolio
        • Profitability by Market Segments (Product/Age /Sales Channel/Region)
        • Sales Footprint
        • Strategy Overview
          • Marketing Strategy
          • Product Strategy
          • Channel Strategy
      • Perdays Health Functional Food Pty Ltd
        • Overview
        • Product Portfolio
        • Profitability by Market Segments (Product/Age /Sales Channel/Region)
        • Sales Footprint
        • Strategy Overview
          • Marketing Strategy
          • Product Strategy
          • Channel Strategy
      • Exeltis USA, Inc.
        • Overview
        • Product Portfolio
        • Profitability by Market Segments (Product/Age /Sales Channel/Region)
        • Sales Footprint
        • Strategy Overview
          • Marketing Strategy
          • Product Strategy
          • Channel Strategy
      • Mead Johnson & Company, LLC
        • Overview
        • Product Portfolio
        • Profitability by Market Segments (Product/Age /Sales Channel/Region)
        • Sales Footprint
        • Strategy Overview
          • Marketing Strategy
          • Product Strategy
          • Channel Strategy
      • AdvaCare Pharma
        • Overview
        • Product Portfolio
        • Profitability by Market Segments (Product/Age /Sales Channel/Region)
        • Sales Footprint
        • Strategy Overview
          • Marketing Strategy
          • Product Strategy
          • Channel Strategy
      • Unilever
        • Overview
        • Product Portfolio
        • Profitability by Market Segments (Product/Age /Sales Channel/Region)
        • Sales Footprint
        • Strategy Overview
          • Marketing Strategy
          • Product Strategy
          • Channel Strategy
      • Otsuka Pharmaceutical Co., Ltd
        • Overview
        • Product Portfolio
        • Profitability by Market Segments (Product/Age /Sales Channel/Region)
        • Sales Footprint
        • Strategy Overview
          • Marketing Strategy
          • Product Strategy
          • Channel Strategy
      • Gelita AG
        • Overview
        • Product Portfolio
        • Profitability by Market Segments (Product/Age /Sales Channel/Region)
        • Sales Footprint
        • Strategy Overview
          • Marketing Strategy
          • Product Strategy
          • Channel Strategy
      • Mead Johnson & Company, LLC
        • Overview
        • Product Portfolio
        • Profitability by Market Segments (Product/Age /Sales Channel/Region)
        • Sales Footprint
        • Strategy Overview
          • Marketing Strategy
          • Product Strategy
          • Channel Strategy
  20. Assumptions & Acronyms Used
  21. Research Methodology

List of Tables

  • Table 1: Global Market Value (USD Million) Forecast by Region, 2020-2035
  • Table 2: Global Market Volume (units) Forecast by Region, 2020-2035
  • Table 3: Global Market Value (USD Million) Forecast by Product Type, 2020-2035
  • Table 4: Global Market Volume (units) Forecast by Product Type, 2020-2035
  • Table 5: Global Market Value (USD Million) Forecast by Primary Ingredients, 2020-2035
  • Table 6: Global Market Volume (units) Forecast by Primary Ingredients, 2020-2035
  • Table 7: Global Market Value (USD Million) Forecast by Sales Channel, 2020-2035
  • Table 8: Global Market Volume (units) Forecast by Sales Channel, 2020-2035
  • Table 9: North America Market Value (USD Million) Forecast by Country, 2020-2035
  • Table 10: North America Market Volume (units) Forecast by Country, 2020-2035
  • Table 11: North America Market Value (USD Million) Forecast by Product Type, 2020-2035
  • Table 12: North America Market Volume (units) Forecast by Product Type, 2020-2035
  • Table 13: North America Market Value (USD Million) Forecast by Primary Ingredients, 2020-2035
  • Table 14: North America Market Volume (units) Forecast by Primary Ingredients, 2020-2035
  • Table 15: North America Market Value (USD Million) Forecast by Sales Channel, 2020-2035
  • Table 16: North America Market Volume (units) Forecast by Sales Channel, 2020-2035
  • Table 17: Latin America Market Value (USD Million) Forecast by Country, 2020-2035
  • Table 18: Latin America Market Volume (units) Forecast by Country, 2020-2035
  • Table 19: Latin America Market Value (USD Million) Forecast by Product Type, 2020-2035
  • Table 20: Latin America Market Volume (units) Forecast by Product Type, 2020-2035
  • Table 21: Latin America Market Value (USD Million) Forecast by Primary Ingredients, 2020-2035
  • Table 22: Latin America Market Volume (units) Forecast by Primary Ingredients, 2020-2035
  • Table 23: Latin America Market Value (USD Million) Forecast by Sales Channel, 2020-2035
  • Table 24: Latin America Market Volume (units) Forecast by Sales Channel, 2020-2035
  • Table 25: Western Europe Market Value (USD Million) Forecast by Country, 2020-2035
  • Table 26: Western Europe Market Volume (units) Forecast by Country, 2020-2035
  • Table 27: Western Europe Market Value (USD Million) Forecast by Product Type, 2020-2035
  • Table 28: Western Europe Market Volume (units) Forecast by Product Type, 2020-2035
  • Table 29: Western Europe Market Value (USD Million) Forecast by Primary Ingredients, 2020-2035
  • Table 30: Western Europe Market Volume (units) Forecast by Primary Ingredients, 2020-2035
  • Table 31: Western Europe Market Value (USD Million) Forecast by Sales Channel, 2020-2035
  • Table 32: Western Europe Market Volume (units) Forecast by Sales Channel, 2020-2035
  • Table 33: Eastern Europe Market Value (USD Million) Forecast by Country, 2020-2035
  • Table 34: Eastern Europe Market Volume (units) Forecast by Country, 2020-2035
  • Table 35: Eastern Europe Market Value (USD Million) Forecast by Product Type, 2020-2035
  • Table 36: Eastern Europe Market Volume (units) Forecast by Product Type, 2020-2035
  • Table 37: Eastern Europe Market Value (USD Million) Forecast by Primary Ingredients, 2020-2035
  • Table 38: Eastern Europe Market Volume (units) Forecast by Primary Ingredients, 2020-2035
  • Table 39: Eastern Europe Market Value (USD Million) Forecast by Sales Channel, 2020-2035
  • Table 40: Eastern Europe Market Volume (units) Forecast by Sales Channel, 2020-2035
  • Table 41: East Asia Market Value (USD Million) Forecast by Country, 2020-2035
  • Table 42: East Asia Market Volume (units) Forecast by Country, 2020-2035
  • Table 43: East Asia Market Value (USD Million) Forecast by Product Type, 2020-2035
  • Table 44: East Asia Market Volume (units) Forecast by Product Type, 2020-2035
  • Table 45: East Asia Market Value (USD Million) Forecast by Primary Ingredients, 2020-2035
  • Table 46: East Asia Market Volume (units) Forecast by Primary Ingredients, 2020-2035
  • Table 47: East Asia Market Value (USD Million) Forecast by Sales Channel, 2020-2035
  • Table 48: East Asia Market Volume (units) Forecast by Sales Channel, 2020-2035
  • Table 49: South Asia & Pacific Market Value (USD Million) Forecast by Country, 2020-2035
  • Table 50: South Asia & Pacific Market Volume (units) Forecast by Country, 2020-2035
  • Table 51: South Asia & Pacific Market Value (USD Million) Forecast by Product Type, 2020-2035
  • Table 52: South Asia & Pacific Market Volume (units) Forecast by Product Type, 2020-2035
  • Table 53: South Asia & Pacific Market Value (USD Million) Forecast by Primary Ingredients, 2020-2035
  • Table 54: South Asia & Pacific Market Volume (units) Forecast by Primary Ingredients, 2020-2035
  • Table 55: South Asia & Pacific Market Value (USD Million) Forecast by Sales Channel, 2020-2035
  • Table 56: South Asia & Pacific Market Volume (units) Forecast by Sales Channel, 2020-2035
  • Table 57: Middle East and Africa Market Value (USD Million) Forecast by Country, 2020-2035
  • Table 58: Middle East and Africa Market Volume (units) Forecast by Country, 2020-2035
  • Table 59: Middle East and Africa Market Value (USD Million) Forecast by Product Type, 2020-2035
  • Table 60: Middle East and Africa Market Volume (units) Forecast by Product Type, 2020-2035
  • Table 61: Middle East and Africa Market Value (USD Million) Forecast by Primary Ingredients, 2020-2035
  • Table 62: Middle East and Africa Market Volume (units) Forecast by Primary Ingredients, 2020-2035
  • Table 63: Middle East and Africa Market Value (USD Million) Forecast by Sales Channel, 2020-2035
  • Table 64: Middle East and Africa Market Volume (units) Forecast by Sales Channel, 2020-2035

List of Figures

  • Figure 1: Global Market Volume (units) Forecast 2020-2035
  • Figure 2: Global Market Pricing Analysis
  • Figure 3: Global Market Value (USD Million) Forecast 2020-2035
  • Figure 4: Global Market Value Share and BPS Analysis by Product Type, 2025 and 2035
  • Figure 5: Global Market Y-o-Y Growth Comparison by Product Type, 2025-2035
  • Figure 6: Global Market Attractiveness Analysis by Product Type
  • Figure 7: Global Market Value Share and BPS Analysis by Primary Ingredients, 2025 and 2035
  • Figure 8: Global Market Y-o-Y Growth Comparison by Primary Ingredients, 2025-2035
  • Figure 9: Global Market Attractiveness Analysis by Primary Ingredients
  • Figure 10: Global Market Value Share and BPS Analysis by Sales Channel, 2025 and 2035
  • Figure 11: Global Market Y-o-Y Growth Comparison by Sales Channel, 2025-2035
  • Figure 12: Global Market Attractiveness Analysis by Sales Channel
  • Figure 13: Global Market Value (USD Million) Share and BPS Analysis by Region, 2025 and 2035
  • Figure 14: Global Market Y-o-Y Growth Comparison by Region, 2025-2035
  • Figure 15: Global Market Attractiveness Analysis by Region
  • Figure 16: North America Market Incremental $ Opportunity, 2025-2035
  • Figure 17: Latin America Market Incremental $ Opportunity, 2025-2035
  • Figure 18: Western Europe Market Incremental $ Opportunity, 2025-2035
  • Figure 19: Eastern Europe Market Incremental $ Opportunity, 2025-2035
  • Figure 20: East Asia Market Incremental $ Opportunity, 2025-2035
  • Figure 21: South Asia & Pacific Market Incremental $ Opportunity, 2025-2035
  • Figure 22: Middle East and Africa Market Incremental $ Opportunity, 2025-2035
  • Figure 23: North America Market Value Share and BPS Analysis by Country, 2025 and 2035
  • Figure 24: North America Market Value Share and BPS Analysis by Product Type, 2025 and 2035
  • Figure 25: North America Market Y-o-Y Growth Comparison by Product Type, 2025-2035
  • Figure 26: North America Market Attractiveness Analysis by Product Type
  • Figure 27: North America Market Value Share and BPS Analysis by Primary Ingredients, 2025 and 2035
  • Figure 28: North America Market Y-o-Y Growth Comparison by Primary Ingredients, 2025-2035
  • Figure 29: North America Market Attractiveness Analysis by Primary Ingredients
  • Figure 30: North America Market Value Share and BPS Analysis by Sales Channel, 2025 and 2035
  • Figure 31: North America Market Y-o-Y Growth Comparison by Sales Channel, 2025-2035
  • Figure 32: North America Market Attractiveness Analysis by Sales Channel
  • Figure 33: Latin America Market Value Share and BPS Analysis by Country, 2025 and 2035
  • Figure 34: Latin America Market Value Share and BPS Analysis by Product Type, 2025 and 2035
  • Figure 35: Latin America Market Y-o-Y Growth Comparison by Product Type, 2025-2035
  • Figure 36: Latin America Market Attractiveness Analysis by Product Type
  • Figure 37: Latin America Market Value Share and BPS Analysis by Primary Ingredients, 2025 and 2035
  • Figure 38: Latin America Market Y-o-Y Growth Comparison by Primary Ingredients, 2025-2035
  • Figure 39: Latin America Market Attractiveness Analysis by Primary Ingredients
  • Figure 40: Latin America Market Value Share and BPS Analysis by Sales Channel, 2025 and 2035
  • Figure 41: Latin America Market Y-o-Y Growth Comparison by Sales Channel, 2025-2035
  • Figure 42: Latin America Market Attractiveness Analysis by Sales Channel
  • Figure 43: Western Europe Market Value Share and BPS Analysis by Country, 2025 and 2035
  • Figure 44: Western Europe Market Value Share and BPS Analysis by Product Type, 2025 and 2035
  • Figure 45: Western Europe Market Y-o-Y Growth Comparison by Product Type, 2025-2035
  • Figure 46: Western Europe Market Attractiveness Analysis by Product Type
  • Figure 47: Western Europe Market Value Share and BPS Analysis by Primary Ingredients, 2025 and 2035
  • Figure 48: Western Europe Market Y-o-Y Growth Comparison by Primary Ingredients, 2025-2035
  • Figure 49: Western Europe Market Attractiveness Analysis by Primary Ingredients
  • Figure 50: Western Europe Market Value Share and BPS Analysis by Sales Channel, 2025 and 2035
  • Figure 51: Western Europe Market Y-o-Y Growth Comparison by Sales Channel, 2025-2035
  • Figure 52: Western Europe Market Attractiveness Analysis by Sales Channel
  • Figure 53: Eastern Europe Market Value Share and BPS Analysis by Country, 2025 and 2035
  • Figure 54: Eastern Europe Market Value Share and BPS Analysis by Product Type, 2025 and 2035
  • Figure 55: Eastern Europe Market Y-o-Y Growth Comparison by Product Type, 2025-2035
  • Figure 56: Eastern Europe Market Attractiveness Analysis by Product Type
  • Figure 57: Eastern Europe Market Value Share and BPS Analysis by Primary Ingredients, 2025 and 2035
  • Figure 58: Eastern Europe Market Y-o-Y Growth Comparison by Primary Ingredients, 2025-2035
  • Figure 59: Eastern Europe Market Attractiveness Analysis by Primary Ingredients
  • Figure 60: Eastern Europe Market Value Share and BPS Analysis by Sales Channel, 2025 and 2035
  • Figure 61: Eastern Europe Market Y-o-Y Growth Comparison by Sales Channel, 2025-2035
  • Figure 62: Eastern Europe Market Attractiveness Analysis by Sales Channel
  • Figure 63: East Asia Market Value Share and BPS Analysis by Country, 2025 and 2035
  • Figure 64: East Asia Market Value Share and BPS Analysis by Product Type, 2025 and 2035
  • Figure 65: East Asia Market Y-o-Y Growth Comparison by Product Type, 2025-2035
  • Figure 66: East Asia Market Attractiveness Analysis by Product Type
  • Figure 67: East Asia Market Value Share and BPS Analysis by Primary Ingredients, 2025 and 2035
  • Figure 68: East Asia Market Y-o-Y Growth Comparison by Primary Ingredients, 2025-2035
  • Figure 69: East Asia Market Attractiveness Analysis by Primary Ingredients
  • Figure 70: East Asia Market Value Share and BPS Analysis by Sales Channel, 2025 and 2035
  • Figure 71: East Asia Market Y-o-Y Growth Comparison by Sales Channel, 2025-2035
  • Figure 72: East Asia Market Attractiveness Analysis by Sales Channel
  • Figure 73: South Asia & Pacific Market Value Share and BPS Analysis by Country, 2025 and 2035
  • Figure 74: South Asia & Pacific Market Value Share and BPS Analysis by Product Type, 2025 and 2035
  • Figure 75: South Asia & Pacific Market Y-o-Y Growth Comparison by Product Type, 2025-2035
  • Figure 76: South Asia & Pacific Market Attractiveness Analysis by Product Type
  • Figure 77: South Asia & Pacific Market Value Share and BPS Analysis by Primary Ingredients, 2025 and 2035
  • Figure 78: South Asia & Pacific Market Y-o-Y Growth Comparison by Primary Ingredients, 2025-2035
  • Figure 79: South Asia & Pacific Market Attractiveness Analysis by Primary Ingredients
  • Figure 80: South Asia & Pacific Market Value Share and BPS Analysis by Sales Channel, 2025 and 2035
  • Figure 81: South Asia & Pacific Market Y-o-Y Growth Comparison by Sales Channel, 2025-2035
  • Figure 82: South Asia & Pacific Market Attractiveness Analysis by Sales Channel
  • Figure 83: Middle East and Africa Market Value Share and BPS Analysis by Country, 2025 and 2035
  • Figure 84: Middle East and Africa Market Value Share and BPS Analysis by Product Type, 2025 and 2035
  • Figure 85: Middle East and Africa Market Y-o-Y Growth Comparison by Product Type, 2025-2035
  • Figure 86: Middle East and Africa Market Attractiveness Analysis by Product Type
  • Figure 87: Middle East and Africa Market Value Share and BPS Analysis by Primary Ingredients, 2025 and 2035
  • Figure 88: Middle East and Africa Market Y-o-Y Growth Comparison by Primary Ingredients, 2025-2035
  • Figure 89: Middle East and Africa Market Attractiveness Analysis by Primary Ingredients
  • Figure 90: Middle East and Africa Market Value Share and BPS Analysis by Sales Channel, 2025 and 2035
  • Figure 91: Middle East and Africa Market Y-o-Y Growth Comparison by Sales Channel, 2025-2035
  • Figure 92: Middle East and Africa Market Attractiveness Analysis by Sales Channel
  • Figure 93: Global Market - Tier Structure Analysis
  • Figure 94: Global Market - Company Share Analysis

Frequently Asked Questions

What is the projected size of the prenatal nutrition market in 2025?

The market size is valued at USD 995.5 million in 2025.

What is the outlook on prenatal nutrition demand by 2035?

The market is forecasted to reach USD 2,227.5 million by 2035, reflecting a CAGR of 8.4%.

Which product type leads the prenatal nutrition market in 2025?

Supplements are expected to lead the market with over 52% share in 2025.

What is the projected share of iron in the primary ingredient segment of the prenatal nutrition market by 2025?

Iron is projected to hold approximately a 25% share of the market in 2025.

Which country is projected to have the fastest-growing prenatal nutrition market?

Japan is anticipated to be the fastest-growing market with a CAGR of 6.7% from 2025 to 2035.

Explore Similar Insights

Future Market Insights

Prenatal Nutrition Market