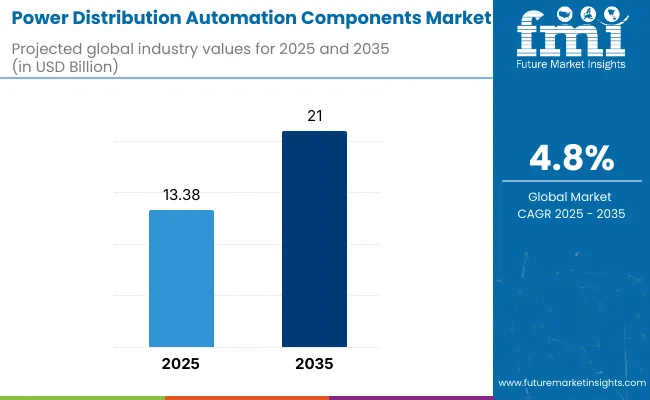
The power distribution automation components market is set to reach USD 13.38 billion in 2025. During the forecast period between 2025 to 2035, the power distribution automation components sales are likely to surge at a CAGR of 4.8%. The total industry value at the end of 2035 is likely to reach USD 21.0 billion.

In 2024, the industry for power distribution automation components saw significant developments based on technological innovations and growing demand for efficient power distribution. Several industrial players launched cutting-edge solutions to improve grid efficiency and include renewable energy sources.
The industry is expected to follow its growth path during the projection period between 2025 and 2035. It is driven by several modernization of old grids and the rising global need for electricity. Also, IoT and AI technologies' convergence is projected to improve grid optimization and efficiency, thereby driving industry growth further.
The power distribution automation component industry is witnessing robust growth through grid modernization, rising integration of renewable energy, and implementation of IoT and AI-based automation. Utilities and industrial customers who invest in smart grid infrastructure have the most to gain, with manufacturers challenged by supply chain shortages, especially transformers.
Businesses with innovative automation offerings will have the upper hand, while those struggling to increase manufacturing may see it delayed and experience lost industry share.
Accelerate Smart Grid Investments
Executives should prioritize investments in automation, IoT, and AI-driven grid optimization to enhance efficiency and resilience. Strengthening cybersecurity measures for digital grids is also critical as connectivity increases.
Secure Supply Chain and Manufacturing Resilience
With transformer shortages and component supply constraints, companies must diversify suppliers, invest in localized manufacturing, and explore alternative materials or modular designs to mitigate risks and avoid project delays.
Expand Strategic Partnerships and M&A
Collaborating with technology firms, utilities, and energy storage providers will enable faster deployment of automation solutions. Mergers and acquisitions in energy software, AI, and smart grid technologies can accelerate innovation and industry leadership.
| Risk | Probability / Impact |
|---|---|
| Supply Chain Disruptions (Transformer & Components Shortages) | High Probability / High Impact |
| Regulatory and Policy Uncertainty | Medium Probability / High Impact |
| Cybersecurity Threats to Grid Infrastructure | High Probability / Severe Impact |
| Priority | Immediate Action |
|---|---|
| Mitigate Supply Chain Risks | Diversify suppliers and assess the feasibility of localized manufacturing. |
| Advanced Smart Grid & AI Integration | Initiate pilot projects with AI-driven automation solutions. |
| Strengthen Cybersecurity in Power Networks | Conduct a comprehensive cybersecurity audit and risk assessment. |
To stay ahead in the industry, the company needs to act with purpose on grid modernization, supply chain resilience, and digital security. Investments in AI-based automation and IoT integration at the earliest will improve efficiency and grid stability, while ahead-of-time supplier diversification can address the continuing shortage of transformers.
Cybersecurity protocols need to be tightened to secure critical infrastructure against increasing threats. By matching R&D, strategic alliances, and capital allocation to these priorities, the company can establish a leadership position in the energy transformation wave of the future.
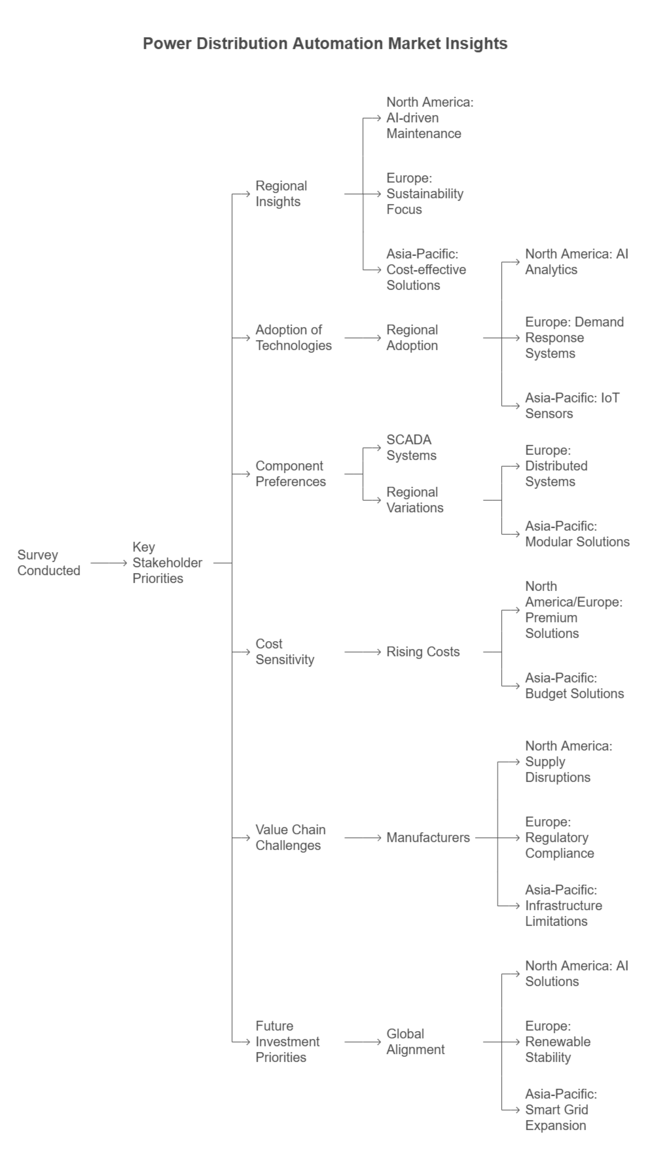
Survey conducted in Q4 2024, n=450 stakeholders (manufacturers, utilities, technology providers, policymakers) across North America, Europe, and Asia-Pacific.
Regional Insights:
Return on Investment (ROI) Considerations:
SCADA Dominates: 66% of global respondents prioritize SCADA systems for centralized monitoring and control.
Regional Variations:
Manufacturers:
Utilities & Distributors:
End-Users (Grid Operators & Policymakers):
Global Alignment: 76% of manufacturers plan increased R&D investment in AI-based automation.
Regional Focus Areas:
Consensus Areas:
Regional Divergence:
Strategic Implications:

| Country | Policies, Regulations, and Certifications |
|---|---|
| United States | NERC and FERC mandates on grid cybersecurity and reliability standards are driving automation investments. Utilities must comply with NIST cybersecurity guidelines. |
| Canada | The Canadian Energy Strategy supports grid modernization with incentives for smart grid technology adoption. Compliance with CSA Group standards is required. |
| Germany | The EU Clean Energy Package mandates automation for renewable integration. Utilities must meet DIN VDE and IEC 61850 automation standards. |
| United Kingdom | OFGEM’s RIIO-ED2 framework incentivizes automation upgrades. Mandatory compliance with Cyber Assessment Framework (CAF) for grid security. |
| France | RTE mandates smart grid automation under the Energy Transition Act. CNIL data privacy laws impact automation data management. |
| China | The 14th Five-Year Plan promotes grid automation with State Grid Corporation investment. Companies must meet GB/T power distribution standards. |
| Japan | METI supports smart grid expansion with tax incentives. Compliance with JIS C 4600 standards is mandatory for automation components. |
| India | The Smart Grid Mission mandates automation in urban distribution networks. Compliance with CEA (Central Electricity Authority) standards is required. |
| Australia | The AEMC Integrated System Plan encourages automation. Utilities must adhere to AS/NZS 61000 standards for grid components. |

The United States is a strong industry for power distribution automation solutions, fueled by continued grid modernization and the adoption of renewable energy sources. The USA industry is expected to be valued USD 3.8 billion by 2035.
Advanced metering infrastructure and smart grid technologies improve the efficiency and reliability of power distribution networks. Government programs and funding initiatives for enhancing grid resilience further enhance industrial development.
The rising need for real-time monitoring and control systems and the desire to minimize operational expenditure drive utilities to invest in automation solutions. Further, the presence of prominent industry players and advances in technology aid in the constant development of this industry.
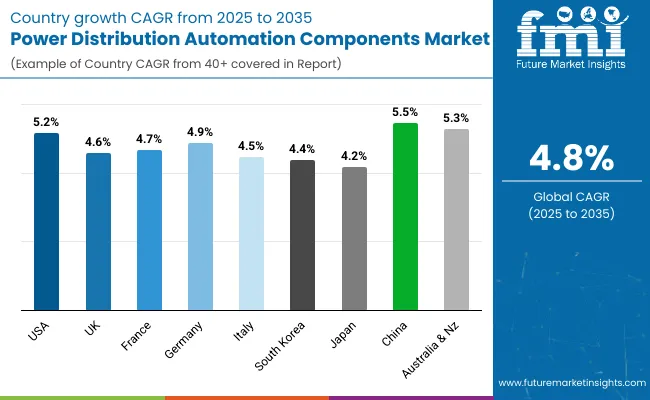
FMI opines that the United States power distribution automation components sales will grow at nearly 5.2% CAGR through 2025 to 2035.
In the United Kingdom, the power distribution automation components industry is expanding because the nation intends to cut down carbon emissions and raise the portion of renewable power in its generation mix. Smart grid development and energy efficiency drive the UK toward the use of automation components.
Government regulations and policies to reach net-zero emissions by 2050 promote utilities to invest in next-generation distribution automation technologies. The incorporation of distributed energy resources like solar and wind requires advanced monitoring and control systems to handle variability and maintain grid stability. These are the factors that drive industry growth in the UK.
FMI opines that the United Kingdom's power distribution automation components sales will grow at nearly 4.6% CAGR through 2025 to 2035.
The French power distribution automation components industry is driven by France's high level of focus on nuclear power and the slow assimilation of renewable energy sources. The efforts by the French government to upgrade the electrical grid and enhance energy efficiency propel the take-up of automation technologies.
Smart meter deployment and smart grid formation are major industry drivers. Moreover, France's involvement in the energy policies and regulations of the European Union encourages the adoption of state-of-the-art distribution automation solutions to meet energy transition objectives.
FMI opines that the France power distribution automation components sales will grow at nearly 4.7% CAGR through 2025 to 2035.
Power distribution automation parts in Germany's industry are supported by Germany's Energiewende policy, which aims to shift to a sustainable energy system. Integrating a high percentage of renewable energy, such as wind and solar, necessitates sophisticated automation solutions to ensure grid reliability and stability. Smart grid technology investments and the upgrade of old infrastructure propel the demand for distribution automation parts.
Partnership among utilities, technology companies, and research and development institutions triggers innovation and creating sophisticated solutions custom-made for the German industry.
FMI opines that Germany’s power distribution automation components sales will grow at nearly 4.9% CAGR through 2025 to 2035.
The Italian power distribution automation parts industry is expanding owing to the drive by the nation to improve grid reliability and harness renewable energy. The policies of the government of Italy to enhance energy efficiency and cut carbon emissions stimulate the use of smart grid technology. The installation of smart metering infrastructure and automation solutions allows utilities to distribute energy more efficiently and react quickly to failures.
Moreover, Italy's role in European energy projects facilitates the use of advanced distribution automation systems to realize wider energy transition goals.
FMI opines that the Italy power distribution automation components sales will grow at nearly 4.5% CAGR through 2025 to 2035.
South Korea's power distribution automation components industry is expanding due to the country's focus on enhancing grid efficiency and reliability. The government's initiatives to integrate renewable energy sources and develop smart grids drive the adoption of automation technologies. Investments in advanced metering infrastructure and real-time monitoring systems enable utilities to optimize energy distribution and improve fault detection and response.
In addition, the focus of South Korea on technological innovation and the availability of major technology firms help fuel the industry.
FMI opines that the South Korea power distribution automation components sales will grow at nearly 4.4% CAGR through 2025 to 2035.
Japan's power distribution automation devices industry is fueled by the nation's highly developed technological environment and focus on energy efficiency. Japan's power distribution automation components industry is anticipated to be valued at USD 691.1 million by 2033. The implementation of smart grid technologies and automation solutions is crucial for the management of renewable energy sources integration and grid stability.
Government policies that encourage energy conservation and the creation of resilient infrastructure also drive industry growth. Japan's emphasis on innovation and the location of top technology firms are reasons for the growth and uptake of distribution automation components.
FMI opines that the Japan power distribution automation components sales will grow at nearly 4.2% CAGR through 2025 to 2035.
China's power distribution automation components industry is witnessing strong growth with the rapid urbanization and industrialization of the country. China's power distribution automation components sector is expected to surpass a valuation of USD 4.2 billion in 2033.
The large-scale penetration of smart meters and other advanced metering infrastructure is fueling the expansion of power distribution automation components in China. Government support and finance for grid automation and modernization initiatives are further accelerating industry growth. Furthermore, the necessity to enhance grid resiliency and reliability, particularly against extreme weather and natural disasters, is driving the use of automation solutions. Ongoing developments in automation technologies, including the Internet of Things (IoT), artificial intelligence (AI), and cloud computing.
FMI opines that China’s power distribution automation components sales will grow at nearly 5.5% CAGR through 2025 to 2035.
Australia and New Zealand are progressively developing their power distribution automation components industry, primarily stimulated by renewable energy integration and grid modernization initiatives. As both nations strive to achieve aggressive net-zero emissions targets by 2050, investments in smart grid infrastructure and automation technologies are gaining momentum.
Australia, with its immense solar and wind power resources, is introducing distributed energy resource management systems (DERMS) to manage the varying power generation. New Zealand's hydro-dominated power grid, in turn, is embracing automation to maximize load allocation and minimize outages.
Government policies, such as Australia's National Electricity Industry (NEM) modernization and New Zealand's Distribution Pricing Reform, encourage automation investments. Nevertheless, grid decentralization and cost limitations necessitate strategic deployment of smart meters, real-time monitoring, and AI-driven automation systems.
FMI opines that Australia-NZ power distribution automation components sales will grow at nearly 5.3% CAGR through 2025 to 2035.
The switching and component protection will be essential to power distribution automation. Reliable circuit breakers, reclosers, and automated switches will become more and more necessary as power grids grow more complex due to the integration of distributed energy systems and renewable energy sources. Switching & protecting components are likely to expand at a CAGR of 4.7% during the forecast period.
These elements improve grid stability, prevent faults, and guarantee continuous power flow. Faster fault detection and response will be made possible by the widespread adoption of advanced protective relays with digital communication capabilities. Investments in smart switching technologies will be fueled by self-healing networks as utilities prioritize grid resilience. With IoT-enabled protection devices, manufacturers will keep coming up with new ideas that will guarantee more effective remote operations and predictive maintenance.
There will be a significant increase in demand for monitoring devices as utilities and industries place a higher priority on real-time data collection and grid visibility. To improve operational efficiency and dependability, intelligent sensors, fault detectors, and SCADA (Supervisory Control and Data Acquisition) systems will be widely used. It will be necessary to continuously monitor power quality, voltage fluctuations, and load variations as distributed energy resources become more widely used.
The measuring devices are essential to precise energy measurement and billing. The sector will continue to grow. Power quality analyzers, smart meters, and advanced metering infrastructure (AMI) will all be necessary for effective energy management in commercial, residential, and industrial settings.
To facilitate demand-side management and guarantee accurate energy tracking, utilities will increase the deployment of digital metering solutions. Smart metering technologies will advance to accommodate load balancing and dynamic pricing as the use of electric vehicles (EVs) grows.
The industrial sector will remain the largest consumer of power distribution automation components throughout the forecast period. The adoption of automation solutions will be fueled by the need for a consistent and dependable power supply in the mining, oil and gas, and manufacturing sectors. In terms of end-users, the industrial sector is projected to showcase a CAGR of 4.5% from 2025 to 2035.
To increase productivity and lower operating costs, industrial facilities will increasingly incorporate remote-controlled protection devices, predictive maintenance systems, and smart switchgear. Investments in automated energy management systems and digital substations will increase due to the emergence of Industry 4.0 and smart manufacturing.
Power distribution automation will be essential to integrating renewable energy sources and optimizing energy use as industries shift to sustainable operations. Power distribution automation will significantly increase in the commercial sector as a result of growing urbanization and the development of commercial infrastructure, including data centers, office buildings, and retail establishments. Businesses will be compelled to implement automated energy monitoring and management systems due to energy efficiency regulations and sustainability goals.
Real-time load balancing in commercial buildings will be made possible by smart grids, which will cut down on peak demand fees and avoid energy waste. Automation technologies will be crucial for smooth power distribution and grid interaction as commercial buildings integrate more dispersed energy resources, such as solar panels and battery storage. Cost savings and operational transparency will be further improved by the use of cloud-based energy management platforms.
In the residential sector, power distribution automation will be adopted gradually but steadily due to the increasing use of renewable energy systems and smart home technologies. Smart meters and home energy management systems (HEMS) are becoming more widely used, giving customers the ability to track and optimize their electricity use.
To effectively manage household energy flows, the integration of solar panels, energy storage devices, and electric vehicle charging stations will require sophisticated automation. Homeowners will be encouraged to use load-balancing and automated switching systems through demand response programs and time-of-use pricing. Smart metering and home automation will be commonplace in residential energy systems as utilities update their distribution networks, improving energy efficiency and grid dependability.
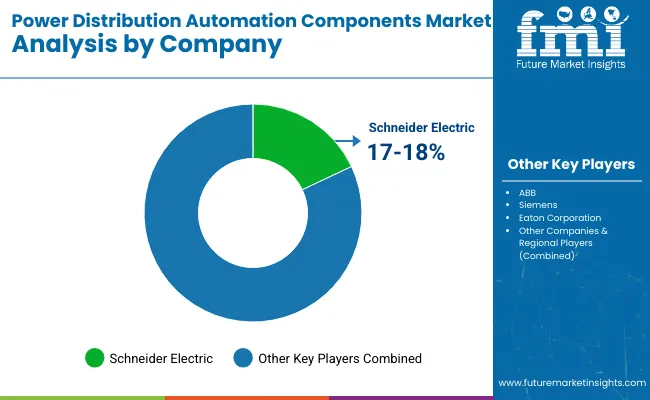
The power distribution automation components industry is moderately consolidated, with few industrial players holding significant shares of the industry. Top tier companies are competing by focusing on innovation, strategic alliances and geographic expansion, to improve their positions in the industry.
In May 2024, ABB signed a deal to buy Siemens's wiring Accessories business in China to boost its smart buildings portfolio and strengthen its foothold in the Chinese industry. Likewise, in August 2024, Hitachi Energy introduced the Relion REF650, a next-generation multi-application protection and control relay, as part of its focus on power automation innovation. These developments indicate the attention of industry towards technological growth and strategic expansion to keep up with the rising demand for reliable and effective power distribution solutions.

switching and protecting components, monitoring devices and measuring devices
Industrial, commercial and residential sector
North America, Latin America, Western Europe, Eastern Europe, South Asia and Pacific, East Asia and Middle East and Africa
Rising demand for grid modernization, renewable energy integration, and improved power reliability.
Manufacturing, oil & gas, data centers, and commercial buildings rely on automation for efficiency and uninterrupted power.
Strict energy efficiency laws and sustainability policies push utilities and businesses to adopt automation solutions.
IoT, AI, cloud computing, digital twins, and edge computing enhance real-time monitoring and predictive maintenance.
ABB, Siemens, Schneider Electric, Eaton, and Hitachi Energy lead with smart grid solutions and automation innovations.


Our Research Products

The "Full Research Suite" delivers actionable market intel, deep dives on markets or technologies, so clients act faster, cut risk, and unlock growth.

The Leaderboard benchmarks and ranks top vendors, classifying them as Established Leaders, Leading Challengers, or Disruptors & Challengers.

Locates where complements amplify value and substitutes erode it, forecasting net impact by horizon

We deliver granular, decision-grade intel: market sizing, 5-year forecasts, pricing, adoption, usage, revenue, and operational KPIs—plus competitor tracking, regulation, and value chains—across 60 countries broadly.

Spot the shifts before they hit your P&L. We track inflection points, adoption curves, pricing moves, and ecosystem plays to show where demand is heading, why it is changing, and what to do next across high-growth markets and disruptive tech

Real-time reads of user behavior. We track shifting priorities, perceptions of today’s and next-gen services, and provider experience, then pace how fast tech moves from trial to adoption, blending buyer, consumer, and channel inputs with social signals (#WhySwitch, #UX).

Partner with our analyst team to build a custom report designed around your business priorities. From analysing market trends to assessing competitors or crafting bespoke datasets, we tailor insights to your needs.
Supplier Intelligence
Discovery & Profiling
Capacity & Footprint
Performance & Risk
Compliance & Governance
Commercial Readiness
Who Supplies Whom
Scorecards & Shortlists
Playbooks & Docs
Category Intelligence
Definition & Scope
Demand & Use Cases
Cost Drivers
Market Structure
Supply Chain Map
Trade & Policy
Operating Norms
Deliverables
Buyer Intelligence
Account Basics
Spend & Scope
Procurement Model
Vendor Requirements
Terms & Policies
Entry Strategy
Pain Points & Triggers
Outputs
Pricing Analysis
Benchmarks
Trends
Should-Cost
Indexation
Landed Cost
Commercial Terms
Deliverables
Brand Analysis
Positioning & Value Prop
Share & Presence
Customer Evidence
Go-to-Market
Digital & Reputation
Compliance & Trust
KPIs & Gaps
Outputs
Full Research Suite comprises of:
Market outlook & trends analysis
Interviews & case studies
Strategic recommendations
Vendor profiles & capabilities analysis
5-year forecasts
8 regions and 60+ country-level data splits
Market segment data splits
12 months of continuous data updates
DELIVERED AS:
PDF EXCEL ONLINE
Power Grid Fault Prediction Service Market Size and Share Forecast Outlook 2025 to 2035
Power Plant Boiler Market Forecast Outlook 2025 to 2035
Power Ring Rolling Machine Market Size and Share Forecast Outlook 2025 to 2035
Power Supply Equipment for Data Center Market Size and Share Forecast Outlook 2025 to 2035
Power Electronics Market Size and Share Forecast Outlook 2025 to 2035
Power Quality Equipment Market Size and Share Forecast Outlook 2025 to 2035
Power Generator for Military Market Size and Share Forecast Outlook 2025 to 2035
Power Tools Market Size and Share Forecast Outlook 2025 to 2035
Power Supply Isolation Equipment Market Size and Share Forecast Outlook 2025 to 2035
Power Window Lift Motor Market Size and Share Forecast Outlook 2025 to 2035
Powered Surgical Staplers Market Size and Share Forecast Outlook 2025 to 2035
Power Over Ethernet (PoE) Controllers Market Size and Share Forecast Outlook 2025 to 2035
Power Inverter Market Size and Share Forecast Outlook 2025 to 2035
Power Sports Market Size and Share Forecast Outlook 2025 to 2035
Power Conditioner Market Size and Share Forecast Outlook 2025 to 2035
Power Control Commercial Surge Protection Devices Market Size and Share Forecast Outlook 2025 to 2035
Power Transmission Component Market Size and Share Forecast Outlook 2025 to 2035
Power Optimizer Market Size and Share Forecast Outlook 2025 to 2035
Power Plants Heavy Duty Gas Turbine Market Size and Share Forecast Outlook 2025 to 2035
Power Over Ethernet (PoE) Solutions Market Size and Share Forecast Outlook 2025 to 2035

Thank you!
You will receive an email from our Business Development Manager. Please be sure to check your SPAM/JUNK folder too.
Chat With
MaRIA