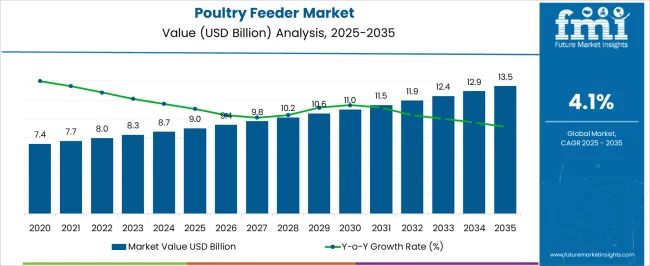
The Poultry Feeder Market is estimated to be valued at USD 9.0 billion in 2025 and is projected to reach USD 13.5 billion by 2035, registering a compound annual growth rate (CAGR) of 4.1% over the forecast period.
| Metric | Value |
|---|---|
| Poultry Feeder Market Estimated Value in (2025 E) | USD 9.0 billion |
| Poultry Feeder Market Forecast Value in (2035 F) | USD 13.5 billion |
| Forecast CAGR (2025 to 2035) | 4.1% |
The poultry feeder market is experiencing consistent growth driven by increasing demand for efficient and automated feeding solutions in commercial poultry farming. Growing emphasis on enhancing productivity, reducing feed wastage, and ensuring optimal nutrition is motivating the adoption of advanced feeding systems.
Industry stakeholders are increasingly prioritizing automation to streamline operations and improve flock health. Innovations in feeder designs, including durability and ease of cleaning, are enhancing the appeal of modern feeding solutions.
Regulatory focus on animal welfare and the rising scale of poultry production are expected to further propel market expansion. The integration of technology with feeding equipment to improve precision and minimize human intervention is paving the way for broader acceptance across diverse farming setups.
The market is segmented by Type and Application and region. By Type, the market is divided into Automatic Feeder and Manual Feeder. In terms of Application, the market is classified into Indoor and Outdoor. Regionally, the market is classified into North America, Latin America, Western Europe, Eastern Europe, Balkan & Baltic Countries, Russia & Belarus, Central Asia, East Asia, South Asia & Pacific, and the Middle East & Africa.
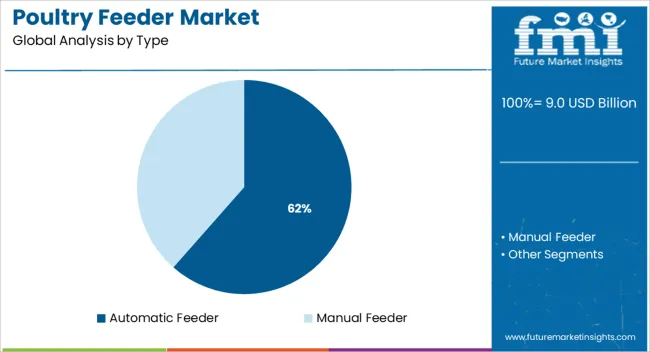
The automatic feeder segment holds a leading position with 61.5% share of the poultry feeder market revenue in 2025. This dominance is attributed to its ability to provide consistent and precise feed delivery, reducing labor costs and minimizing feed wastage.
The automation of feeding schedules supports optimized growth rates and better flock management, which are critical factors for commercial poultry producers. Increased operational efficiency and improved hygiene standards are facilitated by automated feeders, making them highly favored in large-scale and technologically advanced poultry farms.
The ongoing advancement in sensor technologies and integration with farm management systems have further strengthened this segment’s market leadership by enabling real-time monitoring and adjustments.
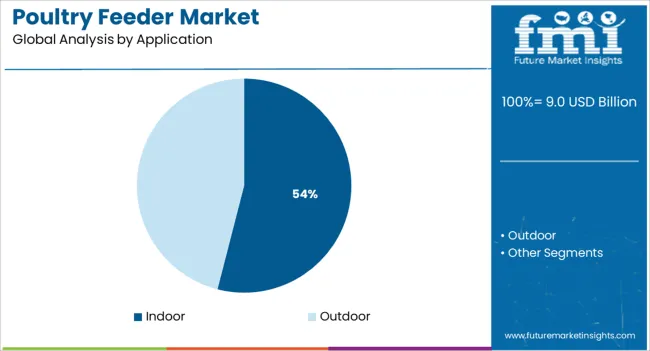
The indoor application segment is projected to command 54.0% of the market revenue in 2025, positioning it as the foremost application category. This segment’s growth is driven by the widespread adoption of controlled environment poultry farming practices aimed at maximizing productivity and biosecurity.
Indoor systems allow better control over feeding, temperature, and disease management, which are essential for maintaining high production standards. Increasing urbanization and limited availability of open farm spaces have accelerated the shift towards indoor poultry farming, reinforcing demand for indoor-compatible feeders.
The integration of indoor feeders with automated climate and health monitoring systems is further enabling poultry operators to optimize resource use and improve overall flock performance, consolidating this segment’s dominant position.
Over the forecast period, the preference for chicken feeders is likely to remain strong owing to the increasing awareness among breeders. Since weather can potentially damage the feed, poultry breeders prefer using feeders to protect the food while minimizing harm from erratic weather. These feeders also keep the food dry and germ-free.
Since poultry feeders provide breeders with several benefits, they are becoming increasingly popular. Raccoons, rats, and other pests frequently gather in large farm areas. Eventually, these creatures make their way into the coop and disturb the routine of the flock of birds. They end up eating the poultry feed as well.
Additionally, the long-term stimulus of the industry is the rising demand for items made from poultry meat. The amount and kind of nutrients that should be included in poultry diets are determined by the rate of egg production, the weight, age, and development of the poultry. Demand for poultry products is significantly impacted by population and income factors.
Another crucial aspect anticipated to boost the expansion of the market for poultry feeders includes farm owners' rising desire for systematizing procedures. It helps them to cut operational expenses and losses incurred during hand feeding.
Other factors boosting the market's expansion include rising industrial livestock production. For maximum consistency, flock homogeneity is the primary objective of poultry feeding systems. The market for poultry feeders is boosted by expanding farm sizes and considerable cost savings brought on by the use of feeding systems.
The potential for industrial expansion is being constrained by fluctuating raw material prices, environmental issues, and an increase in the frequency of poultry pathogens such as the avian flu. The high cost of installation and a lack of qualified experts are likely to serve as market barriers to the expansion of the poultry feeder market throughout the forecast period.
The biggest obstacle to the market's expansion will be the lack of a standardized feeding method. The demand for poultry products has decreased even more as a result of growing customer preferences for vegan or plant-based meals. The primary reason behind this is the rising awareness of health issues related to animal meat consumption. Therefore impeding the expansion of the worldwide market.
One of the main trends seen in the global poultry feeder market is the increasing usage of modern equipment in poultry farms. The automatic feeder is highly automated, handy for energy conservation, has a quick feeding period, and doesn't need a large workforce. Hence, the adoption of automatic feeders is expected to increase over the forecast period creating opportunities for market players.
Owing to its smooth and consistent transmission, which allows the entire machine to be fed uniformly, poultry farms are likely to prefer automated feeders. An even feeding mechanism is used by the automatic feeder. This can preserve the feed and reduce spillage from manual feeding. Additionally, it can save labor costs because it only requires one truck feeding and takes five to eight minutes to operate.
Additionally, an increasing number of big farms are likely to use automated feeding systems to meet the immense poultry demand. The market is also expected to witness growth prospects by the increased attention on technology developments including feeding pushers and feeding robots. Leading companies are focusing on the affordability of employing autonomous and battery-operated feeding robots.
The poultry feeder market is likely to expand at a 4.1% CAGR between 2025 and 2035. Historically, the market value of poultry feeders showed sluggish growth from 2020 to 2025, registering a CAGR of 3.7%.
Owing to the rise in demand for chicken meat, the poultry industry is one of the meat industries with the quickest growth. To feed the expanding world population, poultry production must be increased. The relatively lower cost of poultry meat compared to other meats, and consumer dietary preferences are all influencing the per capita consumption of poultry meat.
Sales of poultry feeders are likely to increase owing to the rising inclination of livestock farm owners to automate procedures. This is expected to cut operational expenses and losses incurred during manual feeding. This is anticipated to drive market growth for poultry feeders during the forecast period.
| Historical CAGR (2020 to 2025) | 3.7% |
|---|---|
| Forecast CAGR (2025 to 2035) | 4.1% |
Short Term (2025 to 2029): Greater government investment in animal production is likely to open up market prospects with the ability to generate revenue.
Medium Term (2029 to 2035): Growth opportunities are anticipated to arise as a result of the rising number of large-sized farms and the fast adoption of pioneering poultry farming practices.
Long Term (2035 to 2035): It is anticipated that the increased interest in technical developments involving feeding robots would open up new business prospects.
On the back of these factors, the poultry feeder market is likely to grow 1.5X between 2025 and 2035. As per the analysts, a valuation of USD 13.5 Billion by 2035 end is estimated for the market.
| 2020 | USD 6.43 Billion |
|---|---|
| 2020 | USD 7.70 Billion |
| 2025 | USD 7.98 Billion |
| 2025 | USD 8.31 Billion |
| 2035 | USD 13.5 Billion |
The highest market share is predicted to come from North America. The key driver of growth in this region is the rising level of knowledge among poultry producers regarding the advantages of efficient machinery.
The market for poultry feeders in the Asia Pacific is predicted to develop at the fastest rate. Livestock production accounts for a sizeable component of the region's total agricultural output in a number of the region's developing nations.
In comparison to beef or pig, poultry meat is more frequently consumed in the US than red meat overall since it is a convenient food and health as well. This is expected to lead to a significant rise in the demand for nutritious food items, such as chicken products, which are also a cost-effective source of protein. Therefore, improved infrastructure and facilities are needed for the management of poultry.
| Country | United States of America |
|---|---|
| Market Share (2025) | 26.8% |
| Market Value (2025) | USD 2.13 Billion |
The adoption of cutting-edge poultry equipment is rising in the USA. The expansion of poultry farms is also anticipated to encourage the use of automated feeding systems. This is projected to lower labor costs and raise farm productivity so that more poultry products can be produced.
Another important element fueling the expansion of the US poultry feeder market is the rising demand for healthy and tasty chicken products from the country's main fast food chains. This chain includes McDonald's, KFC, Subway, and Taco Bell which necessitates a continuous supply of chicken to run the business. Hence, to increase production, farms, and breeders increasingly adopt both poultry feed and feeders.
Significant prospects for market participants in the poultry feeder industry are anticipated to arise from rising chicken production in Europe. The market is expected to grow throughout the region over the forecast period as a result of consumers' inclination towards poultry products due to their affordable costs in comparison to alternatives.
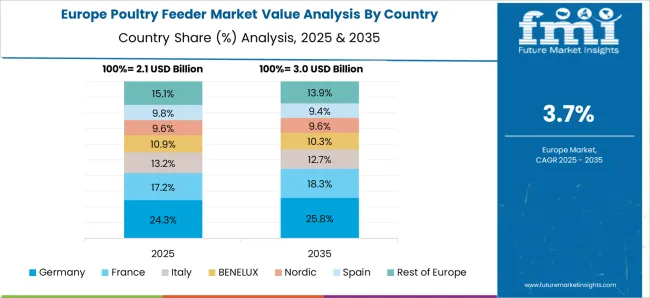
The livestock population in Germany is being driven by the rising demand for chicken and turkey. The emergence of several chronic illnesses in Germany has caused consumers to become more conscious of their fitness and health. The low prices of poultry influence customers' ability to make purchases. The increase in domestic poultry product demand is a result of cheap pricing.
| Country | Germany |
|---|---|
| Market Share (2025) | 17.4% |
| Market Value (2025) | USD 1.38 Billion |
Farmers rely on feed to get livestock to perform well and acquire weight quickly over a short period. Livestock farmers have significant difficulty in producing high-quality and healthy meat to meet the requirements of the meat processing industry. Farms are rapidly adopting feeders to simplify the feeding procedure to increase productivity.
Growing consumer demand for animal protein and the expansion of the poultry business is driving the development of the poultry business in the UK. Rising meat consumption and growing health consciousness about protein consumption are likely to accelerate the expansion of the UK poultry feed business. This is likely to increase the adoption of poultry feeders to feed huge chunks of animals within a short period.
| Country | United Kingdom |
|---|---|
| CAGR (2025) | 4.4% |
| Market Share (2025) | 9.1% |
| Market Value (2025) | USD 724.9 Million |
| Market Value (2035) | USD 1.11 Billion |
Marks and Spencer, a UK store, announced a redesign of their Hubbard slower-growing, welfare-friendly bird and a switch to 100% British chicken throughout its whole line of poultry. The retail company used to get its chicken from a variety of British and European farms.
The demand for animal feed and feeders is rising across the nation as people become more aware of how animal feed helps to improve the diets of farm animals. All these factors are likely to create massive demand for poultry feeders. Hence, the UK poultry feeder market has great potential for the market players.
The Asia Pacific market for poultry feeders is anticipated to have the fastest growth rate. In several emerging nations of the region, livestock production makes up a significant portion of the region's overall agricultural output. As a result, the quick uptake of modern poultry farming techniques and the rise of SMEs and local companies are key drivers of the Asia Pacific market growth.
The poultry industry in China has had some UPS and downs recently. As the domestic pig herd was decimated by African swine disease, the chicken took the role of pork as China's main source of protein. Hence, there are several opportunities for the poultry feeder market players. As a result, significant corporations are investing in the modernization of the poultry industry in China to satisfy the demand.
| Country | China |
|---|---|
| CAGR (2025) | 3.3% |
| Market Share (2025) | 9.5% |
| Market Value (2025) | USD 757.47 Million |
| Market Value (2035) | USD 1.04 Billion |
Large corporations like Cargill and equipment manufacturers both have operations in China. In terms of scale, technology, and standards, the company's poultry operations in China are more akin to those in the US and UK. This is anticipated to contribute to the distribution and sales of poultry feeders to feed the farm animal properly.
One of the agricultural industries in India with the quickest growth is poultry. This industry is predicted to rise as a result of changing lifestyles, rising disposable income, and population expansion. Currently, India is one of the world's top producers of livestock feed. India, therefore, has enormous prospects in the poultry feeder industry since it has remained an untouched market in terms of farmers' use of leading-edge feeding methods.
| Country | India |
|---|---|
| CAGR (2025) | 4.8% |
| Market Share (2025) | 3.8% |
| Market Value (2025) | USD 301.4 Million |
| Market Value (2035) | USD 482.3 Million |
The Indian poultry feeder market is currently expanding. Farmers are becoming more conscious of the connection between production and animal health. These elements indicate enormous investment prospects in the Indian feeding industry for both local and international poultry feeder market players.
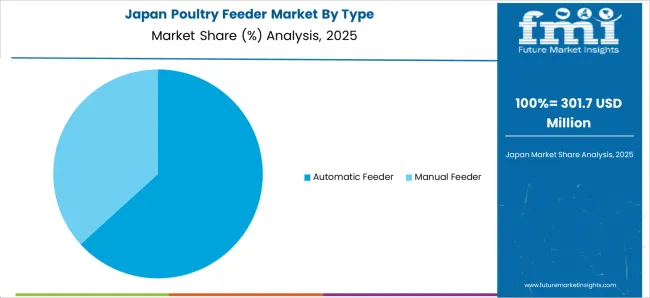
As meat consumption rises amid changing lifestyles, Japan is becoming a country of meat eaters. Pork and chicken meat consumption in particular is becoming more prevalent across the nation. However, imported meat makes up the majority of the country's meat consumption.
| Country | Japan |
|---|---|
| Market Share (2025) | 4.0% |
| Market Value (2025) | USD 319.9 Million |
Hence, pressure is being put on local farmers to expand production to keep up with demand due to the rising cost of imported meat and the continual rise in meat consumption. Since animal farming is expected to develop at a healthy pace over the forecast period, there is likely to be an increase in demand for poultry feeders.
The global poultry feeder market is segmented based on capacity, product type, bird capacity, and region.
The 1-5 Kg capacity segment dominated the market in 2025. This segment is anticipated to maintain its market dominance over the forecast period. Growth in the segment is expected to be fueled by the increased demand for poultry products. This has given local farms the chance to boost animal productivity.
Additionally, poultry farmers prefer using comparatively small feeders. This not only saves money but also lessens the attention of rodents like rats and mice. Moreover, demand for 1-5Kg capacity feeders is growing since the majority of these feeders are circular hanging tube feeders. These feeding methods are the best since they are effective and evenly distributed.
In 2025, feeding equipment accounted for the highest percentage. This is attributed to rising customer preference for hardware systems and the rising necessity for feeding systems. Additionally, this market is anticipated to benefit from an increase in the poultry population and technical developments by major companies to launch novel feeders.
Additionally, the growing desire for feeding systems and the industrialization of farming as a result of workforce scarcity are fueling this market's expansion. Moreover, the preference for feeding equipment is growing since it reduces the possibility of bacterial, viral, or parasitic infection.
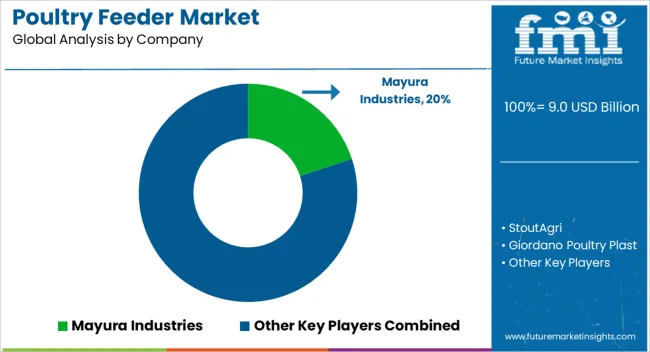
Demand for farm equipment is expected to rise as customers' propensity to consume meat and related products increases globally. Newcomers to the poultry feeder industry consider that to maintain leadership, they must increase their competitive edge. They make major investments in Research and Development in addition to focusing on product launches to gain a foothold in the global poultry industry.
Leading Start-ups to Keep an Eye on
| Start-up Company | Poultry Life |
|---|---|
| Country | United States of America |
| Description | Poultry Life is an online vendor of chicken supplies. Feeders, treats, mealworms, shrimp snacks, waterers, sprouts, farm supplies, and feed are just a few of the items it sells. The business sells goods under several labels, including Henny Penny, Chipper Chicken, Cluck Yea, Pullet Together, and Poultry Snack Pak. Additionally, it provides delivery services internationally. |
| Start-up Company | South Indian Poultry Equipment |
|---|---|
| Country | India |
| Description | South Indian Poultry Equipments is a partnership-based company that was established in the year 2011 in Ernakulam, Kerala. It participates as a producer of plastic drinkware, poultry fans, bird feeders, plastic cans, and poultry equipment. It is a well-known company that specializes in offering an exceptional selection of these items. |
In addition to developing cutting-edge technologies and systems for poultry feeding equipment, businesses in the poultry feeder industry seek to improve their current products. Additionally, they are developing fruitful relationships with other businesses involved in the poultry industry, particularly those who make feed, in addition to poultry firms. They reach several agreements to increase their entry into profitable markets.
SKA Poultry Equipment
SKA has been designing and manufacturing commercial chicken feeders that meet the needs of free-range and organic farming since 1954. The various needs of chicks and adult birds are accommodated by automated feeder models for poultry farms. They are made with consideration for their unique characteristics, based on an investigation of animal behavior.
Kenpoly Manufacturers Limited
A modern-day innovator in the plastics sector, Kenpoly Manufacturers Limited is a diverse business. Its extensive line of plastic goods includes packaging, agricultural, industrial, and domestic goods. In practically every sphere of life, Kenpoly products are used in an endless number of ways.
INDIV USA
INDIV is a Reputable Supplier of Equipment for the Poultry Industry. Its products include poultry supplies, feeders, and drinkers for poultry, as well as hardware, tools, buildings, and accessories.
The global poultry feeder market is estimated to be valued at USD 9.0 billion in 2025.
The market size for the poultry feeder market is projected to reach USD 13.5 billion by 2035.
The poultry feeder market is expected to grow at a 4.1% CAGR between 2025 and 2035.
The key product types in poultry feeder market are automatic feeder and manual feeder.
In terms of application, indoor segment to command 54.0% share in the poultry feeder market in 2025.


Full Research Suite comprises of:
Market outlook & trends analysis
Interviews & case studies
Strategic recommendations
Vendor profiles & capabilities analysis
5-year forecasts
8 regions and 60+ country-level data splits
Market segment data splits
12 months of continuous data updates
DELIVERED AS:
PDF EXCEL ONLINE
Poultry Cutting System Market Size and Share Forecast Outlook 2025 to 2035
Poultry Diagnostic Testing Market Size and Share Forecast Outlook 2025 to 2035
Poultry Farming Equipment Market Size and Share Forecast Outlook 2025 to 2035
Poultry Processing Equipment Market Size and Share Forecast Outlook 2025 to 2035
Poultry Seasoning Market Size, Growth, and Forecast for 2025 to 2035
Poultry Diagnostics Market - Demand, Growth & Forecast 2025 to 2035
Poultry Packaging Market Insights - Trends & Future Outlook 2025 to 2035
Poultry Vitamins Market Analysis - Size, Share & Forecast 2025 to 2035
Poultry Brooder Market Trend Analysis Based on Type, Operation, Poultry, Distribution Channel, and Region 2025 to 2035
Poultry Feed Market Analysis by Livestock, Nature, Feed Type, Form, and Region from 2025 to 2035
Poultry Keeping Machinery Market Growth - Trends & Forecast 2025 to 2035
Poultry Meal Market – Growth, Demand & Nutritional Benefits
Poultry Concentrate Market
Meat, Poultry, and Seafood Packaging Market Size and Share Forecast Outlook 2025 to 2035
Market Share Breakdown of Meat, Poultry, and Seafood Packaging Manufacturers
Rendered Poultry Products Market Analysis by Type and Grade Through 2035
Precision Poultry Nutrition Market – Growth, Demand & Livestock Trends
Feeder Container Market Size and Share Forecast Outlook 2025 to 2035
Hog Feeder Market Size and Share Forecast Outlook 2025 to 2035
Belt Feeders Market Size and Share Forecast Outlook 2025 to 2035

Thank you!
You will receive an email from our Business Development Manager. Please be sure to check your SPAM/JUNK folder too.
Chat With
MaRIA