Posture Correction Market Outlook (2022 to 2032)

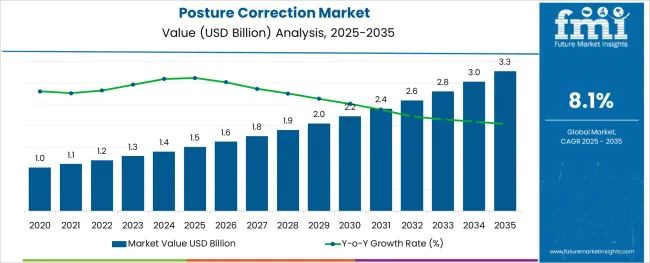
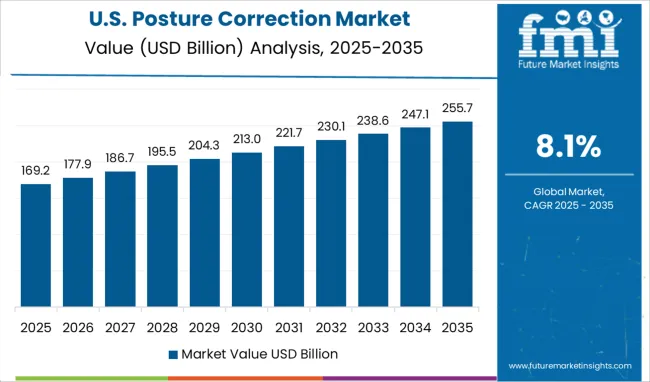
The posture correction market is likely to grow at a CAGR of 8.1% during the forecast period. The market is projected to be valued at US$ 1.1 Billion in 2022 and is likely to reach a market size of US$ 2.40 Billion by 2032, according to the FMI report. The influencing factor in the market are:

Rising back and spin disorders, growing hunchback, and poor body posture are increasing the global posture correction market size. In addition to this, rising healthcare infrastructure, the growing popularity of enhancing body posture, and rising back pain upsurge the demand for posture correction.

Increasing posture correction products such as posture correction belts and posture correction braces are propelling the market share. Overworking hours for sitting in a chair, poor sitting habits and unhealthy and sedentary lifestyles are flourishing the posture correction market growth.

The increasing aging population, adopting natural treatments, and growing disposable income is mushrooming the adoption of posture correction. The government initiatives to raise awareness related to fitness, innovation of products, and several health problems are advancing the posture correction market growth.

Some factors that constraint the posture correction market growth are:

  • Using posture corrector devices in the wrong way and growing spin fracture cases for the same are likely to limit the posture correction market growth.
  • The high cost of posture supporters and posture correction products constrain the market growth during the forecast period.

Don't pay for what you don't need

Customize your report by selecting specific countries or regions and save 30%!

Apart from the constraint factor, the posture correction market is growing with the following trends at play

The rising posture correction exercises and growing awareness-related health among millennials are positively increasing the posture correction market trends.

Nowadays, the growing craze of posture correction yoga among every age group of people is growing in the market during the forecast period. In addition, rising online yoga classes on various platforms and growing awareness on several campaigns and through news channels are growing the adoption of posture correction exercises.

Nowadays, the rising adoption of kinesiology tape and posture correction sticks among adults is flourishing the posture correction market growth. For instance, in 2019, according to NSC, nearly 3.3 million sports injuries occurred, including swimming, riding cycles, and playing football, among others.

In addition, growing awareness related to sports injuries is likely to increase the demand for posture correction. Moreover, in 2021, Mueller Sports Medicine developed its new product, adjustable posture corrector, for work-from-home people and sports athletes.

Report Attribute Details
Posture Correction Market Value (2022) US$ 1.1 Billion
Posture Correction Market Anticipated Value (2032) US$ 2.40 Billion
Posture Correction Market Projected Growth Rate (2022 to 2032) 8.1%

Category-wise Insights

By Product Segment, Which Category Dominates the Market for Posture Correction?

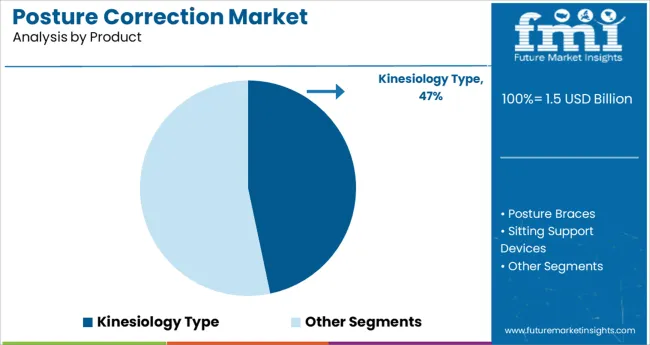
Based on product segment, the global posture correction market is categorized into sitting support devices, tapes, and kinesiology tapes. The kinesiology tape is likely to dominate the market by capturing the highest CAGR during the forecast period. This tape helps to reduce sports injuries and improve the flow of blood, thus increasing the demand for kinesiology tape during the forecast period. Applying this tape on the knee, joint space, or other joints is likely to cure the injury fast.

In addition, rising sports activities are anticipated to grow the kinesiology tape market size during the forecast period. Moreover, rising posture corrector devices are growing concerns related to sports ailments during the forecast period. However, the kinesiology tape category is likely to expand the global posture correction market share during the forecast period.

By Distribution Channel, Which Category is Leading the Market for Posture Correction?

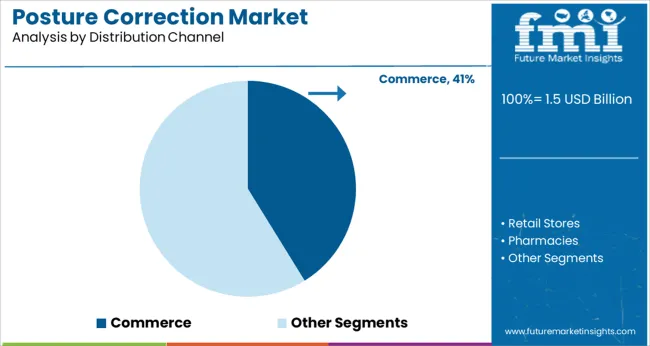
Based on distribution channels, the posture correction market is categorized into pharmacies, e-commerce, and retail stores. The pharmacies category is likely to lead the global posture correction market share by securing the highest market share during the forecast period. In addition, more than 50% of the share is calculated for the pharmacies during the forecast period due to growing unique requirements and growing health-related circumstances.

Moreover, the availability of medicines and the increasing number of pharmacies boost the pharmacy sector during the forecast period. Further, providing excellent services at affordable costs and large-scale healthcare is likely to increase the share in the market during the forecast period.

On the other hand, the e-commerce category is likely to be the fastest-growing category in the posture correction market during the forecast period. The online availability of products and home delivery services by market providers is surging the e-commerce sector during the forecast period. On the other hand, the rising popularity of smartphones and increasing online shopping propels the e-commerce industry. Due to the minimal cost of products, while applying promo codes and other festive discounts, the consumers are showing demand for the e-commerce platform. The quick services and return policies build trust among the consumers, thereby increasing market expansion.
Sudip Saha
Sudip Saha

Principal Consultant

Talk to Analyst

Find your sweet spots for generating winning opportunities in this market.

Regional Insights

USA Posture Correction Market Dominates the Global Market by Rising Spin Disorders

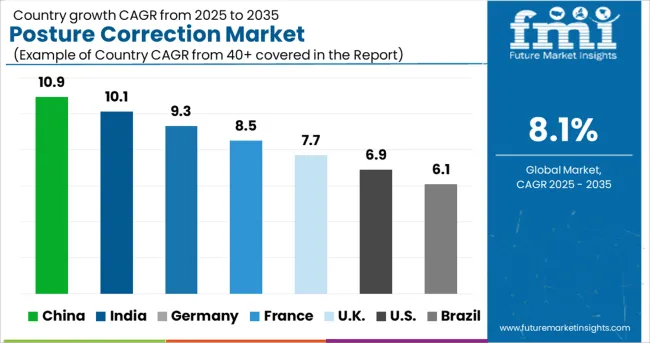
North America dominates the global posture correction market size by securing nearly 48% of the share during the forecast period. The USA is the leading nation in the region rising the global market with a growing number of key players and rising spin disorder and back pain issues during the forecast period. Apart from the USA, Canada is also contributing a significant share in the region during the forecast period. In 2021, according to Branko PRPA, MD Spine Surgery, lower back pain, and spin disorders issues affected nearly 30% of the USA population.

United Kingdom Posture Correction Market Rising by Growing Healthcare Sector

Europe is likely to secure the second position in the global posture correction market share during the forecast period. The United Kingdom holds the maximum share in the region due to the rising healthcare sector, growing aging population, and increasing disposable income during the forecast period. Moreover, the growing adoption of posture correction products by patients to recover from joint issues, back pain, and other joints are likely to boost the United Kingdom posture correction market. In 2020, Back Embrace announced that their new launch products are available on Amazon to expand the market in the United Kingdom.

Asia Pacific Posture Correction Market Flourishing by Adopting Posture Correction Products

The Asia Pacific is the fastest-growing region in the global posture correction market, capturing the maximum share during the forecast period. The Korean and Japanese markets are likely to gain the maximum share in the region. The relevant information about the countries is as follows:

Korea's Posture Correction Market is contributing a high share in the region during the foreseen time. This is due to the rising number of posture correction products and growing healthcare services in Korea. The growing concentration on fitness is flourishing the Korean posture correction market share. In addition, growing sports activities and other training increase the adoption of posture correction in Korea.

Japan's Posture Correction Market is driven by rising sedentary lifestyles and an increasing elderly population in the region during the forecast period. Growing economies and rising pharmacies have increased the demand for posture correction in recent years in Japan. As per WHO, Japan holds a respective share in the Asian countries, and this is likely to surge by 2040 for the posture correction market.

Start-up Ecosystem

How are the Start-up Companies Innovating Products that Add Value in the Global Market for Posture Correction?

Start-up companies are like a blessing for the global market. These companies are coming up with innovative skills and unique product launches to upsurge the market size during the forecast period. The posture correction start-up companies are developing the best bunion correctors to improve spin and body posture while charging low costs for the devices. Moreover, with the help of devices such as posture correction belts and posture correction sticks, anyone can make movements to stretch weak muscles easily.

In addition, the posture correction exercises offer key benefits, and they can be done by using different posture correction products. However, due to rising innovation and advanced technology, the trainers are likely to adopt these devices that are recommended by doctors and healthcare professionals. The newly launched wearable device for back pain, “Strack,” is a comfortable product. With the help of its vibration mode, it fixes your bad posture in 30 days. Moreover, start-up companies are focusing on the patient's needs and trying to solve the problem with their excellent skills during the forecast period.
Get the data you need at a Fraction of the cost

Personalize your report by choosing insights you need
and save 40%!

Competitive Landscape

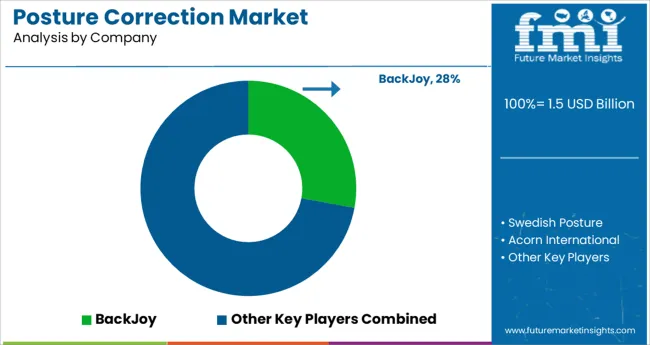
The market is consolidated by the number of key players present in the global posture correction market. These key vendors are adopting various marketing strategies to acquire the lion’s share of the market. Some of the most commonly used marketing methodologies are acquisitions, product launches, mergers, partnerships, acquisitions, collaborations, agreements, and global expansion, among others.

Recent Developments in the Posture Correction Market are:

  • In 2022, as per a report by Mercy Health, around 3 million people will be affected per year with kyphosis, which is a common condition among old-age women.
  • In May 2022, Hempvana launched its new product, “Straight 8,” which provides a comfortable and simple approach to bad posture. It is a uniquely designed device that is attached to the neck, lower back, shoulder, and middle back to strengthen the muscles and result in a good posture.
  • In Dec 2021, Indiegogo launched its new product CZUR Mirror which is a posture corrector device with an attached true smart AI system.

Some of the prominent key players in the market are

  • Upright
  • Swedish Posture
  • Acorn International
  • Aspen Medical Products LLC
  • BackJoy
  • Evoke Pro
  • Super Ortho
  • Comfy Brace
  • Ottobock
  • ITA-Med Co.

Key Segments in the Posture Correction

By Product:

  • Kinesiology Type
  • Posture Braces
  • Sitting Support Devices

Distribution Channel:

  • Commerce
  • Retail Stores
  • Pharmacies

By End Users:

  • Kids
  • Adults
  • Geriatric

By Region:

  • North America
  • Europe
  • Latin America
  • Asia-Pacific
  • Middle East and Africa(MEA)

Frequently Asked Questions

What is the Growth Outlook for the Posture Correction Market?

The growth outlook for the posture correction market is predicted to advance at a CAGR of 8.1% from 2022 to 2032.

Which Region Leads the Posture Correction Market?

North America is anticipated to lead the posture correction market during the forecast period.

How much Growth Potential does Posture Correction Market hold?

The posture correction market is likely to hold a valuation of US$ 2.40 Billion by 2032.

Table of Content

1. Executive Summary | Posture Correction Market

    1.1. Global Market Outlook

    1.2. Demand-side Trends

    1.3. Supply-side Trends

    1.4. Technology Roadmap Analysis

    1.5. Analysis and Recommendations

2. Market Overview

    2.1. Market Coverage / Taxonomy

    2.2. Market Definition / Scope / Limitations

3. Market Background

    3.1. Market Dynamics

        3.1.1. Drivers

        3.1.2. Restraints

        3.1.3. Opportunity

        3.1.4. Trends

    3.2. Scenario Forecast

        3.2.1. Demand in Optimistic Scenario

        3.2.2. Demand in Likely Scenario

        3.2.3. Demand in Conservative Scenario

    3.3. Opportunity Map Analysis

    3.4. Investment Feasibility Matrix

    3.5. PESTLE and Porter’s Analysis

    3.6. Regulatory Landscape

        3.6.1. By Key Regions

        3.6.2. By Key Countries

    3.7. Regional Parent Market Outlook

4. Global Market Analysis 2017 to 2021 and Forecast, 2022 to 2032

    4.1. Historical Market Size Value (US$ Million) Analysis, 2017 to 2021

    4.2. Current and Future Market Size Value (US$ Million) Projections, 2022 to 2032

        4.2.1. Y-o-Y Growth Trend Analysis

        4.2.2. Absolute $ Opportunity Analysis

5. Global Market Analysis 2017 to 2021 and Forecast 2022 to 2032, By Product

    5.1. Introduction / Key Findings

    5.2. Historical Market Size Value (US$ Million) Analysis By Product, 2017 to 2021

    5.3. Current and Future Market Size Value (US$ Million) Analysis and Forecast By Product, 2022 to 2032

        5.3.1. Sitting Support Devices

        5.3.2. Kinesiology Tape

        5.3.3. Posture Braces

        5.3.4. Others

    5.4. Y-o-Y Growth Trend Analysis By Product, 2017 to 2021

    5.5. Absolute $ Opportunity Analysis By Product, 2022 to 2032

6. Global Market Analysis 2017 to 2021 and Forecast 2022 to 2032, By Distribution Channel

    6.1. Introduction / Key Findings

    6.2. Historical Market Size Value (US$ Million) Analysis By Distribution Channel, 2017 to 2021

    6.3. Current and Future Market Size Value (US$ Million) Analysis and Forecast By Distribution Channel, 2022 to 2032

        6.3.1. Pharmacies & Retail Stores

        6.3.2. E-Commerce

    6.4. Y-o-Y Growth Trend Analysis By Distribution Channel, 2017 to 2021

    6.5. Absolute $ Opportunity Analysis By Distribution Channel, 2022 to 2032

7. Global Market Analysis 2017 to 2021 and Forecast 2022 to 2032, By End-User

    7.1. Introduction / Key Findings

    7.2. Historical Market Size Value (US$ Million) Analysis By End-User, 2017 to 2021

    7.3. Current and Future Market Size Value (US$ Million) Analysis and Forecast By End-User, 2022 to 2032

        7.3.1. Kids

        7.3.2. Adults

        7.3.3. Geriatric

    7.4. Y-o-Y Growth Trend Analysis By End-User, 2017 to 2021

    7.5. Absolute $ Opportunity Analysis By End-User, 2022 to 2032

8. Global Market Analysis 2017 to 2021 and Forecast 2022 to 2032, By Region

    8.1. Introduction

    8.2. Historical Market Size Value (US$ Million) Analysis By Region, 2017 to 2021

    8.3. Current Market Size Value (US$ Million) Analysis and Forecast By Region, 2022 to 2032

        8.3.1. North America

        8.3.2. Latin America

        8.3.3. Europe

        8.3.4. South Asia

        8.3.5. East Asia

        8.3.6. Oceania

        8.3.7. Middle East and Africa(MEA)

    8.4. Market Attractiveness Analysis By Region

9. North America Market Analysis 2017 to 2021 and Forecast 2022 to 2032, By Country

    9.1. Historical Market Size Value (US$ Million) Trend Analysis By Market Taxonomy, 2017 to 2021

    9.2. Market Size Value (US$ Million) Forecast By Market Taxonomy, 2022 to 2032

        9.2.1. By Country

            9.2.1.1. USA

            9.2.1.2. Canada

        9.2.2. By Product

        9.2.3. By Distribution Channel

        9.2.4. By End-User

    9.3. Market Attractiveness Analysis

        9.3.1. By Country

        9.3.2. By Product

        9.3.3. By Distribution Channel

        9.3.4. By End-User

    9.4. Key Takeaways

10. Latin America Market Analysis 2017 to 2021 and Forecast 2022 to 2032, By Country

    10.1. Historical Market Size Value (US$ Million) Trend Analysis By Market Taxonomy, 2017 to 2021

    10.2. Market Size Value (US$ Million) Forecast By Market Taxonomy, 2022 to 2032

        10.2.1. By Country

            10.2.1.1. Brazil

            10.2.1.2. Mexico

            10.2.1.3. Rest of Latin America

        10.2.2. By Product

        10.2.3. By Distribution Channel

        10.2.4. By End-User

    10.3. Market Attractiveness Analysis

        10.3.1. By Country

        10.3.2. By Product

        10.3.3. By Distribution Channel

        10.3.4. By End-User

    10.4. Key Takeaways

11. Europe Market Analysis 2017 to 2021 and Forecast 2022 to 2032, By Country

    11.1. Historical Market Size Value (US$ Million) Trend Analysis By Market Taxonomy, 2017 to 2021

    11.2. Market Size Value (US$ Million) Forecast By Market Taxonomy, 2022 to 2032

        11.2.1. By Country

            11.2.1.1. Germany

            11.2.1.2. United Kingdom

            11.2.1.3. France

            11.2.1.4. Spain

            11.2.1.5. Italy

            11.2.1.6. Rest of Europe

        11.2.2. By Product

        11.2.3. By Distribution Channel

        11.2.4. By End-User

    11.3. Market Attractiveness Analysis

        11.3.1. By Country

        11.3.2. By Product

        11.3.3. By Distribution Channel

        11.3.4. By End-User

    11.4. Key Takeaways

12. South Asia Market Analysis 2017 to 2021 and Forecast 2022 to 2032, By Country

    12.1. Historical Market Size Value (US$ Million) Trend Analysis By Market Taxonomy, 2017 to 2021

    12.2. Market Size Value (US$ Million) Forecast By Market Taxonomy, 2022 to 2032

        12.2.1. By Country

            12.2.1.1. India

            12.2.1.2. Malaysia

            12.2.1.3. Singapore

            12.2.1.4. Thailand

            12.2.1.5. Rest of South Asia

        12.2.2. By Product

        12.2.3. By Distribution Channel

        12.2.4. By End-User

    12.3. Market Attractiveness Analysis

        12.3.1. By Country

        12.3.2. By Product

        12.3.3. By Distribution Channel

        12.3.4. By End-User

    12.4. Key Takeaways

13. East Asia Market Analysis 2017 to 2021 and Forecast 2022 to 2032, By Country

    13.1. Historical Market Size Value (US$ Million) Trend Analysis By Market Taxonomy, 2017 to 2021

    13.2. Market Size Value (US$ Million) Forecast By Market Taxonomy, 2022 to 2032

        13.2.1. By Country

            13.2.1.1. China

            13.2.1.2. Japan

            13.2.1.3. South Korea

        13.2.2. By Product

        13.2.3. By Distribution Channel

        13.2.4. By End-User

    13.3. Market Attractiveness Analysis

        13.3.1. By Country

        13.3.2. By Product

        13.3.3. By Distribution Channel

        13.3.4. By End-User

    13.4. Key Takeaways

14. Oceania Market Analysis 2017 to 2021 and Forecast 2022 to 2032, By Country

    14.1. Historical Market Size Value (US$ Million) Trend Analysis By Market Taxonomy, 2017 to 2021

    14.2. Market Size Value (US$ Million) Forecast By Market Taxonomy, 2022 to 2032

        14.2.1. By Country

            14.2.1.1. Australia

            14.2.1.2. New Zealand

        14.2.2. By Product

        14.2.3. By Distribution Channel

        14.2.4. By End-User

    14.3. Market Attractiveness Analysis

        14.3.1. By Country

        14.3.2. By Product

        14.3.3. By Distribution Channel

        14.3.4. By End-User

    14.4. Key Takeaways

15. MEA Market Analysis 2017 to 2021 and Forecast 2022 to 2032, By Country

    15.1. Historical Market Size Value (US$ Million) Trend Analysis By Market Taxonomy, 2017 to 2021

    15.2. Market Size Value (US$ Million) Forecast By Market Taxonomy, 2022 to 2032

        15.2.1. By Country

            15.2.1.1. GCC Countries

            15.2.1.2. South Africa

            15.2.1.3. Israel

            15.2.1.4. Rest of Middle East and Africa(MEA)

        15.2.2. By Product

        15.2.3. By Distribution Channel

        15.2.4. By End-User

    15.3. Market Attractiveness Analysis

        15.3.1. By Country

        15.3.2. By Product

        15.3.3. By Distribution Channel

        15.3.4. By End-User

    15.4. Key Takeaways

16. Key Countries Market Analysis

    16.1. USA

        16.1.1. Pricing Analysis

        16.1.2. Market Share Analysis, 2021

            16.1.2.1. By Product

            16.1.2.2. By Distribution Channel

            16.1.2.3. By End-User

    16.2. Canada

        16.2.1. Pricing Analysis

        16.2.2. Market Share Analysis, 2021

            16.2.2.1. By Product

            16.2.2.2. By Distribution Channel

            16.2.2.3. By End-User

    16.3. Brazil

        16.3.1. Pricing Analysis

        16.3.2. Market Share Analysis, 2021

            16.3.2.1. By Product

            16.3.2.2. By Distribution Channel

            16.3.2.3. By End-User

    16.4. Mexico

        16.4.1. Pricing Analysis

        16.4.2. Market Share Analysis, 2021

            16.4.2.1. By Product

            16.4.2.2. By Distribution Channel

            16.4.2.3. By End-User

    16.5. Germany

        16.5.1. Pricing Analysis

        16.5.2. Market Share Analysis, 2021

            16.5.2.1. By Product

            16.5.2.2. By Distribution Channel

            16.5.2.3. By End-User

    16.6. United Kingdom

        16.6.1. Pricing Analysis

        16.6.2. Market Share Analysis, 2021

            16.6.2.1. By Product

            16.6.2.2. By Distribution Channel

            16.6.2.3. By End-User

    16.7. France

        16.7.1. Pricing Analysis

        16.7.2. Market Share Analysis, 2021

            16.7.2.1. By Product

            16.7.2.2. By Distribution Channel

            16.7.2.3. By End-User

    16.8. Spain

        16.8.1. Pricing Analysis

        16.8.2. Market Share Analysis, 2021

            16.8.2.1. By Product

            16.8.2.2. By Distribution Channel

            16.8.2.3. By End-User

    16.9. Italy

        16.9.1. Pricing Analysis

        16.9.2. Market Share Analysis, 2021

            16.9.2.1. By Product

            16.9.2.2. By Distribution Channel

            16.9.2.3. By End-User

    16.10. India

        16.10.1. Pricing Analysis

        16.10.2. Market Share Analysis, 2021

            16.10.2.1. By Product

            16.10.2.2. By Distribution Channel

            16.10.2.3. By End-User

    16.11. Malaysia

        16.11.1. Pricing Analysis

        16.11.2. Market Share Analysis, 2021

            16.11.2.1. By Product

            16.11.2.2. By Distribution Channel

            16.11.2.3. By End-User

    16.12. Singapore

        16.12.1. Pricing Analysis

        16.12.2. Market Share Analysis, 2021

            16.12.2.1. By Product

            16.12.2.2. By Distribution Channel

            16.12.2.3. By End-User

    16.13. Thailand

        16.13.1. Pricing Analysis

        16.13.2. Market Share Analysis, 2021

            16.13.2.1. By Product

            16.13.2.2. By Distribution Channel

            16.13.2.3. By End-User

    16.14. China

        16.14.1. Pricing Analysis

        16.14.2. Market Share Analysis, 2021

            16.14.2.1. By Product

            16.14.2.2. By Distribution Channel

            16.14.2.3. By End-User

    16.15. Japan

        16.15.1. Pricing Analysis

        16.15.2. Market Share Analysis, 2021

            16.15.2.1. By Product

            16.15.2.2. By Distribution Channel

            16.15.2.3. By End-User

    16.16. South Korea

        16.16.1. Pricing Analysis

        16.16.2. Market Share Analysis, 2021

            16.16.2.1. By Product

            16.16.2.2. By Distribution Channel

            16.16.2.3. By End-User

    16.17. Australia

        16.17.1. Pricing Analysis

        16.17.2. Market Share Analysis, 2021

            16.17.2.1. By Product

            16.17.2.2. By Distribution Channel

            16.17.2.3. By End-User

    16.18. New Zealand

        16.18.1. Pricing Analysis

        16.18.2. Market Share Analysis, 2021

            16.18.2.1. By Product

            16.18.2.2. By Distribution Channel

            16.18.2.3. By End-User

    16.19. GCC Countries

        16.19.1. Pricing Analysis

        16.19.2. Market Share Analysis, 2021

            16.19.2.1. By Product

            16.19.2.2. By Distribution Channel

            16.19.2.3. By End-User

    16.20. South Africa

        16.20.1. Pricing Analysis

        16.20.2. Market Share Analysis, 2021

            16.20.2.1. By Product

            16.20.2.2. By Distribution Channel

            16.20.2.3. By End-User

    16.21. Israel

        16.21.1. Pricing Analysis

        16.21.2. Market Share Analysis, 2021

            16.21.2.1. By Product

            16.21.2.2. By Distribution Channel

            16.21.2.3. By End-User

17. Market Structure Analysis

    17.1. Competition Dashboard

    17.2. Competition Benchmarking

    17.3. Market Share Analysis of Top Players

        17.3.1. By Regional

        17.3.2. By Product

        17.3.3. By Distribution Channel

        17.3.4. By End-User

18. Competition Analysis

    18.1. Competition Deep Dive

        18.1.1. BackJoy

            18.1.1.1. Overview

            18.1.1.2. Product Portfolio

            18.1.1.3. Profitability by Market Segments

            18.1.1.4. Sales Footprint

            18.1.1.5. Strategy Overview

                18.1.1.5.1. Marketing Strategy

        18.1.2. Swedish Posture

            18.1.2.1. Overview

            18.1.2.2. Product Portfolio

            18.1.2.3. Profitability by Market Segments

            18.1.2.4. Sales Footprint

            18.1.2.5. Strategy Overview

                18.1.2.5.1. Marketing Strategy

        18.1.3. Acorn International

            18.1.3.1. Overview

            18.1.3.2. Product Portfolio

            18.1.3.3. Profitability by Market Segments

            18.1.3.4. Sales Footprint

            18.1.3.5. Strategy Overview

                18.1.3.5.1. Marketing Strategy

        18.1.4. Upright

            18.1.4.1. Overview

            18.1.4.2. Product Portfolio

            18.1.4.3. Profitability by Market Segments

            18.1.4.4. Sales Footprint

            18.1.4.5. Strategy Overview

                18.1.4.5.1. Marketing Strategy

        18.1.5. Aspen Medical Products, LLC

            18.1.5.1. Overview

            18.1.5.2. Product Portfolio

            18.1.5.3. Profitability by Market Segments

            18.1.5.4. Sales Footprint

            18.1.5.5. Strategy Overview

                18.1.5.5.1. Marketing Strategy

        18.1.6. Evoke Pro

            18.1.6.1. Overview

            18.1.6.2. Product Portfolio

            18.1.6.3. Profitability by Market Segments

            18.1.6.4. Sales Footprint

            18.1.6.5. Strategy Overview

                18.1.6.5.1. Marketing Strategy

        18.1.7. Comfy Brace

            18.1.7.1. Overview

            18.1.7.2. Product Portfolio

            18.1.7.3. Profitability by Market Segments

            18.1.7.4. Sales Footprint

            18.1.7.5. Strategy Overview

                18.1.7.5.1. Marketing Strategy

        18.1.8. ITA-Med Co.

            18.1.8.1. Overview

            18.1.8.2. Product Portfolio

            18.1.8.3. Profitability by Market Segments

            18.1.8.4. Sales Footprint

            18.1.8.5. Strategy Overview

                18.1.8.5.1. Marketing Strategy

        18.1.9. Super Ortho

            18.1.9.1. Overview

            18.1.9.2. Product Portfolio

            18.1.9.3. Profitability by Market Segments

            18.1.9.4. Sales Footprint

            18.1.9.5. Strategy Overview

                18.1.9.5.1. Marketing Strategy

        18.1.10. Ottobock

            18.1.10.1. Overview

            18.1.10.2. Product Portfolio

            18.1.10.3. Profitability by Market Segments

            18.1.10.4. Sales Footprint

            18.1.10.5. Strategy Overview

                18.1.10.5.1. Marketing Strategy

19. Assumptions & Acronyms Used

20. Research Methodology

Recommendations

Healthcare

Anti-Osteoporosis Therapy and Fracture Healing Market

May 2023

REP-GB-1008

252 pages

Explore Consumer Product Insights

View Reports
Future Market Insights

Posture Correction Market

Schedule a Call