The Postal Automation Systems Market is estimated to be valued at USD 1111.5 million in 2025 and is projected to reach USD 2146.0 million by 2035, registering a compound annual growth rate (CAGR) of 6.8% over the forecast period.
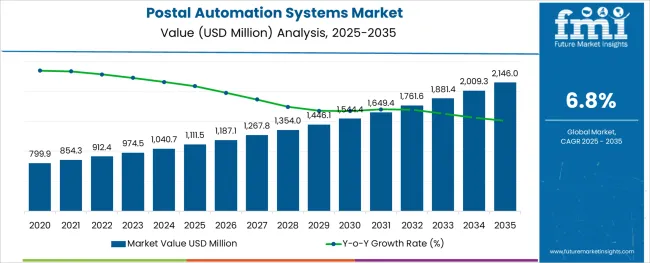
The postal automation systems market is expanding steadily due to rising demand for efficient mail processing, growing e commerce volumes, and the need to modernize national postal infrastructure. As global postal networks grapple with increasing parcel traffic and declining traditional mail volumes, automation technologies are being adopted to streamline operations, reduce manual errors, and improve sorting speeds.
Governments and logistics providers are investing in intelligent automation systems that can adapt to varying item sizes and formats, ensuring seamless handling of both letters and packages. Developments in optical character recognition, address validation, and integration with tracking systems are also enhancing overall accuracy and delivery efficiency.
The market outlook remains optimistic as postal operators aim to enhance service reliability, reduce operational costs, and meet rising consumer expectations around delivery speed and transparency.
The market is segmented by Technology, Component, and Application and region. By Technology, the market is divided into Culler Facer Canceller, Letter Sorter, Flat Sorter, Mixed Mail Sorter, Parcel Sorter, and Others. In terms of Component, the market is classified into Hardware, Software, and Services. Based on Application, the market is segmented into Commercial Postal and Government Postal. Regionally, the market is classified into North America, Latin America, Western Europe, Eastern Europe, Balkan & Baltic Countries, Russia & Belarus, Central Asia, East Asia, South Asia & Pacific, and the Middle East & Africa.
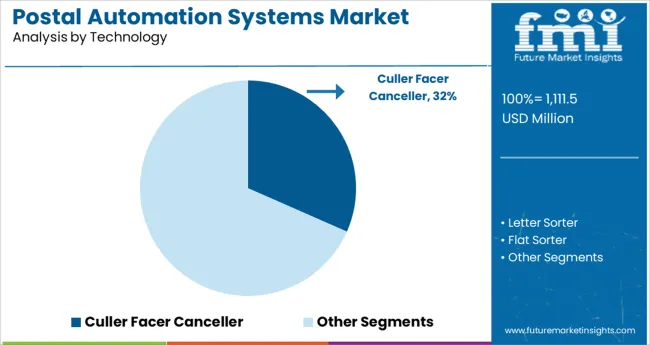
The culler facer canceller segment is projected to represent 31.60% of the total market revenue by 2025 within the technology category, positioning it as a key segment in postal automation. This growth is driven by the critical function of this technology in the initial stages of mail processing, where items are oriented, stamped, and prepared for sorting.
Its ability to handle high mail volumes with precision has made it an essential part of automated processing lines. Improvements in processing speed, machine vision, and ink jet cancellation systems have strengthened its reliability and effectiveness.
As postal operators seek to minimize delays and optimize throughput, the deployment of culler facer canceller systems has become a fundamental requirement, reinforcing its leading role in this category.
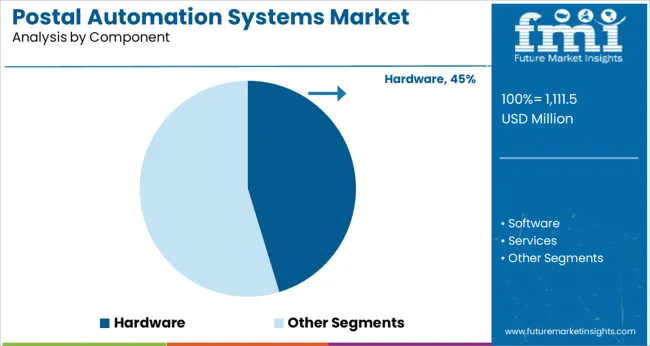
The hardware segment is expected to contribute 45.30% of total market revenue by 2025 within the component category, making it the dominant segment. This leadership is attributed to the continued demand for high speed sorting machines, address readers, barcode scanners, and conveyor systems required to support end to end automation.
Postal and courier organizations are investing in robust, scalable hardware infrastructure to meet the demands of peak mail and parcel volumes while ensuring accuracy and durability in high throughput environments. Integration of smart sensors, real time monitoring modules, and advanced robotics has further elevated the performance of hardware solutions.
With automation being central to modern postal operations, the hardware component remains indispensable, solidifying its dominance in the postal automation systems market.
The postal automation system hardware segment is anticipated to account for a sizable percentage of the overall market. All forms of automation in any given end-user sector involve a network of interrelated hardware nodes and informational answers.
Therefore, as the requirement for automation grows, the postal and parcel business is expected to require a hardware component.
Market growth is anticipated to be led by an increase in the deployment of new systems as part of capacity expansion and enhancements to the existing system as part of automation in the postal sector.
In addition, the proliferation of online shopping has resulted in a rise in the number of packages shipped all over the world. Additionally, international e-commerce has contributed to the expansion of parcel shipping.
Owing to this, improving the postal industry's supply chain necessitates an automated and networked hardware infrastructure.
These systems, however, require regular maintenance as well as software and hardware updates. Both postal service providers and manufacturers of the automation technology sign pricey maintenance and support agreements.
Therefore, the service sector is anticipated to experience the fastest market expansion over the forecast period.
In 2024, hardware accounted for over 66% of total income. This was mostly due to improvements in processing power, sensor accuracy, identification accuracy, and scanner accuracy, as well as the need for new systems to augment the aging infrastructure.
Over the projection period, the market segment is expected to keep expanding rapidly.
Key providers of postal automation equipment are investing in Research and Development (R&D) and establishing production facilities in other countries to increase their market share.
In August 2024, for example, Vanderlande Industries Inc., a logistics and material handling firm, announced plans to expand its operations campus in Marietta and Georgia. In order to keep up with the rising demand for its products, the company has spent around USD 59 million.
More and more transactions are being carried out digitally as more consumers use e-commerce websites. With the daily volume of packages increasing, postal services have turned to automation to better fulfill customers' needs.
The increasing popularity of online shopping has contributed to the widespread implementation of postal automation equipment.
In order to streamline the mail processing chain, boost service quality, and cut down on fixed costs like labor, the major players in the e-commerce industry are adopting automated postal delivery systems.
To keep up with the rising demand, the industry's top providers of postal automation equipment are concentrating on technological advancements. For instance, Siemens Logistics GmbH unveiled the VarioBelt TilterPlus, a belt conveyor with a revolutionary tilting device, in June 2024.
This conveyor is intended to facilitate the expedited movement of luggage through airports. It provides benefits in three directions, resulting in less machinery being needed for baggage handling systems and less waste being produced.
Having postal services automated helps lessen reliance on human labor and associated costs. The rising cost of labor can be traced back to several factors, including falling productivity, high turnover rates, a skills gap, and government regulation of the traditional postal systems market.
The automation of postal systems has helped businesses save money on labor while increasing efficiency and accuracy. As a result, growth in the market is forecast to be substantial over the next few years.
While the initial outlay to automate the postal service is substantial, the automation itself necessitates the setup of a sizable amount of hardware and software.
To add to the system's variable costs, it needs regular upkeep after installation. Sensor malfunctions have a domino effect on the entire system, and software problems slow down the sorting process and disrupt operations.
In 2024, over 43% of the global postal automation systems market was in North America. The presence of major market players in the area and the rising popularity of cutting-edge postal technologies are two major reasons for the expansion.
Increases in labor expenses and shortages of available workers are also pushing businesses toward automation. Increasing demand for postal automation services from the public sector, the business financial services industry, and other sectors is driving the development of the market in the region.
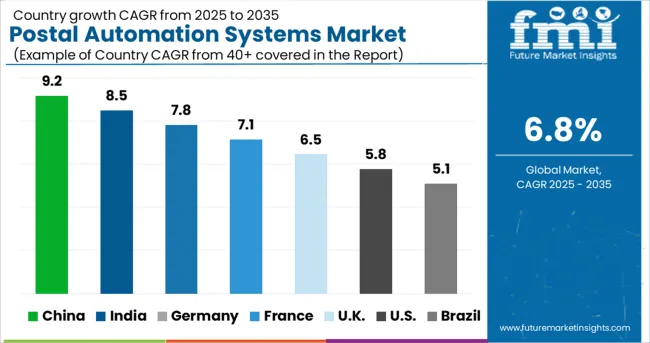
In Europe, the demand for postal automation systems is expected to expand at a CAGR of 6.8 percent during the period of the forecast.
When looking at the European postal automation systems market, in 2024, Germany was far and away the leader, with a market value of USD 2146 million by 2035. Forecasts place the United Kingdom market's rate of growth at 5.9% CAGR for the years in question. The French market is expected to grow at a CAGR of 7.5% over the same time frame.
Germany has one of the largest e-commerce markets in Europe. In comparison to Europe, the United States has more online shoppers, a larger share of the population that uses the internet, and higher annual spending overall. In 2024, total sales topped USD 127.5 billion, up 24% from the previous year.
From an estimated 1040.7 million in 2024, Germany's online population is expected to reach 1111.5 million by 2025. German consumers are known for their high standards and aversion to taking chances when making purchases. The proliferation of smartphones is one factor propelling the postal automation systems market forward.
An estimated 10% CAGR growth in Asia Pacific’s sales of postal automation systems is predicted during the projection period.
The rapid development of the online marketplace in nations like Japan, China, and India has stimulated the growth of the related e-commerce logistics business, which in turn has necessitated the development of cutting-edge logistics technology.
Additionally, substantial expansion potential exists for the demand for postal automation systems in the Asia Pacific region due to rising demand from the BFSI sector.
In 2024, China was the most lucrative country in the Asia Pacific postal automation systems market, with a total market value of USD 2146 million by 2035. To that end, the Japanese market is expected to expand at a CAGR of 7% during the projection time frame. Additionally, the Indian market is expected to grow at a CAGR of 8.3% over the forecast time frame.
Wage earners make up most of India's consumer class. More breadwinners mean more disposable money, which means the family can afford to buy whatever it wants. There has been a shift away from selling products and toward selling services in retail.
India's consumer market is booming thanks to the country's favorable demographics, big working-age population, rising income levels, increasing urbanization, and rising brand orientation. Thus, these elements are expected to boost the growth of the regional postal automation systems market over the forecast period.
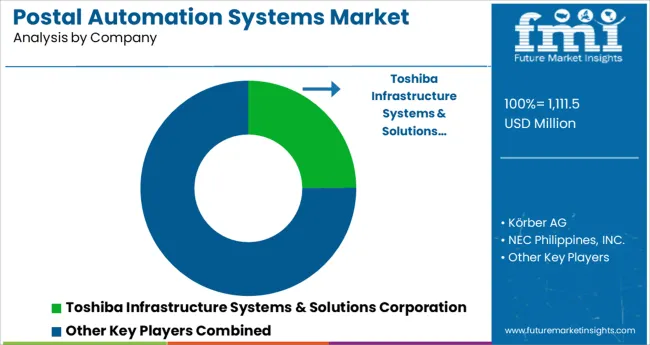
As the postal business undergoes several technological changes, the demand for postal automation systems worldwide is trending toward fragmentation. The market is dynamic; therefore businesses are always coming up with new ways to stay ahead of the competition through tactics like innovation and expansion.
Major recent developments and strategies adopted by the market players are:
Product Launches
In order to automate its newly formed 12,034 square meters international categorization center in Sordio, a suburb of Milan, Italy, the global logistics system has opted for physical handling specialist MHS worldwide.
The latest version of Vanderlande's scalable solutions was released in September of 2020. With the goal of reducing the total cost of ownership, DIRECTSORT provides a unified, future-proof, and easy-to-understand description of what kinds of packages need to be unloaded from trailers, forequarters, and load carriers (TCO).
Mergers and Acquisitions
TMEIC Corporation Americas is pleased to share the news that in April 2025, it acquired the Ports and Terminals Division from Orbita ingeniera, S.L. With the acquisition of TMEIC, it will be able to provide new and existing customers in the ports and depots with access to superior and tried-and-true OCR competencies, as well as a wider range of mechanization choices.
Along with TMEIC's financial backing, operational support, and market impact, the present Ports and Terminals Division will be able to afford further growth and development opportunities.
In order to streamline operations at airports and airlines, Siemens Logistics proposed a suite of cutting-edge software solutions in October 2020. For predictively maintaining baggage treatment systems, this is Service 4.0. Predictions are created using aggregated data, and preventative measures are implemented to boost system dependability and reduce the frequency of unscheduled outages.
Partnerships and Collaborations
To create and install motorized grade and entirely electronic in private and public organizations in North America, beep Inc., and Mobile Eye have consciously partnered with Bentelers EV schemes.
Some of the prominent players in the Postal Automation Systems market are:
The global postal automation systems market is estimated to be valued at USD 1,111.5 million in 2025.
It is projected to reach USD 2,146.0 million by 2035.
The market is expected to grow at a 6.8% CAGR between 2025 and 2035.
The key product types are culler facer canceller, letter sorter, flat sorter, mixed mail sorter, parcel sorter and others.
hardware segment is expected to dominate with a 45.3% industry share in 2025.


Our Research Products

The "Full Research Suite" delivers actionable market intel, deep dives on markets or technologies, so clients act faster, cut risk, and unlock growth.

The Leaderboard benchmarks and ranks top vendors, classifying them as Established Leaders, Leading Challengers, or Disruptors & Challengers.

Locates where complements amplify value and substitutes erode it, forecasting net impact by horizon

We deliver granular, decision-grade intel: market sizing, 5-year forecasts, pricing, adoption, usage, revenue, and operational KPIs—plus competitor tracking, regulation, and value chains—across 60 countries broadly.

Spot the shifts before they hit your P&L. We track inflection points, adoption curves, pricing moves, and ecosystem plays to show where demand is heading, why it is changing, and what to do next across high-growth markets and disruptive tech

Real-time reads of user behavior. We track shifting priorities, perceptions of today’s and next-gen services, and provider experience, then pace how fast tech moves from trial to adoption, blending buyer, consumer, and channel inputs with social signals (#WhySwitch, #UX).

Partner with our analyst team to build a custom report designed around your business priorities. From analysing market trends to assessing competitors or crafting bespoke datasets, we tailor insights to your needs.
Supplier Intelligence
Discovery & Profiling
Capacity & Footprint
Performance & Risk
Compliance & Governance
Commercial Readiness
Who Supplies Whom
Scorecards & Shortlists
Playbooks & Docs
Category Intelligence
Definition & Scope
Demand & Use Cases
Cost Drivers
Market Structure
Supply Chain Map
Trade & Policy
Operating Norms
Deliverables
Buyer Intelligence
Account Basics
Spend & Scope
Procurement Model
Vendor Requirements
Terms & Policies
Entry Strategy
Pain Points & Triggers
Outputs
Pricing Analysis
Benchmarks
Trends
Should-Cost
Indexation
Landed Cost
Commercial Terms
Deliverables
Brand Analysis
Positioning & Value Prop
Share & Presence
Customer Evidence
Go-to-Market
Digital & Reputation
Compliance & Trust
KPIs & Gaps
Outputs
Full Research Suite comprises of:
Market outlook & trends analysis
Interviews & case studies
Strategic recommendations
Vendor profiles & capabilities analysis
5-year forecasts
8 regions and 60+ country-level data splits
Market segment data splits
12 months of continuous data updates
DELIVERED AS:
PDF EXCEL ONLINE
Postal Tubes Market
Automation Testing Market Size and Share Forecast Outlook 2025 to 2035
Automation COE Market Insights by Organization Size, Service Type, End User Verticals, and Region through 2035
Lab Automation Market Growth – Size, Trends & Forecast 2025 to 2035
Home Automation Sensors Market Size and Share Forecast Outlook 2025 to 2035
Home Automation Market Analysis by Product, Application, Networking Technology, and Region Through 2035
Form Automation Software Market – Digitizing Workflows
Hyperautomation Market
Water Automation & Instrumentation Market Trends & Forecast by Process Stage, Automation Technology, Instrumentation, End-User and Region through 2035
Retail Automation Market Size and Share Forecast Outlook 2025 to 2035
Milking Automation Market Size and Share Forecast Outlook 2025 to 2035
Process Automation and Instrumentation Market Size and Share Forecast Outlook 2025 to 2035
Network Automation Market - AI & Cloud Connectivity 2025 to 2035
Factory Automation And Industrial Controls Market Growth - Trends & Forecast 2025 to 2035
Machine Automation Controller Market Growth – Trends & Forecast 2025 to 2035
Medical Automation Market Analysis - Innovations & Forecast 2025 to 2035
Evaluating Process Automation and Instrumentation Market Share & Provider Insights
Content Automation AI Tools Market
Building Automation System Market Size and Share Forecast Outlook 2025 to 2035
Building Automation System Industry Analysis in Korea Analysis - Size, Share, and Forecast Outlook 2025 to 2035

Thank you!
You will receive an email from our Business Development Manager. Please be sure to check your SPAM/JUNK folder too.
Chat With
MaRIA