The polymeric sand market is estimated to be valued at USD 135.9 billion in 2025 and is projected to reach USD 267.5 billion by 2035, registering a compound annual growth rate (CAGR) of 7.0% over the forecast period. The market is expected to add an absolute dollar opportunity of USD 131.7 billion during this period. This reflects a 1.97 times growth at a CAGR of 7.0%. The market evolution is expected to be shaped by increasing adoption of polymeric sand in residential and commercial landscaping, rising demand for durable pavement solutions, and the growing popularity of outdoor living spaces such as patios, walkways, and driveways.
By 2030, the market is likely to reach USD 191.0 billion, accounting for nearly USD 55.1 billion in incremental value over the first half of the decade. The remaining USD 76.5 billion is expected to be realized during the second half, indicating a stronger back-loaded growth trajectory. This acceleration is expected to be driven by rapid infrastructure development, expansion of the construction sector in Asia-Pacific, and rising demand for durable, low-maintenance paving solutions in both residential and commercial applications.
Companies such as Techniseal, SEK-Surebond, and Alliance Designer Products Inc. are strengthening their competitive positions through continuous product innovation, advanced binding technologies, and environmentally safe formulations. The market’s performance will continue to be anchored by strict regulatory compliance, durability standards, and the shift toward sustainable construction practices across global supply chains.
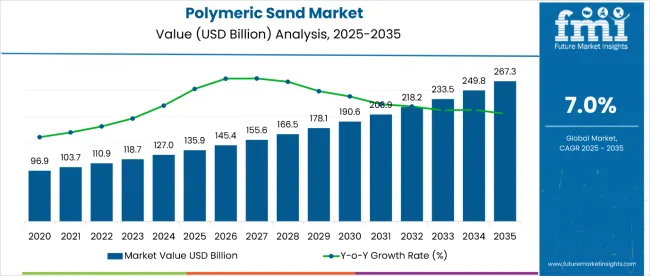
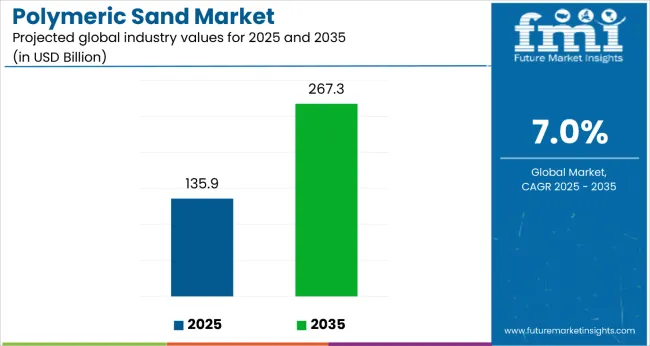
| Metric | Value |
|---|---|
| Estimated Size (2025E) | USD 135.9 billion |
| Projected Value (2035F) | USD 267.5 billion |
| CAGR (2025 to 2035) | 7.0% |
The market holds a notable and growing share across multiple segments. Within the paving materials sector, it holds 6.5% market share, driven by its durability and resistance to erosion. In the landscaping products market, polymeric sand accounts for about 8.2%, reflecting its widespread use in residential and commercial landscaping projects. Within the jointing materials category, it commands a substantial 65.7% share, underscoring its dominance in stabilizing paver joints. These figures highlight polymeric sand's integral role in various construction and landscaping applications.
The market is being driven by increasing demand for durable and low-maintenance landscaping solutions. Advancements in polymer technology have led to enhanced product formulations, offering improved resistance to weathering and erosion. Sustainability trends are influencing consumer preferences, with a shift towards eco-friendly materials. The expansion of urban infrastructure and residential developments further fuels market demand, positioning polymeric sand as a preferred choice for modern hardscaping projects.
The polymeric sand market is growing strongly due to several key factors. One major driver is the rising demand for durable, low-maintenance, and visually appealing outdoor surfaces in residential and commercial construction. Polymeric sand is favored for its superior joint stability, resistance to weeds and erosion, and long-lasting performance. This makes it ideal for patios, walkways, driveways, and hardscaping applications, aligning with the global trend of enhancing outdoor living spaces.
Expansion in urban infrastructure and the construction sector, particularly in North America, Europe, and Asia-Pacific, is further boosting adoption of polymeric sand. Government initiatives promoting sustainable construction and eco-friendly materials are also supporting market growth.
Advancements in polymer technology have improved formulations, enhancing weather resistance and durability. Sustainability trends are encouraging the use of eco-friendly materials. Manufacturers are innovating with premium products and installation solutions, while partnerships with contractors and retail channels broaden market reach. Despite challenges such as raw material costs and specialized installation, rising landscaping projects continue to propel strong market growth.
The market is segmented by product type, colour, application, end use, and region. By product type, the market is bifurcated into polymeric sand and polymeric dust. Based on colour, the market is segmented into beige, gray, and black & others. In terms of application, the market is classified into footpaths, patios, pool decks, parking spaces, and pavements & auxiliary spaces. By end use, the market is categorized into residential, commercial, and infrastructural sectors. Regionally, the market is divided into North America, Latin America, Western Europe, Eastern Europe, South Asia and Pacific, East Asia, and Middle East & Africa.
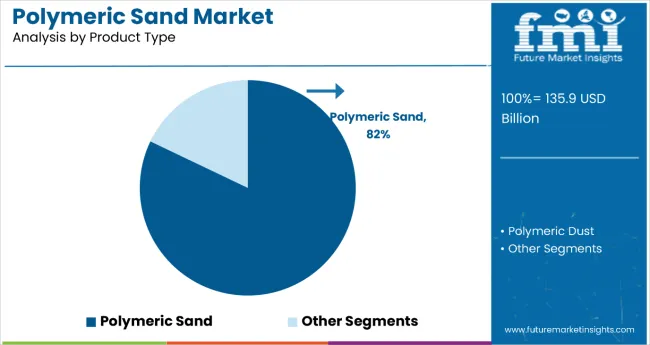
Polymeric sand is expected to dominate the product type segment in 2025, capturing an estimated 82% market share. Its widespread use in patios, footpaths, pool decks, driveways, and other outdoor applications is attributed to key advantages such as superior joint stability, prevention of weed growth, and long-lasting durability. The product has emerged as a preferred choice in hardscaping projects, offering a versatile solution that caters effectively to residential, commercial, and infrastructural requirements.
The material is particularly popular in large-scale landscaping projects due to its ease of application and minimal maintenance needs. Contractors and developers increasingly favor polymeric sand for its cost-efficiency, as it reduces the need for frequent joint replacements. Furthermore, its ability to provide stronger interlocking and prevent erosion enhances the overall lifespan of paved structures, making it a reliable and sustainable choice for long-term projects.
Innovations in formulation, including improved weather resistance and enhanced bonding properties, are further supporting the adoption of polymeric sand worldwide. With the growing demand for durable and aesthetically appealing outdoor spaces, polymeric sand continues to strengthen its market dominance. Its role in sustainable urban development and modern construction practices positions it as a cornerstone product type driving growth across the global polymeric sand market.
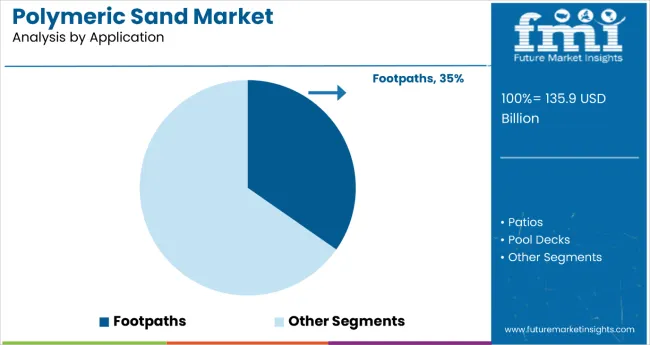
Patios are poised to lead the application segment in 2025, accounting for an estimated 35% market share. With outdoor spaces increasingly designed to combine functionality and aesthetic appeal, polymeric sand has become the preferred jointing material for patios. Its ability to prevent weed growth, resist erosion, and maintain clean, stable surfaces aligns with the growing demand for stylish, durable, and low-maintenance outdoor living areas.
The segment benefits greatly from polymeric sand’s ease of application and its long-lasting performance, which significantly reduces the need for frequent maintenance and costly replacements. As homeowners and commercial property developers prioritize durable solutions for outdoor installations, patios stand out as a prominent application area. The rising popularity of residential landscaping and the expansion of commercial spaces with dedicated outdoor areas are further reinforcing this trend.
Contractors and homeowners alike are driving consistent demand for polymeric sand in patio installations, making this application a central contributor to overall market growth. Supported by ongoing urbanization and the boom in outdoor living concepts, the patio segment is expected to maintain its leadership, shaping demand patterns and sustaining market expansion well into the forecast period
From 2025 to 2035, increasing demand for durable, low-maintenance, and aesthetically pleasing outdoor surfaces is driving significant growth in the polymeric sand market. Rising investments in residential, commercial, and infrastructural landscaping projects, particularly in North America, Europe, and Asia-Pacific, are encouraging contractors and homeowners to adopt polymeric sand as the preferred jointing material. Its superior resistance to weed growth, erosion, and harsh weather conditions makes it an ideal choice for footpaths, patios, pool decks, and other hardscaping applications.
Rising Landscaping and Construction Demand Drives Polymeric Sand Adoption
The landscaping and construction sectors are the largest consumers of polymeric sand, leveraging its superior joint stability, resistance to weed growth, and long-lasting durability. With the expansion of residential and commercial outdoor spaces such as patios, walkways, driveways, and pool decks, demand for polymeric sand is growing steadily. It is estimated to account for a significant share of hardscaping projects worldwide, providing cost-efficient, low-maintenance, and visually appealing solutions. Increasing investments in urban infrastructure and the popularity of eco-friendly paving materials further strengthen growth prospects.
Environmental and Regulatory Concerns Restrain Market Expansion
Market growth faces limitations due to environmental concerns, regulatory guidelines promoting sustainable and low-emission materials, and competition from alternative jointing solutions. Compliance with sustainability standards and eco-friendly formulations increases production complexity and costs. Additionally, dependence on polymer-based raw materials and price volatility pose challenges for large-scale adoption. These restraints drive manufacturers to innovate with high-performance, eco-friendly, and durable polymeric sand solutions while maintaining affordability and regulatory compliance.
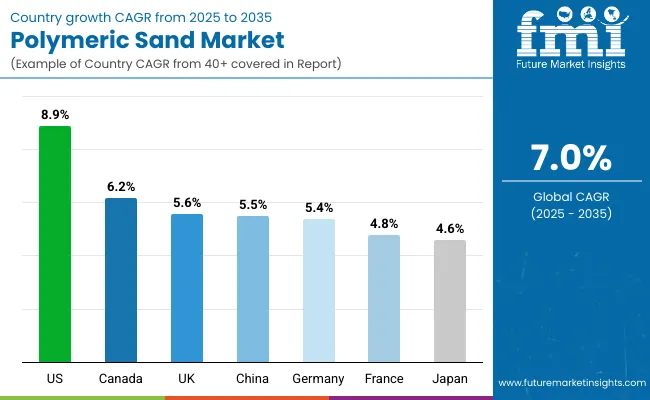
| Country | CAGR (2025 to 2035) |
|---|---|
| United States | 8.9% |
| Canada | 6.2% |
| United Kingdom | 5.6% |
| China | 5.5% |
| Germany | 5.4% |
| France | 4.8% |
| Japan | 4.6% |
The United States leads with a strong CAGR of 8.9%, driven by robust residential and commercial landscaping projects, urban infrastructure expansion, and rising demand for durable, low-maintenance hardscaping materials. Canada follows with a solid 6.2% CAGR, supported by sustainable construction initiatives and increased adoption in residential landscaping. The United Kingdom’s 5.6% CAGR reflects growing interest in patios and modern outdoor living spaces. China’s 5.5% CAGR is propelled by rapid urbanization, expansion of outdoor leisure spaces, and investments in polymeric sand technologies. Germany (5.4%) benefits from modernization of outdoor areas and eco-friendly hardscaping solutions. France (4.8%) sees growth due to infrastructural development and landscape enhancement trends.
The report covers an in-depth analysis of 40+ countries; seven top-performing OECD countries are highlighted below.
Revenue from polymeric sand in the USA is projected to grow at a CAGR of 8.9% from 2025 to 2035, leading global expansion driven by rising demand for durable, low-maintenance, and aesthetically appealing hardscaping solutions. Growth is supported by increased adoption in patios, footpaths, pool decks, and commercial landscaping projects. Innovations in eco-friendly formulations and pre-blended mixes enhance market penetration in both retail and contractor channels. Rising urbanization and outdoor living trends further accelerate adoption. Investments in scalable production technologies improve quality and consistency, supporting expansion across residential, commercial, and infrastructural projects.
The polymeric sand market in Canada is expected to expand at a CAGR of 6.2% from 2025 to 2035, driven by sustainable construction initiatives and increasing focus on low-maintenance landscaping materials. Adoption in patios, driveways, and commercial hardscaping is accelerating. Advanced production processes and color options support high-quality output. Expansion of retail and online distribution channels broadens market access. Government programs promoting eco-friendly materials encourage adoption in residential and municipal projects.
Sales in the UK are projected to grow at a CAGR of 5.6% from 2025 to 2035, fueled by rising outdoor living space trends and decorative landscaping projects. Patios and footpaths drive demand, supported by durable and aesthetically pleasing jointing materials. Contractors and DIY consumers favor polymeric sand for its easy installation and long-lasting performance. Retailers expand product offerings with multiple color options and pre-blended mixes. Sustainability and eco-friendly considerations influence both production and packaging.
The polymeric sand market in China is expected to grow at a CAGR of 5.5% from 2025 to 2035, driven by urbanization, outdoor leisure space development, and investments in polymeric sand manufacturing technology. Expansion of residential and commercial landscaping projects, along with online and retail distribution networks, supports adoption. Sustainable and high-performance formulations gain traction in new developments. Increasing consumer preference for durable and low-maintenance landscaping materials is further accelerating growth. Partnerships between manufacturers and construction companies are fostering innovation in polymeric sand application techniques.
Demand for polymeric sand in Germany is expected to grow at a CAGR of 5.4%from 2025 to 2035, supported by modernization of outdoor areas and increasing preference for low-maintenance, eco-friendly hardscaping solutions. Residential and commercial projects benefit from aesthetic and durable jointing materials. Sustainability, quality compliance, and color variety strengthen adoption. Government initiatives promoting environmentally sustainable materials are encouraging wider use. Technological advancements in polymeric sand production are improving product performance and ease of installation.
The polymeric sand market in France is expected to grow at a CAGR of 4.8% from 2025 to 2035, influenced by infrastructural development, outdoor leisure trends, and aesthetic landscaping preferences. Patios, footpaths, and commercial hardscaping drive usage. Innovative color blends and durable pre-blended mixes attract consumers and contractors. Urban beautification projects in major cities are supporting adoption. Rising awareness of maintenance-efficient landscaping materials among homeowners is boosting demand.
The polymeric sand market in Japan is projected to grow at a CAGR of 4.6% from 2025 to 2035. Growth is fueled by steady demand for durable and low-maintenance landscaping materials in urban environments where space optimization and aesthetic outdoor designs are gaining traction. Patio and footpath applications lead adoption, supported by consumer focus on long-lasting, weed-resistant solutions. Government initiatives promoting sustainable construction materials also boost uptake. Japanese manufacturers emphasize precision formulations with enhanced weather resistance, appealing to both residential and commercial hardscaping projects.
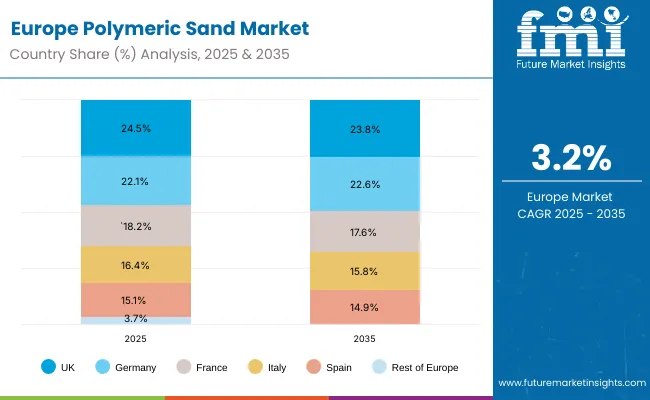 The polymeric sand market in Europe is projected to grow from USD 25.8 billion in 2025 to USD 35.4 billion by 2035, registering a CAGR of 3.2% over the forecast period. The United Kingdom is expected to maintain its leadership with 24.5% in 2025, declining slightly to 23.8% by 2035, supported by expansive outdoor-living trends and premium hardscaping project development. Germany follows as the second-largest market, accounting for 22.1% in 2025, edging up to 22.6% by 2035 on the back of sustainable construction initiatives and advanced polymer technology integration in landscaping applications.
France is projected to hold 18.2% in 2025, easing modestly to 17.6% by 2035 as urban beautification and municipal projects continue to drive demand. Italy contributes 16.4% in 2025, trimming to 15.8% by 2035 with growth concentrated in residential renovation and commercial outdoor spaces, while Spain represents 15.1% in 2025, moving to 14.9% by 2035 supported by tourism-related landscaping and municipal projects. The Rest of Europe (emerging Eastern European and Nordic markets) increases from 3.7% in 2025 to 5.3% by 2035, reflecting growing adoption of premium, climate-appropriate polymeric sand solutions.
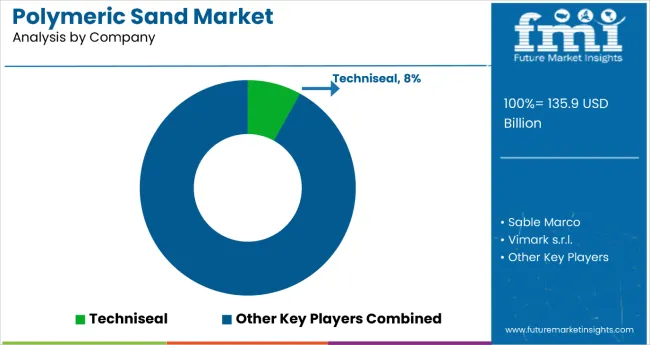
The market is moderately consolidated, comprising a mix of multinational construction material manufacturers, regional suppliers, and specialized hardscaping solution providers. Key players include Techniseal, Sable Marco, Vimark s.r.l., Semcostone, Sakrete, SRW Products, Alliance Designer Products Inc., SEK-Surebond, Unilock, and Ashgrove Polymeric Sand. These companies leverage advanced manufacturing technologies, proprietary formulations, and extensive distribution networks to cater to diverse applications, including patios, walkways, driveways, pool decks, and other outdoor landscaping projects.
The market is characterized by polymeric sand blends, which dominate due to superior durability, joint stability, and resistance to weed growth and erosion. These blends account for the majority of demand, driven by their long-term performance and minimal maintenance requirements. Other variants, including specialty colored and eco-friendly formulations, are gaining traction in premium residential and commercial landscaping projects, reflecting evolving consumer preferences and design trends. Companies continue to focus on product innovation, improving weather resistance, and developing sustainable formulations to meet growing environmental and regulatory expectations.
Strategic initiatives such as mergers and acquisitions, partnerships, and regional expansions are common among market players aiming to enhance market penetration. Additionally, firms are investing in eco-friendly production technologies and sustainable raw materials to address environmental concerns and meet regulatory guidelines. Overall, the polymeric sand market is evolving with established and emerging players strengthening their positions through innovation, sustainability initiatives, and expanded geographic reach, shaping the competitive dynamics of the industry.
| Items | Values |
|---|---|
| Quantitative Units (2025) | USD 135.9 billion |
| By Product Type | Polymeric Sand and Polymeric Dust |
| By Colour | Beige, Gray, and Black & Others |
| By Application | Footpaths, Patios, Pool Decks, Parking Spaces, and Pavements & Auxiliary Spaces |
| By End-Use | Residential, Commercial, and Infrastructural |
| Regions Covered | North America, Latin America, Western Europe, Eastern Europe, South Asia and Pacific, East Asia, and Middle East & Africa |
| Countries Covered | United States, Canada, United Kingdom, Germany, France, China, Japan, South Korea, Brazil, Australia, and 40+ countries |
| Key Players | Techniseal, Sable Marco, Vimark S.r.l, Semcostone, Sakrete, SRW Products,Alliance Designer Products Inc, SEK-Surebond, Unilock, and Ashgrove Polymeric Sand |
| Additional Attributes | Dollar sales by value, market share across product and application segments, regional demand trends, competitive landscape, adoption in construction and landscaping, and country-wise analysis highlighting key growth drivers and market penetration |
Residential
North America
The global polymeric sand market is estimated to be valued at USD 135.9 billion in 2025.
The market size for polymeric sand is projected to reach USD 267.5 billion by 2035.
The polymeric sand market is expected to grow at a 7.0% CAGR between 2025 and 2035.
Polymeric sand is projected to lead in the polymeric sand market with 82% market share in 2025.
In terms of application, patios are projected to command 35% share in the polymeric sand market in 2025.


Full Research Suite comprises of:
Market outlook & trends analysis
Interviews & case studies
Strategic recommendations
Vendor profiles & capabilities analysis
5-year forecasts
8 regions and 60+ country-level data splits
Market segment data splits
12 months of continuous data updates
DELIVERED AS:
PDF EXCEL ONLINE
Demand for Polymeric Sand in EU Size and Share Forecast Outlook 2025 to 2035
Polymeric Adsorbents Market Size and Share Forecast Outlook 2025 to 2035
Polymeric Microcapsules Market Size and Share Forecast Outlook 2025 to 2035
Polymeric Membrane Market Growth - Trends & Forecast 2025 to 2035
Polymeric Optical Fiber Market
Sandwich Panel System Market Size and Share Forecast Outlook 2025 to 2035
Sand Abrasion Tester Market Size and Share Forecast Outlook 2025 to 2035
Sand Testing Equipments Market Size and Share Forecast Outlook 2025 to 2035
Sandhoff Disease Therapeutics Market Size and Share Forecast Outlook 2025 to 2035
Sandwich Maker Market Size and Share Forecast Outlook 2025 to 2035
Sand Blasting Machines Market Size and Share Forecast Outlook 2025 to 2035
Sand Processing Equipment Market Size and Share Forecast Outlook 2025 to 2035
Sandblasting Media Market Size and Share Forecast Outlook 2025 to 2035
Sand Screens Market Analysis - Size, Growth, and Forecast 2025 to 2035
Sand Control Screens Market Growth - Trends & Forecast 2025 to 2035
Sandwich Containers Market Insights & Industry Analysis 2023-2033
Sand Control Tools Market
Sanding Sugar Market
Sander Market
Sandwich Preparation Refrigerators Market

Thank you!
You will receive an email from our Business Development Manager. Please be sure to check your SPAM/JUNK folder too.
Chat With
MaRIA