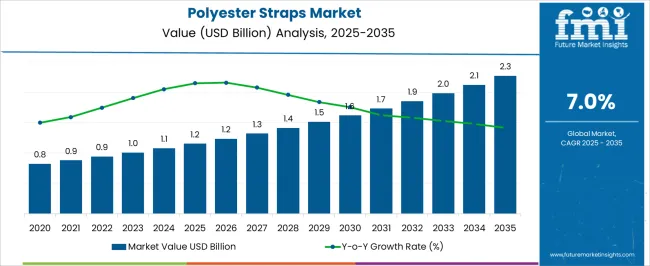
The Polyester Straps Market is estimated to be valued at USD 1.2 billion in 2025 and is projected to reach USD 2.3 billion by 2035, registering a compound annual growth rate (CAGR) of 7.0% over the forecast period.
| Metric | Value |
|---|---|
| Polyester Straps Market Estimated Value in (2025 E) | USD 1.2 billion |
| Polyester Straps Market Forecast Value in (2035 F) | USD 2.3 billion |
| Forecast CAGR (2025 to 2035) | 7.0% |
The Polyester Straps market is witnessing steady growth, driven by increasing demand across packaging, logistics, and industrial applications. Rising global trade, e-commerce expansion, and the need for secure and reliable cargo handling are contributing to the adoption of polyester straps. These straps are preferred for their high tensile strength, durability, and resistance to environmental factors, including moisture, UV exposure, and temperature variations.
Technological advancements in strap manufacturing, including high-quality polyester materials and precise tensioning methods, are enhancing product performance and safety. The market is further supported by growing awareness regarding sustainable packaging solutions, as polyester straps are reusable and recyclable.
Standardization of industrial packaging protocols and increasing adoption of automated strapping machines are creating additional growth opportunities As manufacturers continue to focus on product quality, operational efficiency, and cost-effectiveness, the Polyester Straps market is expected to sustain long-term growth, with innovations in material composition, product design, and application versatility driving adoption across various end-use sectors.
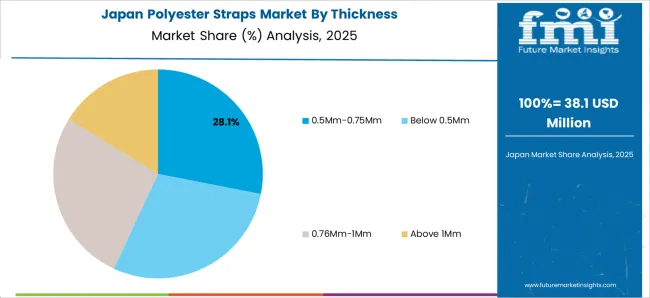
The 0.5Mm-0.75Mm thickness segment is projected to hold 28.4% of the market revenue in 2025, establishing it as the leading thickness category. Growth in this segment is driven by the optimal balance between tensile strength and flexibility, which makes these straps suitable for medium to heavy packaging requirements. The thickness allows for secure bundling without adding excessive material weight, improving handling efficiency and reducing shipping costs.
High resistance to stretching and tearing ensures reliability during transport and storage, which is critical for industrial and logistics applications. Manufacturing processes that ensure precise thickness tolerances enhance product consistency and performance.
Demand is further supported by the increasing adoption of automated strapping machines in warehouses and manufacturing facilities, which require standardized strap dimensions As packaging standards evolve and supply chain efficiency becomes a priority, the 0.5Mm-0.75Mm thickness segment is expected to maintain its market leadership, driven by reliability, cost-effectiveness, and wide applicability across industries.
The hand grade polyester straps segment is expected to account for 54.7% of the market revenue in 2025, making it the leading packing grade category. Growth is being driven by the ease of handling and application, as these straps do not require specialized machinery for bundling and securing packages. Hand grade straps are preferred in small-scale manufacturing, retail, and logistics operations where flexibility and manual convenience are important.
Their high tensile strength and durability ensure secure packaging while supporting cost-effective operations. Adoption is further reinforced by the ability to cut, loop, and seal straps manually, enabling use in various package sizes and shapes.
Increasing demand for lightweight and reusable packaging materials also supports the popularity of hand grade straps As businesses focus on operational efficiency, sustainability, and adaptability in packaging practices, the hand grade polyester straps segment is expected to maintain a leading market position, supported by ongoing improvements in material strength, user-friendliness, and versatility.
The 5Mm-15Mm width segment is projected to hold 37.2% of the market revenue in 2025, establishing it as the leading width category. Growth in this segment is driven by its suitability for a wide range of packaging applications, from small parcels to medium-sized industrial bundles.
Straps within this width range offer a balance between load-bearing capacity and ease of handling, ensuring secure transport without excessive material usage. Enhanced durability and resistance to elongation or snapping contribute to operational reliability and reduce product damage risks.
Adoption is further supported by standardization in packing operations and compatibility with both manual and semi-automatic strapping systems As packaging and logistics operations continue to scale globally, the 5Mm-15Mm width range is expected to remain the preferred choice for manufacturers and distributors seeking an optimal combination of performance, efficiency, and versatility in polyester straps.
The global demand for polyester straps is projected to increase at a CAGR of 3.2% during the forecast period between 2020 and 2025, reaching a total of USD 2.3 million in 2035.
According to Future Market Insights, a market research and competitive intelligence provider, the polyester straps market was valued at USD 1.2 million in 2025.
Traditional plastic straps, such as those made from polypropylene (PP) or polyethylene (PE), have raised concerns due to their negative impact on the environment. The plastic straps are derived from fossil fuels and have limited recyclability. improper disposal of plastic straps can contribute to pollution, waste accumulation, and harm to ecosystems.
There is a rising demand for sustainable alternatives, in response to these concerns, including polyester straps made from recycled or recyclable materials.
Recycled polyester straps are manufactured using post-consumer or post-industrial waste materials, such as plastic bottles or industrial scrap, which are processed and transformed into polyester resin. The recycling process reduces the consumption of virgin resources and decreases waste generation.
Polyester straps made from recyclable materials can be recycled and used to produce new straps or other polyester products. The closed-loop recycling system helps minimize waste and conserve resources. It also aligns with circular economy principles, which emphasize the reuse and recycling of materials to create a more sustainable and efficient system.
The adoption of sustainable polyester straps offers several benefits. It helps reduce the reliance on non-renewable resources and decreases the carbon footprint associated with the production of virgin materials. The environmental impact of polyester straps is significantly reduced by utilizing recycled or recyclable materials.
The use of sustainable polyester straps aligns with the sustainability goals and commitments of companies across various industries. Many businesses are proactively implementing eco-friendly practices and seeking packaging solutions that support their sustainability initiatives.
Companies can enhance their environmental stewardship, improve their brand image, and meet the increasing consumer demand for sustainable products, by using sustainable polyester straps.
Increasing Demand from Automotive Industry is Likely to be Beneficial for Market Growth
The adoption of lightweight and high-performance polyester straps is a significant trend driving the growth of the polyester straps market. The straps offer an excellent combination of strength and weight, making them ideal for industries where weight reduction and efficiency are crucial considerations.
One of the key advantages of polyester straps is their high strength-to-weight ratio. Compared to other strapping materials such as steel, polyester straps provide comparable strength while being significantly lighter.
This lightweight characteristic offers several benefits. It makes handling and maneuvering the straps easier, reducing physical strain and improving worker productivity. The lightweight nature of polyester straps also contributes to faster and more efficient strapping operations, saving time and labor costs.
The use of lightweight polyester straps is particularly valuable in industries that require frequent or extensive strapping, such as logistics, shipping, and warehousing. The industries often deal with high-volume packaging and transportation, where the weight of strapping materials can have a significant impact on overall costs.
Companies can reduce the weight of packaging materials without compromising on the strength and security of the strapped goods, which leads to cost savings in terms of transportation expenses, as lighter straps contribute to lower fuel consumption and improved vehicle efficiency.
The lightweight nature of polyester straps also offers benefits in terms of environmental sustainability. Reduced weight in packaging materials leads to lower carbon emissions during transportation, contributing to a greener and more sustainable supply chain. Companies are actively seeking lightweight packaging solutions that can help them reduce their carbon footprint, with the increasing focus on environmental responsibility.
Customization & Branding Opportunities to Fuel the Market Growth
Customization and branding opportunities are key factors contributing to the growth of the polyester straps market. Polyester straps can be easily customized and printed with various designs, logos, company names, or promotional messages, offering companies a unique and effective way to enhance their brand visibility and product differentiation.
Companies can create a packaging solution that aligns with their brand image and values, by customizing polyester straps. The ability to print company logos or names on the straps allows for consistent branding across packaging materials, reinforcing brand recognition and recall.
Custom-printed polyester straps can serve as a powerful marketing tool, as they are visible during handling, transportation, and storage of goods. The visibility helps to create a positive brand impression and can attract attention from potential customers or business partners.
Customized polyester straps enable companies to communicate important information or messages to their customers, which can include product details, handling instructions, safety precautions, or even promotional offers.
Companies ensure that crucial information is readily available to customers, making their packaging more informative and user-friendly, by printing such information on the straps, which can lead to improved customer satisfaction and loyalty.
The ability to customize polyester straps also offers product differentiation in a competitive market. Companies can make their packaging stand out from competitors and create a memorable visual impact, by using unique designs, colors, or patterns.
Customized polyester straps provide an opportunity to showcase creativity and innovation, making the packaging more visually appealing and attractive to consumers. The differentiation can help companies capture consumer attention, increase brand recall, and ultimately drive sales.
5 mm to 15 mm to Take the Lion’s Share
The polyester straps with less thickness can be produced using less amount of raw material, which offers manufacturers increased profit margins.
These have high strength along with excellent prolongation properties offered by polyester straps, even with minimum width that makes it a preferred choice for end-user industries as well as logistical partners.
Out of the total polyester straps sold across the globe in 2025, almost 1/3rd of them have a width between 5mm to 15mm. The segment is expected to hold a CAGR of 7.3% during the forecast period.
Bundling to Take the Lion’s Share
In all operations of the supply chain right from the manufacturer’s place to the seller or final consumer, the safety of cargo is viewed as the most important part during transit. Loose goods or cargo always pose a risk of spillage or wastage during any stage of the supply chain, which results in irrecoverable damages for all stakeholders.
Bundling has emerged as a universally chosen method to ensure the safeguarding of the cargo, to enhance the safety of the cargo during all types of transit. The total sales of polyester straps used for bundling are expected to increase by USD 230 million over the analysis period. The segment is expected to hold a CAGR of 7.2% during the forecast period.
Increasing International Trade to Boost the Market Growth
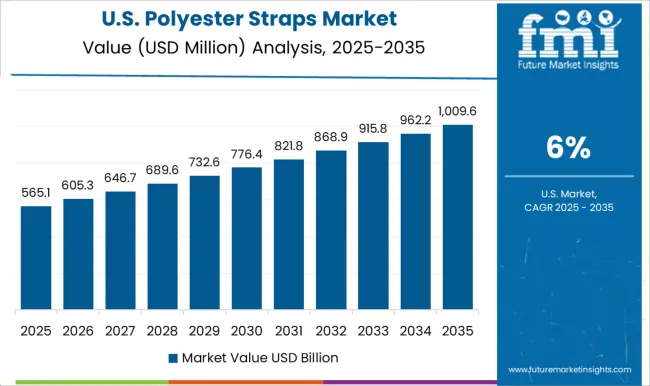
According to the World Trade Organization, the total exports done by the United States are valued at USD 1.4 trillion in 2025, and total imports by the country are valued at USD 2.4 trillion 2025. The United States is one of the major international trade partners of all the countries globally.
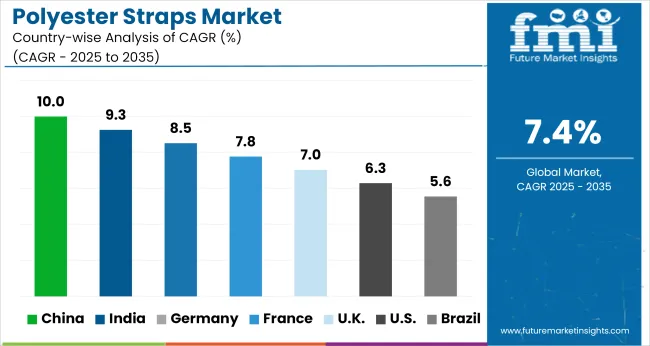
The recent government relief package for economic recovery in the post-pandemic period indicates the rise of international trade in the United States over the forecast period. The country is expected to hold a CAGR of 7.3% over the analysis period.
The rising international trade has a direct relation with increasing demand for polyester straps for several applications such as palletizing and bundling of cargo for ensuring safety during the voyage.
The increased exports and imports also fuel the domestic trade within the country which includes a transit of cargo to the farthest markets using rail, and road networks which also generates a significant demand for polyester straps across the country. The country accounted for 77% of total sales of polyester straps across North America in 2025.
Rise in Manufacturing Activities to Boost the Market Growth
According to the latest data from the Ministry of Commerce and Industry in India, the total exports done by the country were valued at USD 1.2 billion in 2025, while the total imports in India were valued at USD 72 billion in 2025.
The initiatives by the government of India to provide smooth processing of Foreign Direct Investment in the country, makes India an emerging global manufacturing hub for all kinds of industries.
The sharp rise in manufacturing activities across the country attracts globally renowned companies to set up their operational facilities to achieve economies of scale. Sales of polyester straps across India are estimated to grow at 8.5% CAGR over the next decade, making it the fastest-growing offering country across the Asia-Pacific region.
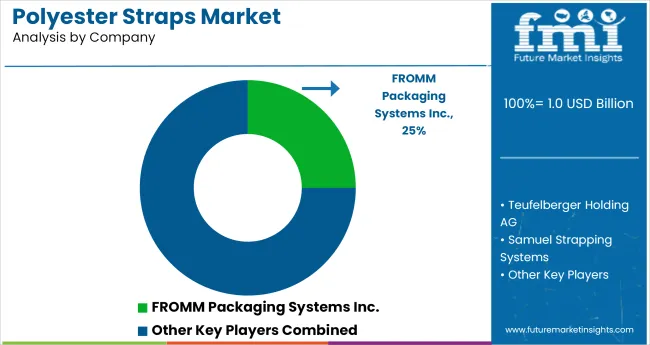
Key players in the polyester straps market are strongly focusing on profit generation from their existing product portfolios along while exploring potential new applications. The players are emphasizing on increasing their polyester straps production capacities, to cater to the demand from numerous end use industries.
Prominent players are also pushing for geographical expansion to decrease the dependency on imported polyester straps.
Recent Developments:
| Attribute | Details |
|---|---|
| Forecast Period | 2025 to 2035 |
| Historical Data Available for | 2020 to 2025 |
| Market Analysis | USD Million for value and Tons for Volume |
| Key Regions Covered | North America; Latin America; Western Europe; Eastern Europe; East Asia & Pacific; South Asia; and Middle East & Africa |
| Key Countries Covered | United States, Canada, Brazil, Mexico, Germany, United Kingdom, France, Spain, Italy, Poland, Russia, Czech Republic, Romania, India, Bangladesh, Australia, New Zealand, China, Japan, South Korea, GCC Countries, South Africa, Israel. |
| Key Segments Covered | Thickness, Packing Grade, Width, Breaking Strength, End Use Industry, Application, and Region |
| Key Companies Profiled | Teufelberger holding ag; Samuel Strapping Systems; FROMM Packaging Systems Inc.; Mosca GmbH; Industrial Yarns Pty Ltd.; Linder GmbH; The Plastic Strapping Company Ltd; Northshore Strapping Company; Plastic Extruders Ltd.; National Webbing Products; Campanini UGO S.P.A; Signor limited; Consent LLC; Narrowtex Pty (Ltd.); Universal Strapping Inc.; Mil-Spec Packaging; Bowmer Bond Narrow Fabrics Limited; Nottingham Narrow Fabrics Ltd; DAE YANG STRAPS CO., LTD; Johnson Plastics & Supply |
| Report Coverage | Market Forecast, brand share analysis, competition intelligence, DROT analysis, Market Dynamics and Challenges, Strategic Growth Initiatives |
| Customization & Pricing | Available upon Request |
The global polyester straps market is estimated to be valued at USD 1.2 billion in 2025.
The market size for the polyester straps market is projected to reach USD 2.3 billion by 2035.
The polyester straps market is expected to grow at a 7.0% CAGR between 2025 and 2035.
The key product types in polyester straps market are 0.5mm-0.75mm, below 0.5mm, 0.76mm-1mm and above 1mm.
In terms of packing grade, hand grade polyester straps segment to command 54.7% share in the polyester straps market in 2025.


Full Research Suite comprises of:
Market outlook & trends analysis
Interviews & case studies
Strategic recommendations
Vendor profiles & capabilities analysis
5-year forecasts
8 regions and 60+ country-level data splits
Market segment data splits
12 months of continuous data updates
DELIVERED AS:
PDF EXCEL ONLINE
Industry Share Analysis for Polyester Straps Companies
Polyester Polyol Market Size and Share Forecast Outlook 2025 to 2035
Polyester Hot Melt Adhesives Market Size and Share Forecast Outlook 2025 to 2035
Polyester Fiber Market Size and Share Forecast Outlook 2025 to 2035
Polyester Labels Market – Growth & Demand 2025 to 2035
Polyester Resin Dispersion Market Analysis & Forecast by Viscosity Type, Process, End-Use Industry and Region through 2025 to 2035
Nonwoven Polyester Fabric Market Growth – Trends & Forecast 2025 to 2035
Saturated Polyester Resin Market Growth – Trends & Forecast 2024-2034
Metallised Polyester Films Market Size and Share Forecast Outlook 2025 to 2035
High-Strength Polyester Thread Market Size and Share Forecast Outlook 2025 to 2035
Titanium Catalyst for Polyester Market Size and Share Forecast Outlook 2025 to 2035
PET Straps Market Size and Share Forecast Outlook 2025 to 2035
Market Positioning & Share in the PET Straps Market
Packaging Straps and Buckles Market Size and Share Forecast Outlook 2025 to 2035
Automotive Straps Market Size and Share Forecast Outlook 2025 to 2035
PVC Packing Straps Market Report – Key Trends & Forecast 2025 to 2035

Thank you!
You will receive an email from our Business Development Manager. Please be sure to check your SPAM/JUNK folder too.
Chat With
MaRIA