The Point-of-Care Food Sensitivity Testing Market is estimated to be valued at USD 201.6 billion in 2025 and is projected to reach USD 619.2 billion by 2035, registering a compound annual growth rate (CAGR) of 11.9% over the forecast period.
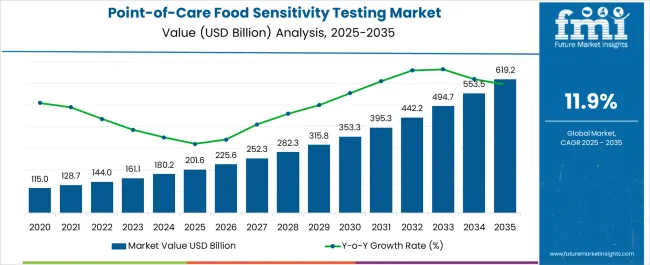
| Metric | Value |
|---|---|
| Point-of-Care Food Sensitivity Testing Market Estimated Value in (2025 E) | USD 201.6 billion |
| Point-of-Care Food Sensitivity Testing Market Forecast Value in (2035 F) | USD 619.2 billion |
| Forecast CAGR (2025 to 2035) | 11.9% |
The point of care food sensitivity testing market is expanding rapidly due to increasing awareness of food related intolerances and the demand for timely and reliable diagnostic solutions. Rising prevalence of celiac disease, lactose intolerance, and gluten sensitivity is driving adoption across clinical and consumer settings. The appeal of these tests lies in their ability to deliver accurate results quickly without the need for centralized laboratory infrastructure.
Technological advancements in biosensors, lateral flow assays, and portable testing devices have enhanced sensitivity and user friendliness, making them practical for both medical professionals and patients. Growing emphasis on personalized nutrition, preventive healthcare, and patient centric diagnostics is creating strong opportunities for innovation.
Regulatory support and initiatives promoting better dietary management are further reinforcing adoption trends. The outlook remains favorable as demand intensifies for accessible and cost effective testing options to support dietary management and improved quality of life.
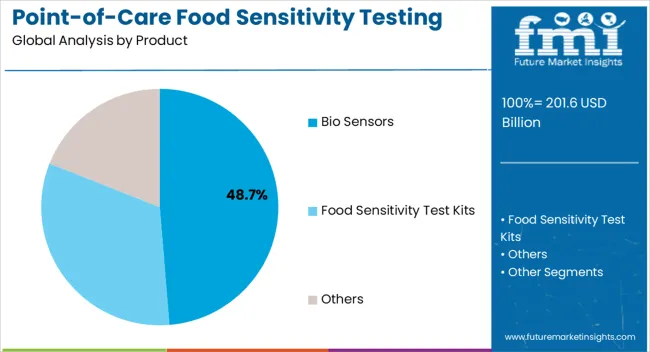
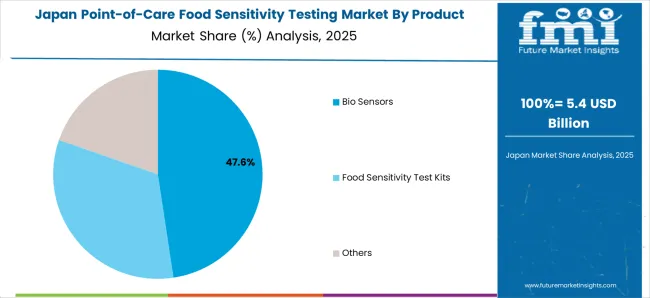
The bio sensors segment is expected to hold 48.70% of total revenue by 2025, making it the leading product category. This dominance is attributed to their ability to provide high sensitivity and real time detection of food allergens and intolerances.
Bio sensors are increasingly valued for their compact design, rapid turnaround time, and integration with digital platforms for result interpretation and tracking. Their adaptability across a wide range of food analytes and their use in portable devices have reinforced their widespread adoption in clinical and consumer applications.
With continuous advancements in nanotechnology and electrochemical sensing, bio sensors have secured their position as the preferred product category within the market.
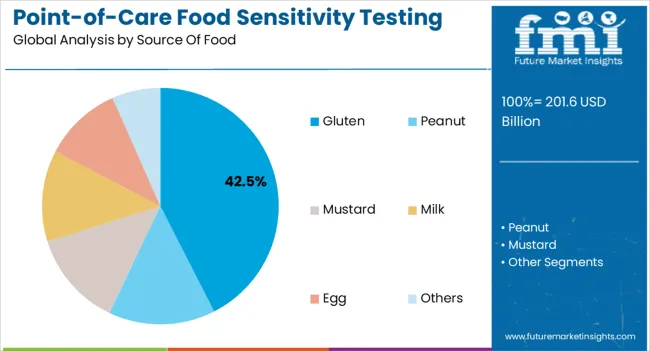
The gluten segment is projected to account for 42.50% of overall revenue by 2025 within the source of food category, making it the dominant sub segment. This is driven by the rising global prevalence of gluten intolerance and celiac disease, coupled with increasing consumer awareness of dietary sensitivities.
Gluten related conditions are among the most commonly diagnosed food sensitivities, which has amplified demand for accurate and rapid testing solutions. The strong focus on dietary management, preventive healthcare, and patient well being has reinforced the significance of gluten testing.
Enhanced adoption in both hospital and home based settings is ensuring the leadership of this segment in the market.
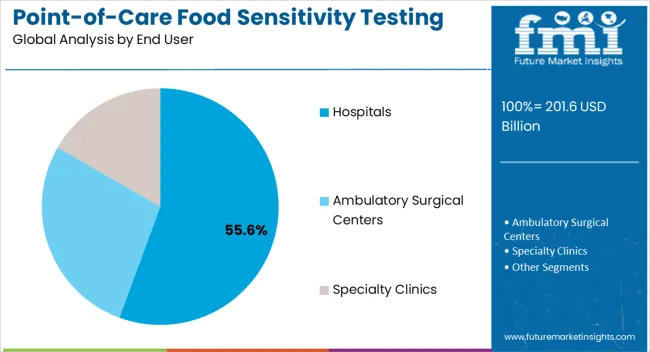
The hospitals segment is anticipated to command 55.60% of total market revenue by 2025 within the end user category, emerging as the leading segment. This share is being driven by the reliance on hospitals for accurate diagnostic services, access to advanced testing devices, and integration of results into patient care pathways.
Hospitals are at the forefront of implementing point of care food sensitivity tests due to their responsibility for managing chronic conditions and ensuring timely dietary interventions. The capacity to provide comprehensive diagnostic support and continuous monitoring has reinforced hospital adoption.
With growing demand for evidence based dietary management, hospitals are expected to remain the primary end users in the point of care food sensitivity testing market.
From 2012 to 2025, the global point-of-care food sensitivity testing market experienced a CAGR of 10.0%, reaching a market size of USD 201.6 million in 2025.
The prevalence of food allergies and intolerances continues to rise globally. According to various studies, a significant portion of the population experiences adverse reactions to certain foods. As awareness about these conditions increases, individuals are seeking accurate and convenient methods to identify and manage their food sensitivities, thereby driving the demand for point-of-care testing.
There is a growing trend of consumers being more health-conscious and proactive in managing their diets. Many individuals are adopting personalized nutrition plans and seeking to eliminate or reduce consumption of specific allergenic foods. Point-of-care food sensitivity testing provides a valuable tool for individuals to identify their trigger foods quickly, allowing them to make informed dietary choices and improve their overall well-being.
Future Forecast for Point-of-Care Food Sensitivity Testing Industry:
Looking ahead, the global point-of-care food sensitivity testing market is expected to rise at a CAGR of 12.5% from 2025 to 2035. During the forecast period, the market size is expected to reach USD 619.2 million by 2035.
Point-of-care food sensitivity testing is increasingly being adopted in various healthcare settings, including hospitals, clinics, and diagnostic centers. Healthcare professionals are recognizing the value of food sensitivity testing as part of comprehensive patient care.
The ease of use and rapid results offered by point-of-care testing have made it a valuable tool in clinical practice, driving its demand in healthcare settings.
There have been notable advancements in point-of-care testing technologies, making them more accurate, user-friendly, and accessible. Portable devices and rapid diagnostic kits have improved the ease of use and reliability of food sensitivity tests. These advancements have expanded the market.
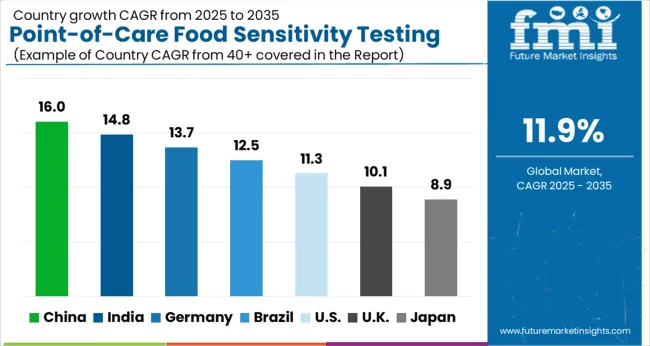
| Country | The United States |
|---|---|
| Market Size (USD Million) by End of Forecast Period (2035) | USD 619.2 million |
| CAGR % 2025 to End of Forecast (2035) | 11.6% |
The point-of-care food sensitivity testing market in the United States is expected to reach a market size of USD 619.2 million by 2035, expanding at a CAGR of 11.6%.
The United States has experienced a significant increase in the prevalence of food allergies and intolerances. This has created a higher demand for accurate and efficient testing methods to identify specific food sensitivities, driving the growth of the point-of-care food sensitivity testing market.
| Country | The United Kingdom |
|---|---|
| Market Size (USD Million) by End of Forecast Period (2035) | USD 29.3 million |
| CAGR % 2025 to End of Forecast (2035) | 12.8% |
The point-of-care food sensitivity testing market in the United Kingdom is expected to reach a market value of USD 29.3 million, expanding at a CAGR of 12.8% during the forecast period. Consumers in the United Kingdom are becoming more health-conscious and proactive in managing their diets. There is a growing emphasis on personalized nutrition, where individuals seek to understand their specific food sensitivities and make informed dietary choices. Point-of-care food sensitivity testing provides a convenient and timely solution, driving its adoption.
| Country | China |
|---|---|
| Market Size (USD Million) by End of Forecast Period (2035) | USD 41.1 million |
| CAGR % 2025 to End of Forecast (2035) | 14.6% |
The point-of-care food sensitivity testing market in China is anticipated to reach a market size of USD 41.1 million by the end of 2035, growing at a CAGR of 14.6% throughout the forecast period. There is an increasing focus on health and wellness in China, with consumers becoming more conscious of their dietary choices.
Many individuals are proactively seeking personalized nutrition and are willing to invest in technologies that enable them to better understand and manage their food sensitivities. This heightened health consciousness drives the demand for point-of-care food sensitivity testing.
| Country | Japan |
|---|---|
| Market Size (USD Million) by End of Forecast Period (2035) | USD 26.0 million |
| CAGR % 2025 to End of Forecast (2035) | 14.1% |
The point-of-care food sensitivity testing market in Japan is estimated to reach a market size of USD 26.0 million by 2035, expected to thrive at a CAGR of 14.1%. Japan places a strong emphasis on food safety and public health.
There are strict regulations and standards in place to ensure the safety of food products. In this context, point-of-care food sensitivity testing plays a crucial role in identifying potential allergens and supporting public health initiatives, making it an important market for such testing solutions.
The country has a strong focus on innovation and research, leading to the development of advanced point-of-care testing devices.
| Country | South Korea |
|---|---|
| Market Size (USD Million) by End of Forecast Period (2035) | USD 17.2 million |
| CAGR % 2025 to End of Forecast (2035) | 13.1% |
The point-of-care food sensitivity testing market in South Korea is expected to reach a market size of USD 17.2 million, expanding at a CAGR of 13.1% during the forecast period. South Korea has a well-established healthcare system with high-quality medical services.
The country emphasizes on early disease detection and prevention, and point-of-care food sensitivity testing aligns with this approach. The adoption of diagnostic innovations, including point-of-care testing, is relatively high in South Korea, driving market demand.
Based on products, food sensitivity test kits have dominated the category withholding the significant share of the market at around 49.0% at the end of 2025. Test kits provide rapid results, typically within minutes to hours, enabling individuals to receive immediate feedback about their food sensitivities.
This quick turnaround time is particularly beneficial for individuals who want to identify their trigger foods promptly and make necessary dietary adjustments. The demand for immediate results has driven the popularity of food sensitivity test kits.
Based on source of food, peanut segment has dominated the category withholding about 26.5% of the total market share in 2025. Peanuts contain specific proteins, such as Ara h1, Ara h2, and Ara h6, which are known to be highly allergenic.
These proteins have the potential to trigger immune responses in susceptible individuals, leading to allergic reactions. The composition of these allergenic proteins in peanuts differs from the proteins found in other food sources, making peanut allergies more common and severe.
The hospitals have led the point-of-care food sensitivity testing market as the leading end user with the market share of 59.4% in 2025. Hospitals are comprehensive healthcare facilities that provide a wide range of medical services, including diagnostic testing.
They have the infrastructure, equipment, and expertise to offer various diagnostic tests, including point-of-care food sensitivity testing. Hospitals serve as centralized hubs where patients can access comprehensive medical care, making them ideal for conducting food sensitivity testing.
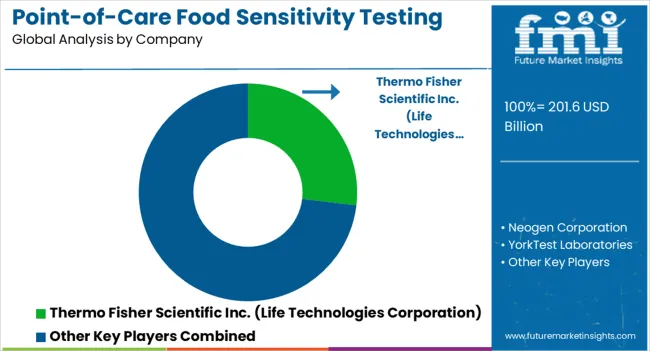
Manufacturers in the point-of-care food sensitivity testing industry stay competitive by investing in research and development, expanding their product portfolios, forming strategic partnerships, expanding their global presence, ensuring regulatory compliance, providing customer education and support, focusing on continuous improvement and quality assurance, and implementing effective pricing strategies. By adopting these strategies, companies can adapt to market dynamics, meet customer needs, and maintain their competitive edge.
Key Strategies Used by the Participants
Product Innovation
Key players continuously invest in research and development to introduce innovative products. They strive to develop assays with improved sensitivity, specificity, accuracy, and ease of use.
Strategic Partnerships and Collaborations
Key players often form strategic partnerships and collaborations with other companies, research institutions, and healthcare organizations. These partnerships can lead to knowledge sharing, joint product development, and expanded market reach.
Expansion into Emerging Markets
Expanding into emerging markets with growing healthcare infrastructure and rising demand for point-of-care food sensitivity testing allows companies to tap into new opportunities and gain a competitive edge.
Mergers and Acquisitions
Companies in the market may engage in mergers or acquisitions to streamline their product portfolio, obtain new technologies, enter new market niches, and gain access to novel products or intellectual property.
Key Developments in the Point-of-Care Food Sensitivity Testing Market:
The global point-of-care food sensitivity testing market is estimated to be valued at USD 201.6 billion in 2025.
The market size for the point-of-care food sensitivity testing market is projected to reach USD 619.2 billion by 2035.
The point-of-care food sensitivity testing market is expected to grow at a 11.9% CAGR between 2025 and 2035.
The key product types in point-of-care food sensitivity testing market are bio sensors, food sensitivity test kits and others.
In terms of source of food, gluten segment to command 42.5% share in the point-of-care food sensitivity testing market in 2025.


Our Research Products

The "Full Research Suite" delivers actionable market intel, deep dives on markets or technologies, so clients act faster, cut risk, and unlock growth.

The Leaderboard benchmarks and ranks top vendors, classifying them as Established Leaders, Leading Challengers, or Disruptors & Challengers.

Locates where complements amplify value and substitutes erode it, forecasting net impact by horizon

We deliver granular, decision-grade intel: market sizing, 5-year forecasts, pricing, adoption, usage, revenue, and operational KPIs—plus competitor tracking, regulation, and value chains—across 60 countries broadly.

Spot the shifts before they hit your P&L. We track inflection points, adoption curves, pricing moves, and ecosystem plays to show where demand is heading, why it is changing, and what to do next across high-growth markets and disruptive tech

Real-time reads of user behavior. We track shifting priorities, perceptions of today’s and next-gen services, and provider experience, then pace how fast tech moves from trial to adoption, blending buyer, consumer, and channel inputs with social signals (#WhySwitch, #UX).

Partner with our analyst team to build a custom report designed around your business priorities. From analysing market trends to assessing competitors or crafting bespoke datasets, we tailor insights to your needs.
Supplier Intelligence
Discovery & Profiling
Capacity & Footprint
Performance & Risk
Compliance & Governance
Commercial Readiness
Who Supplies Whom
Scorecards & Shortlists
Playbooks & Docs
Category Intelligence
Definition & Scope
Demand & Use Cases
Cost Drivers
Market Structure
Supply Chain Map
Trade & Policy
Operating Norms
Deliverables
Buyer Intelligence
Account Basics
Spend & Scope
Procurement Model
Vendor Requirements
Terms & Policies
Entry Strategy
Pain Points & Triggers
Outputs
Pricing Analysis
Benchmarks
Trends
Should-Cost
Indexation
Landed Cost
Commercial Terms
Deliverables
Brand Analysis
Positioning & Value Prop
Share & Presence
Customer Evidence
Go-to-Market
Digital & Reputation
Compliance & Trust
KPIs & Gaps
Outputs
Full Research Suite comprises of:
Market outlook & trends analysis
Interviews & case studies
Strategic recommendations
Vendor profiles & capabilities analysis
5-year forecasts
8 regions and 60+ country-level data splits
Market segment data splits
12 months of continuous data updates
DELIVERED AS:
PDF EXCEL ONLINE
Food Testing Services Market Size, Growth, and Forecast for 2025–2035
Examining Food Testing Services Market Share & Industry Outlook
UK Food Testing Services Market Report – Trends, Demand & Industry Forecast 2025–2035
Food Safety Testing Services Market Analysis – Size, Share, and Forecast Outlook 2025 to 2035
USA Food Testing Services Market Outlook – Share, Growth & Forecast 2025–2035
Food Allergen Testing Market - Size, Share, and Forecast Outlook 2025-2035
Food Pathogen Testing Market Analysis by Contaminant Type, Technology, Application, and Region through 2035
ASEAN Food Testing Services Market Analysis – Size, Share & Forecast 2025–2035
Food Authenticity Testing Services Market Analysis - Size, Share, and Forecast Outlook 2025 to 2035
Europe Food Testing Services Market Analysis – Size, Share & Forecast 2025–2035
At-Home Food Sensitivity Test Market Size and Share Forecast Outlook 2025 to 2035
Oral Food Challenge Testing Market Analysis Size and Share Forecast Outlook 2025 to 2035
Australia Food Testing Services Market Growth – Trends, Demand & Innovations 2025–2035
Warfarin Sensitivity Testing Market
Latin America Food Testing Services Market Growth – Trends, Demand & Innovations 2025–2035
Food & Beverage OEE Software Market Size and Share Forecast Outlook 2025 to 2035
Food Grade Crosslinked Polyvinylpolypyrrolidone (PVPP) Market Size and Share Forecast Outlook 2025 to 2035
Food Grade Cassia Gum Powder Market Size and Share Forecast Outlook 2025 to 2035
Food Grade Dry Film Lubricant Market Size and Share Forecast Outlook 2025 to 2035
Foodservice Equipment Market Analysis - Size, Share, and Forecast Outlook 2025 to 2035

Thank you!
You will receive an email from our Business Development Manager. Please be sure to check your SPAM/JUNK folder too.
Chat With
MaRIA