Global Point-of-Care Diagnostics Market Snapshot (2023 to 2033)

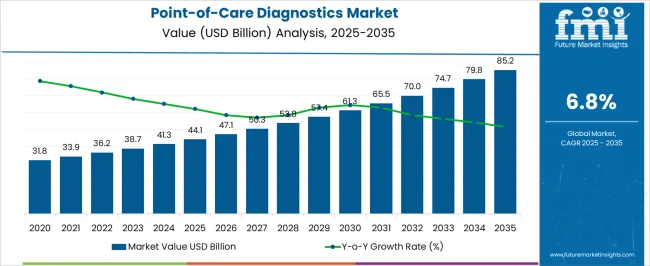
According to Future Market Insights research, during the projected period, the Global point-of-care diagnostics market is expected to grow at a CAGR of 6.8%. The market value is projected to increase from US$ 38.7 Billion in 2023 to US$ 74.8 Billion by 2033. The point-of-care diagnostics market was valued at US$ 36.6 Billion at the end of 2022 and is anticipated to exhibit Y-o-Y growth of 5.8% in 2023.

Market Outlook:

Data Points Market Insights
Market Value 2022 US$ 36.6 Billion
Market Value 2023 US$ 38.7 Billion
Market Value 2033 US$ 74.8 Billion
CAGR 2023 to 2033 6.8%
Share of Top 5 Countries 56.5%
Key Players The key players in the Global Point-of-Care Diagnostics Market Are F. Hoffmann-La Roche Ltd; Becton Dickinson & Company; Cepheid (Danaher);Siemens Healthineers; Abbott; Diasorin S.p.a.; Thermo Fisher Scientific Inc.; Qiagen; BIOMÉRIEUX; Hologic Inc.; Bio Rad Laboratories; Quidel Corporation; EKF Diagnostics; SEKISUI Diagnostics; DiaSys-Diagnostic Systems GmbH; InBios International; Inc.; Jiangsu Mole Bioscience Co.; Ltd.; ACON Laboratories; Inc.; Visby Medical; Inc.; UNIMA; INC.

Point-of-Care testing (POCT) refers to medical diagnostic testing that is performed near the patient, usually at the bedside or in a doctor's office, rather than in a central laboratory. The goal of POCT is to provide rapid and accurate diagnostic results that can guide clinical decision-making in real-time.

The world is seeing rapid advancements in a wide range of digital health technologies, including portable and ingestible devices; mobile health apps; artificial intelligence (AI); robots used in healthcare; 3D organ printing; block chain; telemedicine; machine learning; genome research; drones; augmented and virtual reality; and electronic records. However, the market is also shifting to digitalization, so the influx of digital health technologies is a prominent driver for point-of-care diagnostic market.

Accelerating the adoption of proven digital health technologies and advancing their embedding into routine care operations has the potential to revolutionize human health by boosting efficacy, driving costs down, and increasing access to and capacity for care delivery.

New product launches and approvals such as Lab-on-a-chip technology is one of the main drivers of POCT.

  • For example, microbiological culture, polymerase chain reaction (PCR) and enzyme-linked immunosorbent assays (ELISA) can now be used at the Point-of-Care.
  • According to FDA, in Mar 2020, Cepheid received emergency use authorization from the FDA for a rapid SARS-CoV-2 test as a result of adopting a rapid disease diagnostics method.

Overall, the increasing adoption of latest technologies and new product launches and approvals is likely to boost the market in the coming years.

Don't pay for what you don't need

Customize your report by selecting specific countries or regions and save 30%!

Sales Analysis of Global Point-of-Care Diagnostics Market from 2012 to 2022 Vs Market Outlook for 2023 to 2033

Sales of the global point-of-care diagnostics market grew at a CAGR of 6.2% between 2012 to 2022. Global point-of-care diagnostics market contributes 40.0% revenue share to the global in-vitro diagnostics market valued at US$ 91.2 Billion in 2022.

The increasing prevalence of Infectious diseases has resulted in higher uptake of POC diagnostic options such as Glucose and Hb1Ac testing. Because of their easy availability and rapid diagnosis, point-of-care diagnostics are typically the first form of testing recommended worldwide.

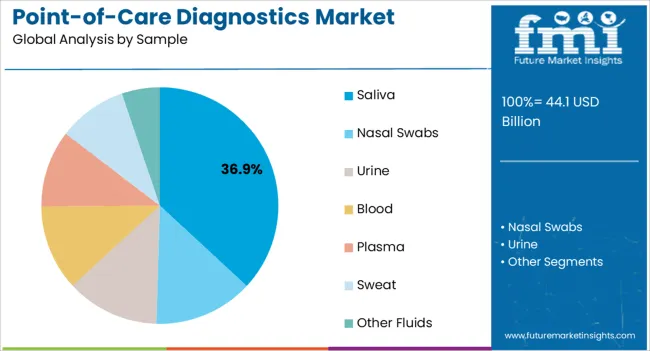
A significant advance has been made in the effort to identify SARS-CoV-2 coronavirus patients with the addition of saliva samples for the purpose of coronavirus identification. Governments concentrated on raising knowledge about COVID-19 testing during the COVID-19 epidemic to ensure an early identification of the illness. As a result of such initiatives, people become more knowledgeable of Point-of-Care testing for the diagnosis of coronavirus.

Creating awareness about diseases is an essential aspect of early detection and screening. If the public has a general understanding of diseases and symptoms, action plans can be better implemented. On the other hand, if there is a lack of awareness, it stops people from taking preventive measures or availing treatments.

Considering this, FMI expects the global market to grow at a CAGR of 6.8% through the forecasted years.

What are the Key Opportunities for Players in the Global Point-of-Care Diagnostics Market?

There is a lack of expansion of biotechnology & pharmaceutical Industries regarding point-of-care diagnostics. Biopharmaceuticals are one of modern science's most technically advanced and exquisite achievements. Pharmaceutical companies are putting in a lot of effort to produce medications and lifesaving vaccines and biologicals for the entire world. When the pharmaceutical sector employs biotechnological advancements and advanced processes, the result is better and faster drug delivery. Biotechnology has aided the pharmaceutical sector in the correct manufacturing of vaccines and medications.

The pharmaceutical sector intends to establish products that support the treatment of various diseases. This may result in pharma companies manufacturing point-of-Care (POC) devices.

While greater investment for innovative products is required for the growth of the market, the healthcare infrastructure can have a substantial impact on market expansion. Most healthcare authorities have recently committed increased financing for the development and enhancement of their healthcare infrastructure as a result of the COVID-19 pandemic. The development of Point-of-Care diagnostics kits and their production need more investment.

Overall, healthcare infrastructure for POCT is complex and evolving, and it is important that companies stay abreast of regulatory changes and work closely with regulators to ensure compliance. However, regulatory initiatives that promote safe and effective pain management can create growth opportunities for the POCT market, especially for companies that offer innovative solutions.

Increased testing of point-of-care diagnosis in patients will pave the way for new technology and treatment options, ultimately leading more improvement in healthcare infrastructure and growth in number of manufacturing facilities.

Sabyasachi Ghosh
Sabyasachi Ghosh

Principal Consultant

Talk to Analyst

Find your sweet spots for generating winning opportunities in this market.

Which Factors Could Possibly Restrain the Growth of Global Market?

Point-of-Care tests in some therapy areas have become more accurate (e.g., glucose testing). Overall, POC tests and rapid tests tend to remain less accurate compared to tests run in a laboratory. Accuracy is essential in medical testing, because an incorrect diagnosis can lead to inappropriate treatment, which can have serious consequences for patients. Inaccurate POC results can lead to false positives or false negatives, which can result in unnecessary treatment or missed diagnosis, respectively.

Inaccurate POCT results can also lead to mistrust in the technology, which can impact the adoption and utilization of POCT products. Healthcare providers may be hesitant to rely on POCT if they have concerns about its accuracy and reliability.

The cost of tests and a lack of trust in POC/ rapid testing are major concerns around the globe. The cost of point-of-care kits or devices is very high as compared to laboratory tests, which is compounded by the lower level of accuracy offered by the former.

Due to financial constraints, academic research laboratories are often unable to purchase expensive equipment. The overall cost of these instruments increases as a result of maintenance costs and other indirect expenses. Thus, the higher cost associated with the equipment and other factors causing unaffordability for the laboratories might hamper the market growth.

  • Due to less funding from governments and private funders, POCT devices cost more than regular laboratory tests, which hampers the growth of the point-of-care testing market.

These factors are expected to hamper revenue growth of the global market over the forecast period.
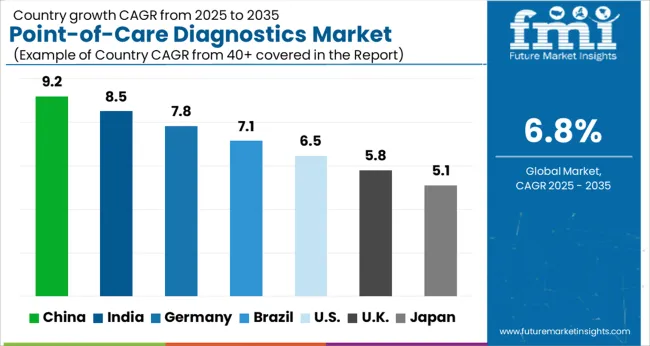
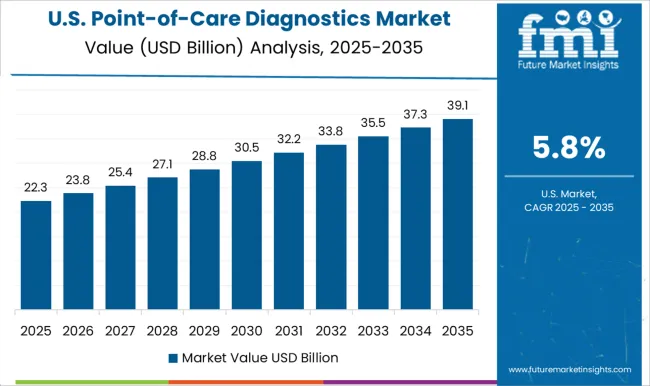
Country-wise Insights

What Makes the USA the Dominating Country in the Global Market?

USA dominated the global market in 2022 and is further expected to register growth rate at CAGR of 6.8%.

Diagnostic techniques, such as rapid testing or POCT like COVID-19 testing, glucose testing, and allergy tests, etc., has seen a high rate of patient acceptance as a result of the high prevalence. Awareness campaigns and strategic conferences with focus on point-of-care technologies for healthcare sector, has been undertaken by various associations in USA

In May 2022, American Association for Clinical Chemistry, organized a Point-of-Care testing boot camp for POCT professionals and experts in the lab medicine community.
Why is Germany considered to be a Lucrative Market for Point-of-Care Diagnostics?
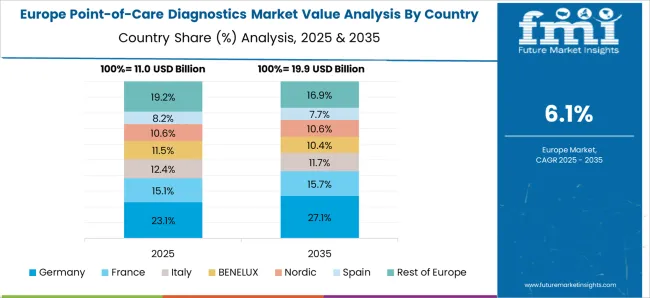
Germany dominated the European market with value share of 25.2% in 2022

The general physicians in primary care settings in Germany highly prefer POCTs as a useful diagnostic tool. There are numerous POCTs available in the German market. In the past few years, due to COVID-19 point-of-care diagnostics has been of tremendous importance as first line of defense for testing purpose.

The safe and successful use of point-of-care diagnostics in Germany is likely to influence other European countries to also opt for this method, ultimately resulting in market expansion.

What Makes China an Emerging Market for Global Point-of-Care Diagnostics?

China is projected to be the most attractive market in the east Asia point-of-care diagnostics and is expected to grow over a significant CAGR of 9.0% over the forecast period.

Point-of-care diagnostics market in China is expected to grow significantly in the coming years due to several factors.

One of the main factors driving the growth of the point-of-care diagnostics market in China is the increasing awareness of the condition among the general public and healthcare professionals. As more people become aware of the POC testing, they are more likely to adapt to the testing method, which is leading to increased demand for testing for Point-of-care diagnostics.

Another factor contributing to the growth of the Chinese market is the increasing availability of advanced medical technologies. China has made significant investments in its healthcare infrastructure, and many new hospitals and clinics have been built in recent years.

Get the data you need at a Fraction of the cost

Personalize your report by choosing insights you need
and save 40%!

Category-wise Insights

Why COVID-19 Testing held the Dominant Position within the Global Market?

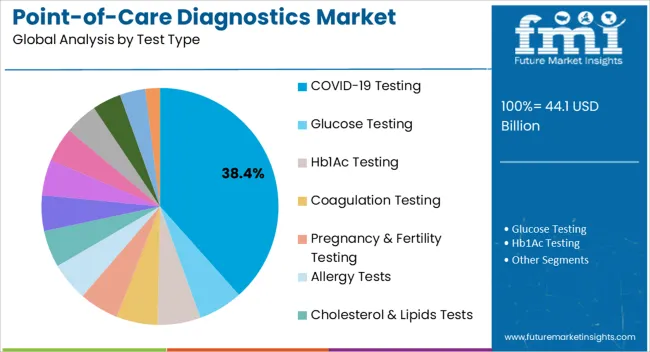
The COVID-19 testing diagnostic segment held the major chunk of about 15.1% in global market by the end of 2022. However, food sensitivity testing is the most lucrative segment over the forecast period due to increase in food allergic cases. Many of allergic reactions require rapid diagnosis that’s where point-of-care diagnostics plays a significant role.

Which Sample Type is Adopted the Most in Point-of-Care Diagnostics in 2022?

Nasal swabs segment accounted for revenue share of 28.4% in the global market at the end of 2022.

A nasopharyngeal swab, one type of nasal swab, is a test used to look for bacteria or viruses that cause respiratory infections. Your healthcare provider uses a swab to take a small sample of cells from your nasopharynx, the top part of your nose and throat.

Overall, nasal swabs offers a convenient sample type for point-of-care diagnostics for sample withdrawal, making it the largest sample type for this segment.

Which Product of Point-of-Care Diagnostics dominates the Global Market in 2022?

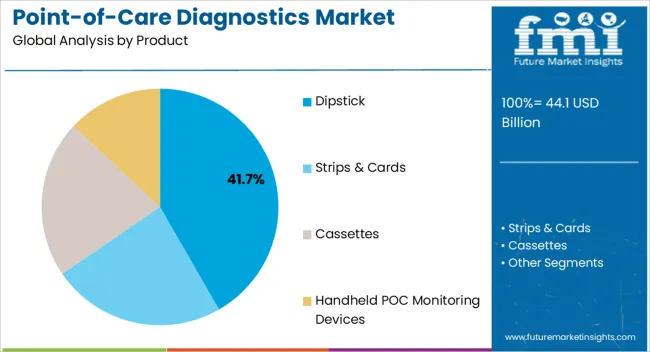
Handheld POC Monitoring Devices segment accounted for revenue share of 41.3% in the global market at the end of 2022.

Handheld POC monitoring devices can be used to monitor a wide range of medical conditions, such as diabetes, cardiovascular disease, and infectious diseases. For example, a handheld blood glucose meter can be used by patients with diabetes to monitor their blood sugar levels, while a handheld device that measures blood pressure can be used to monitor patients with hypertension.

Overall, Handheld POC Monitoring Devices offers a convenient Product type for Global Point-of-Care diagnostics treating products, making it the largest Product for this segment.

Why Hospitals held the Dominant Position within the Global Market?

Hospitals held the major chunk of about 27.7% in global market by the end of 2022.

Hospitals offers a convenient end user for POCT market conducting POC tests, making it the dominant end user for this segment. Hospitals segment is set to be highly lucrative in the upcoming years due to ease and access of POCT.
Competitive Landscape

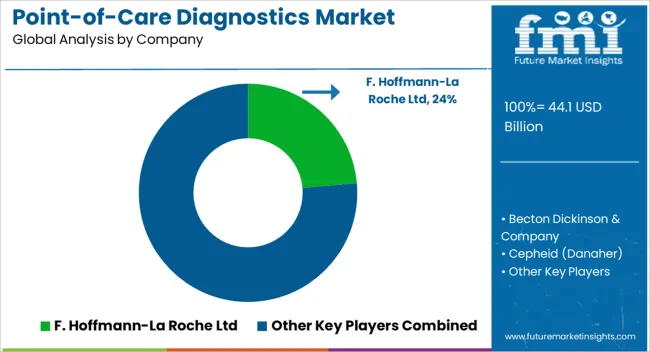
Collaboration are the top strategy being adopted by leading players to expand their product portfolio, their customer base as well as maintain their foothold in the market.

For instance:

  • The Elecsys Amyloid Plasma Panel (EAPP), a cutting-edge blood test from Roche Diagnostics that seeks to aid in the early identification of Alzheimer's disease, was developed in collaboration with Eli Lilly in March 2023.
  • Roche and Pfizer collaborated in the United States in December 2022 to assist patients, who test positive with COVID-19, in navigating risks, symptoms, testing, and treatment choices.

Similarly, recent developments have been tracked by the team at Future Market Insights related to companies in the Point-of-care Diagnostics Market space, which are available in the full report

Scope of the Global Point-of-Care Diagnostics Industry Report

Attribute Details
Forecast Period 2023 to 2033
Historical Data Available for 2012 to 2022
Market Analysis USD Million for Value
Key Regions Covered North America; Latin America; Europe; South Asia; East Asia; Oceania; Middle East and Africa (MEA)
Key Countries Covered USA, Canada, Brazil, Mexico, Argentina, Germany, UK, France, Italy, Spain, Russia, BENELUX, China, Japan, South Korea, India, Thailand, Indonesia, Malaysia, Australia, New Zealand, Türkiye, South Africa, and GCC Countries
Key Segments Covered Test Type, Sample, Product, End User, Region
Key Companies Profiled F. Hoffmann-La Roche Ltd; Becton Dickinson & Company; Cepheid (Danaher); Siemens Healthineers; Abbott; Diasorin S.p.a.; Thermo Fisher Scientific Inc.; Qiagen; BIOMÉRIEUX; Hologic Inc.; Bio Rad Laboratories; Quidel Corporation; EKF Diagnostics; SEKISUI Diagnostics; DiaSys-Diagnostic Systems GmbH; InBios International, Inc.; Jiangsu Mole Bioscience Co., Ltd.; ACON Laboratories, Inc.; Visby Medical, Inc.; UNIMA, INC.
Report Coverage Market Forecast, Competition Intelligence, DROT Analysis, Market Dynamics and Challenges, Strategic Growth Initiatives
Customization & Pricing Available upon Request

Key Segments Covered in Global Point-of-Care Diagnostics Industry Research

By Product:

  • Dipstick
  • Strips & Cards
  • Cassettes
  • Handheld POC Monitoring Devices

By Sample:

  • Saliva
  • Nasal Swabs
  • Urine
  • Blood
  • Plasma
  • Sweat
  • Other Fluids

By Test Type:

  • COVID-19 Testing
  • Glucose Testing
  • Hb1Ac Testing
  • Coagulation Testing
  • Pregnancy & Fertility Testing
  • Allergy Tests
  • Cholesterol & Lipids Tests
  • Drug of Abuse (DOA) Testing
  • Food Sensitivity Tests
  • Metabolism Tests
  • Vitamin D Tests
  • Vitamins B Test
  • Urinary Tract Infection (UTI) Tests
  • Sexual Health Tests
  • Water Testing Kits
  • Alcohol Tests
  • Others
  • Infectious Disease
    • HIV POC Testing
    • Clostridium Difficile POC Testing
    • HBV POC Testing
    • Pneumonia or Streptococcus Associated Infections Testing
    • Respiratory Syncytial Virus (RSV) POC Testing
    • HPV POC
    • Influenza/Flu POC Testing
    • HCV POC Testing
    • MRSA POC Testing
    • TB and Drug-resistant TB POC Testing & HSV POC Testing

By End User:

  • Hospitals
  • Clinics
  • Diagnostic Laboratories
  • Home Care Settings
  • Non-Government Organization
  • Government & Federal Agencies
  • Long Term Care Centers

By Region:

  • North America
  • Latin America
  • Europe
  • South Asia
  • East Asia
  • Oceania
  • Middle East and Africa (MEA)

Frequently Asked Questions

What is the Growth Potential of the Market?

The growth potential of the market is 6.8% through 2033.

Which Countries are Estimated to Hold High Lucrativeness?

The United States and Germany are projected to emerge as lucrative markets.

Why do Hospitals Hold the Dominant Position in the Global Market?

Hospitals offer a convenient end user for the POCT market conducting POC tests, making it the dominant end user.

Which Product of Point-of-Care Diagnostics Dominated the Global Market in 2022?

Handheld POC Monitoring Devices accounted for a revenue share of 41.3% in 2022.

What Drives Sales in the Market?

Efforts to produce medications and lifesaving vaccines and biologicals for the entire world drive sales.

Table of Content

1. Executive Summary

    1.1. Global Market Outlook

    1.2. Demand Side Trends

    1.3. Supply-Side Trends

    1.4. Analysis and Recommendations

2. Market Overview

    2.1. Market Coverage / Taxonomy

    2.2. Market Definition / Scope / Limitations

    2.3. Inclusions and Exclusions

3. Key Market Trends

    3.1. Key Trends Impacting the Market

    3.2. Development/Innovation Trends

4. Value-Added Insights

    4.1. Disease Epidemiology, By Indication

    4.2. Regulatory Scenario

    4.3. Reimbursement Landscape

    4.4. Unmet Needs and Opportunities

    4.5. Point-of-care Testing (POCT) Compared to a Conventional Testing Procedure

    4.6. Challenges and Benefits of POCT

    4.7. PESTLE Analysis

    4.8. Porter’s Analysis

    4.9. Value Chain Analysis

    4.10. Parent Market Analysis

5. Market Background

    5.1. Macro-Economic Factors

        5.1.1. Global GDP Growth Outlook

        5.1.2. Global Healthcare Expenditure

        5.1.3. Global In-vitro Diagnostics Market

    5.2. Forecast Factors - Relevance & Impact

        5.2.1. Top Companies Historical Growth

        5.2.2. Increasing Treatment Seeking Rate

        5.2.3. New Test Type Launches/Approvals

        5.2.4. Increasing Diagnosis Rate (%) of Infectious Diseases

        5.2.5. Increasing Incidence of Chronic Diseases

        5.2.6. Rising Adoption of POC Devices

        5.2.7. Government Initiatives to Combat Diseases

        5.2.8. Companies Increasingly Spending on R&D and Focus on Innovation

        5.2.9. Collaborations and Agreements between Manufacturers

    5.3. Market Dynamics

        5.3.1. Drivers

        5.3.2. Restraints

        5.3.3. Opportunity Analysis

6. COVID-19 Crisis - Impact Assessment

    6.1. COVID-19 and Impact Analysis

        6.1.1. By Test Type

        6.1.2. By Product

        6.1.3. By Sample

        6.1.4. By End User

        6.1.5. By Country

    6.2. 2022 Market Scenario

7. Global Market Demand Volume (Units) Analysis 2012 to 2022 and Forecast, 2023 to 2033

    7.1. Historical Market Volume Analysis, 2012 to 2022

    7.2. Current and Future Market Volume Projections, 2023 to 2033

        7.2.1. Y-o-Y Growth Trend Analysis

8. Global Market - Pricing Assessment

    8.1. Global Pricing Analysis

    8.2. Pricing Assumptions

9. Global Market Demand (in Value or Size in US$ Mn) Analysis 2012 to 2022 and Forecast, 2023 to 2033

    9.1. Historical Market Value (US$ Million) Analysis, 2012 to 2022

    9.2. Current and Future Market Value (US$ Million) Projections, 2023 to 2033

        9.2.1. Y-o-Y Growth Trend Analysis

        9.2.2. Absolute $ Opportunity Analysis

10. Global Market Analysis 2012 to 2022 and Forecast 2023 to 2033, By Test Type

    10.1. Introduction / Key Findings

    10.2. Historical Market Size (US$ Million) Analysis by Test Type, 2012 to 2022

    10.3. Current and Future Market Size (US$ Million) Analysis and Forecast by Test Type, 2023 to 2033

        10.3.1. Infectious Disease

            10.3.1.1. HIV POC Testing

            10.3.1.2. Clostridium Difficile POC Testing

            10.3.1.3. HBV POC Testing

            10.3.1.4. Pneumonia or Streptococcus Associated Infections Testing

            10.3.1.5. Respiratory Syncytial Virus (RSV) POC Testing

            10.3.1.6. HPV POC

            10.3.1.7. Influenza/Flu POC Testing

            10.3.1.8. HCV POC Testing

            10.3.1.9. MRSA POC Testing

            10.3.1.10. TB and Drug-resistant TB POC Testing

            10.3.1.11. HSV POC Testing

        10.3.2. COVID-19 Testing

        10.3.3. Glucose Testing

        10.3.4. Hb1Ac Testing

        10.3.5. Coagulation Testing

        10.3.6. Pregnancy & Fertility Testing

        10.3.7. Allergy Tests

        10.3.8. Cholesterol & Lipids Tests

        10.3.9. Drug of Abuse (DOA) Testing

        10.3.10. Food Sensitivity Tests

        10.3.11. Metabolism Tests

        10.3.12. Vitamin D Tests

        10.3.13. Vitamins B Test

        10.3.14. Urinary Tract Infection (UTI) Tests

        10.3.15. Sexual Health Tests

        10.3.16. Water Testing Kits

        10.3.17. Alcohol Tests

        10.3.18. Others

    10.4. Market Attractiveness Analysis by Test Type

11. Global Market Analysis 2012 to 2022 and Forecast 2023 to 2033, By Product

    11.1. Introduction / Key Findings

    11.2. Historical Market Size (US$ Million) Analysis & Volume Analysis by Product, 2012 to 2022

    11.3. Current and Future Market Size (US$ Million) & Volume Analysis and Forecast by Product, 2023 to 2033

        11.3.1. Dipstick

        11.3.2. Strips & Cards

        11.3.3. Cassettes

        11.3.4. Handheld POC Monitoring Devices

    11.4. Market Attractiveness Analysis by Product

12. Global Market Analysis 2012 to 2022 and Forecast 2023 to 2033, By Sample

    12.1. Introduction / Key Findings

    12.2. Historical Market Size (US$ Million) Analysis by Sample, 2012 to 2022

    12.3. Current and Future Market Size (US$ Million) Analysis and Forecast by Sample, 2023 to 2033

        12.3.1. Saliva

        12.3.2. Nasal Swabs

        12.3.3. Urine

        12.3.4. Blood

        12.3.5. Plasma

        12.3.6. Sweat

        12.3.7. Other Fluids

    12.4. Market Attractiveness Analysis by Product

13. Global Market Analysis 2012 to 2022 and Forecast 2023 to 2033, By End User

    13.1. Introduction / Key Findings

    13.2. Historical Market Size (US$ Million) Analysis by End User, 2012 to 2022

    13.3. Current and Future Market Size (US$ Million) Analysis and Forecast by End User, 2023 to 2033

        13.3.1. Hospitals

        13.3.2. Clinics

        13.3.3. Diagnostic Laboratories

        13.3.4. Home Care Settings

        13.3.5. Non-Government Organization

        13.3.6. Government & Federal Agencies

        13.3.7. Long-Term Care Centers

    13.4. Market Attractiveness Analysis by End User

14. Global Market Analysis 2012 to 2022 and Forecast 2023 to 2033, By Region

    14.1. Introduction / Key Findings

    14.2. Historical Market Size (US$ Million) and Volume (Units) Analysis by Region, 2012 to 2022

    14.3. Current and Future Market Size (US$ Million) and Volume (Units) Analysis and Forecast by Region, 2022-2032

        14.3.1. North America

        14.3.2. Latin America

        14.3.3. Europe

        14.3.4. South Asia

        14.3.5. East Asia

        14.3.6. Oceania

        14.3.7. Middle East & Africa

    14.4. Market Attractiveness Analysis by Country

15. North America Market Analysis 2012 to 2022 and Forecast 2023 to 2033

    15.1. Introduction

    15.2. Historical Market Size (US$ Million) and Volume (Units) Analysis by Market Taxonomy, 2012 to 2022

    15.3. Current and Future Market Size (US$ Million) and Volume (Units) Analysis and Forecast by Market Taxonomy, 2023 to 2033

        15.3.1. By Country

            15.3.1.1. USA   

            15.3.1.2. Canada

        15.3.2. By Test Type

        15.3.3. By Product

        15.3.4. By Sample

        15.3.5. By End User

    15.4. Market Attractiveness Analysis

        15.4.1. By Country

        15.4.2. By Test Type

        15.4.3. By Product

        15.4.4. By Sample

        15.4.5. By End User

    15.5. Market Trends

    15.6. Key Market Participants- Intensity Mapping

    15.7. Drivers & Restraints Impact Analysis

    15.8. Country-wise Analysis

        15.8.1. USA Market Analysis

            15.8.1.1. Introduction

            15.8.1.2. Market Analysis and Forecast by Market Taxonomy

                15.8.1.2.1. By Test Type

                15.8.1.2.2. By Product

                15.8.1.2.3. By Sample

                15.8.1.2.4. By End User

        15.8.2. Canada Market Analysis

            15.8.2.1. Introduction

            15.8.2.2. Market Analysis and Forecast by Market Taxonomy

                15.8.2.2.1. By Test Type

                15.8.2.2.2. By Product

                15.8.2.2.3. By Sample

                15.8.2.2.4. By End User

16. Latin America Market Analysis 2012 to 2022 and Forecast 2023 to 2033

    16.1. Introduction

    16.2. Historical Market Size (US$ Million) and Volume (Units) Analysis by Market Taxonomy, 2012 to 2022

    16.3. Current and Future Market Size (US$ Million) and Volume (Units) Analysis and Forecast by Market Taxonomy, 2023 to 2033

        16.3.1. By Country

            16.3.1.1. Brazil

            16.3.1.2. Mexico

            16.3.1.3. Argentina

        16.3.2. By Test Type

        16.3.3. By Product

        16.3.4. By Sample

        16.3.5. By End User

    16.4. Market Attractiveness Analysis

        16.4.1. By Country

        16.4.2. By Test Type

        16.4.3. By Product

        16.4.4. By Sample

        16.4.5. By End User

    16.5. Market Trends

    16.6. Key Market Participants- Intensity Mapping

    16.7. Drivers & Restraints Impact Analysis

    16.8. Country-wise Analysis

        16.8.1. Brazil Market Analysis

            16.8.1.1. Introduction

            16.8.1.2. Market Analysis and Forecast by Market Taxonomy

                16.8.1.2.1. By Test Type

                16.8.1.2.2. By Product

                16.8.1.2.3. By Sample

                16.8.1.2.4. By End User

        16.8.2. Mexico Market Analysis

            16.8.2.1. Introduction

            16.8.2.2. Market Analysis and Forecast by Market Taxonomy

                16.8.2.2.1. By Test Type

                16.8.2.2.2. By Product

                16.8.2.2.3. By Sample

                16.8.2.2.4. By End User

        16.8.3. Argentina Market Analysis

            16.8.3.1. Introduction

            16.8.3.2. Market Analysis and Forecast by Market Taxonomy

                16.8.3.2.1. By Test Type

                16.8.3.2.2. By Product

                16.8.3.2.3. By Sample

                16.8.3.2.4. By End User

17. Europe Market Analysis 2012 to 2022 and Forecast 2023 to 2033

    17.1. Introduction

    17.2. Historical Market Size (US$ Million) and Volume (Units) Analysis by Market Taxonomy, 2012 to 2022

    17.3. Current and Future Market Size (US$ Million) and Volume (Units) Analysis and Forecast by Market Taxonomy, 2023 to 2033

        17.3.1. By Country

            17.3.1.1. Germany

            17.3.1.2. Italy

            17.3.1.3. France

            17.3.1.4. UK

            17.3.1.5. Spain

            17.3.1.6. BENELUX

            17.3.1.7. Russia

        17.3.2. By Test Type

        17.3.3. By Product

        17.3.4. By Sample

        17.3.5. By End User

    17.4. Market Attractiveness Analysis

        17.4.1. By Country

        17.4.2. By Test Type

        17.4.3. By Product

        17.4.4. By Sample

        17.4.5. By End User

    17.5. Market Trends

    17.6. Key Market Participants- Intensity Mapping

    17.7. Drivers & Restraints Impact Analysis

    17.8. Country-wise Analysis

        17.8.1. Germany Market Analysis

            17.8.1.1. Introduction

            17.8.1.2. Market Analysis and Forecast by Market Taxonomy

                17.8.1.2.1. By Test Type

                17.8.1.2.2. By Product

                17.8.1.2.3. By Sample

                17.8.1.2.4. By End User

        17.8.2. Italy Market Analysis

            17.8.2.1. Introduction

            17.8.2.2. Market Analysis and Forecast by Market Taxonomy

                17.8.2.2.1. By Test Type

                17.8.2.2.2. By Product

                17.8.2.2.3. By Sample

                17.8.2.2.4. By End User

        17.8.3. France Market Analysis

            17.8.3.1. Introduction

            17.8.3.2. Market Analysis and Forecast by Market Taxonomy

                17.8.3.2.1. By Test Type

                17.8.3.2.2. By Product

                17.8.3.2.3. By Sample

                17.8.3.2.4. By End User

        17.8.4. UK Market Analysis

            17.8.4.1. Introduction

            17.8.4.2. Market Analysis and Forecast by Market Taxonomy

                17.8.4.2.1. By Test Type

                17.8.4.2.2. By Product

                17.8.4.2.3. By Sample

                17.8.4.2.4. By End User

        17.8.5. Spain Market Analysis

            17.8.5.1. Introduction

            17.8.5.2. Market Analysis and Forecast by Market Taxonomy

                17.8.5.2.1. By Test Type

                17.8.5.2.2. By Product

                17.8.5.2.3. By Sample

                17.8.5.2.4. By End User

        17.8.6. BENELUX Market Analysis

            17.8.6.1. Introduction

            17.8.6.2. Market Analysis and Forecast by Market Taxonomy

                17.8.6.2.1. By Test Type

                17.8.6.2.2. By Product

                17.8.6.2.3. By Sample

                17.8.6.2.4. By End User

        17.8.7. Russia Market Analysis

            17.8.7.1. Introduction

            17.8.7.2. Market Analysis and Forecast by Market Taxonomy

                17.8.7.2.1. By Test Type

                17.8.7.2.2. By Product

                17.8.7.2.3. By Sample

                17.8.7.2.4. By End User

18. South Asia Market Analysis 2012 to 2022 and Forecast 2023 to 2033

    18.1. Introduction

    18.2. Historical Market Size (US$ Million) and Volume (Units) Analysis by Market Taxonomy, 2012 to 2022

    18.3. Current and Future Market Size (US$ Million) and Volume (Units) Analysis and Forecast by Market Taxonomy, 2023 to 2033

        18.3.1. By Country

            18.3.1.1. India

            18.3.1.2. Indonesia

            18.3.1.3. Malaysia

            18.3.1.4. Thailand

            18.3.1.5. Rest of South Asia

        18.3.2. By Test Type

        18.3.3. By Product

        18.3.4. By Sample

        18.3.5. By End User

    18.4. Market Attractiveness Analysis

        18.4.1. By Country

        18.4.2. By Test Type

        18.4.3. By Product

        18.4.4. By Sample

        18.4.5. By End User

    18.5. Market Trends

    18.6. Key Market Participants- Intensity Mapping

    18.7. Drivers & Restraints Impact Analysis

    18.8. Country-wise Analysis

        18.8.1. India Market Analysis

            18.8.1.1. Introduction

            18.8.1.2. Market Analysis and Forecast by Market Taxonomy

                18.8.1.2.1. By Test Type

                18.8.1.2.2. By Product

                18.8.1.2.3. By Sample

                18.8.1.2.4. By End User

        18.8.2. Indonesia Market Analysis

            18.8.2.1. Introduction

            18.8.2.2. Market Analysis and Forecast by Market Taxonomy

                18.8.2.2.1. By Test Type

                18.8.2.2.2. By Product

                18.8.2.2.3. By Sample

                18.8.2.2.4. By End User

        18.8.3. Malaysia Market Analysis

            18.8.3.1. Introduction

            18.8.3.2. Market Analysis and Forecast by Market Taxonomy

                18.8.3.2.1. By Test Type

                18.8.3.2.2. By Product

                18.8.3.2.3. By Sample

                18.8.3.2.4. By End User

        18.8.4. Thailand Market Analysis

            18.8.4.1. Introduction

            18.8.4.2. Market Analysis and Forecast by Market Taxonomy

                18.8.4.2.1. By Test Type

                18.8.4.2.2. By Product

                18.8.4.2.3. By Sample

                18.8.4.2.4. By End User

19. East Asia Market Analysis 2012 to 2022 and Forecast 2023 to 2033

    19.1. Introduction

    19.2. Historical Market Size (US$ Million) and Volume (Units) Analysis by Market Taxonomy, 2012 to 2022

    19.3. Current and Future Market Size (US$ Million) and Volume (Units) Analysis and Forecast by Market Taxonomy, 2023 to 2033

        19.3.1. By Country

            19.3.1.1. China

            19.3.1.2. Japan

            19.3.1.3. South Korea

        19.3.2. By Test Type

        19.3.3. By Product

        19.3.4. By Sample

        19.3.5. By End User

    19.4. Market Attractiveness Analysis

        19.4.1. By Country

        19.4.2. By Test Type

        19.4.3. By Product

        19.4.4. By Sample

        19.4.5. By End User

    19.5. Market Trends

    19.6. Key Market Participants- Intensity Mapping

    19.7. Drivers & Restraints Impact Analysis

    19.8. Country-wise Analysis

        19.8.1. China Market Analysis

            19.8.1.1. Introduction

            19.8.1.2. Market Analysis and Forecast by Market Taxonomy

                19.8.1.2.1. By Test Type

                19.8.1.2.2. By Product

                19.8.1.2.3. By Sample

                19.8.1.2.4. By End User

        19.8.2. Japan Market Analysis

            19.8.2.1. Introduction

            19.8.2.2. Market Analysis and Forecast by Market Taxonomy

                19.8.2.2.1. By Test Type

                19.8.2.2.2. By Product

                19.8.2.2.3. By Sample

                19.8.2.2.4. By End User

        19.8.3. South Korea Market Analysis

            19.8.3.1. Introduction

            19.8.3.2. Market Analysis and Forecast by Market Taxonomy

                19.8.3.2.1. By Test Type

                19.8.3.2.2. By Product

                19.8.3.2.3. By Sample

                19.8.3.2.4. By End User

20. Oceania Market Analysis 2012 to 2022 and Forecast 2023 to 2033

    20.1. Introduction

    20.2. Historical Market Size (US$ Million) and Volume (Units) Analysis by Market Taxonomy, 2012 to 2022

    20.3. Current and Future Market Size (US$ Million) and Volume (Units) Analysis and Forecast by Market Taxonomy, 2023 to 2033

        20.3.1. By Country

            20.3.1.1. Australia

            20.3.1.2. New Zealand

        20.3.2. By Test Type

        20.3.3. By Product

        20.3.4. By Sample

        20.3.5. By End User

    20.4. Market Attractiveness Analysis

        20.4.1. By Country

        20.4.2. By Test Type

        20.4.3. By Product

        20.4.4. By Sample

        20.4.5. By End User

    20.5. Market Trends

    20.6. Key Market Participants- Intensity Mapping

    20.7. Drivers & Restraints Impact Analysis

    20.8. Country-wise Analysis

        20.8.1. Australia Market Analysis

            20.8.1.1. Introduction

            20.8.1.2. Market Analysis and Forecast by Market Taxonomy

                20.8.1.2.1. By Test Type

                20.8.1.2.2. By Product

                20.8.1.2.3. By Sample

                20.8.1.2.4. By End User

        20.8.2. New Zealand Market Analysis

            20.8.2.1. Introduction

            20.8.2.2. Market Analysis and Forecast by Market Taxonomy

                20.8.2.2.1. By Test Type

                20.8.2.2.2. By Product

                20.8.2.2.3. By Sample

                20.8.2.2.4. By End User

21. Middle East & Africa Market Analysis 2012 to 2022 and Forecast 2023 to 2033

    21.1. Introduction

    21.2. Historical Market Size (US$ Million) and Volume (Units) Analysis by Market Taxonomy, 2012 to 2022

    21.3. Current and Future Market Size (US$ Million) and Volume (Units) Analysis and Forecast by Market Taxonomy, 2023 to 2033

        21.3.1. By Country

            21.3.1.1. GCC Country

            21.3.1.2. Türkiye

            21.3.1.3. South Africa

            21.3.1.4. Rest of MEA

        21.3.2. By Test Type

        21.3.3. By Product

        21.3.4. By Sample

        21.3.5. By End User

    21.4. Market Attractiveness Analysis

        21.4.1. By Country

        21.4.2. By Test Type

        21.4.3. By Product

        21.4.4. By Sample

        21.4.5. By End User

    21.5. Market Trends

    21.6. Key Market Participants- Intensity Mapping

    21.7. Drivers & Restraints Impact Analysis

    21.8. Country-wise Analysis

        21.8.1. GCC Country Market Analysis

            21.8.1.1. Introduction

            21.8.1.2. Market Analysis and Forecast by Market Taxonomy

                21.8.1.2.1. By Test Type

                21.8.1.2.2. By Product

                21.8.1.2.3. By Sample

                21.8.1.2.4. By End User

        21.8.2. Türkiye Market Analysis

            21.8.2.1. Introduction

            21.8.2.2. Market Analysis and Forecast by Market Taxonomy

                21.8.2.2.1. By Test Type

                21.8.2.2.2. By Product

                21.8.2.2.3. By Sample

                21.8.2.2.4. By End User

        21.8.3. South Africa Market Analysis

            21.8.3.1. Introduction

            21.8.3.2. Market Analysis and Forecast by Market Taxonomy

                21.8.3.2.1. By Test Type

                21.8.3.2.2. By Product

                21.8.3.2.3. By Sample

                21.8.3.2.4. By End User

22. Market Structure Analysis

    22.1. Market Analysis by Tier of Companies

    22.2. Market Share Analysis of Top Players (%)

    22.3. Market Concentration

    22.4. Market Presence Analysis

23. Competition Analysis

    23.1. Competition Dashboard

    23.2. Key Development Analysis

    23.3. Branding and Promotional Strategies, By Key Players

    23.4. Competition Deep Dive

        23.4.1. F. Hoffmann-La Roche Ltd

            23.4.1.1. Overview

            23.4.1.2. Product Portfolio

            23.4.1.3. Key Financials

            23.4.1.4. SWOT Analysis

            23.4.1.5. Key Developments

            23.4.1.6. Sales Footprint

            23.4.1.7. Strategy Overview

                23.4.1.7.1. Marketing Strategy

                23.4.1.7.2. Product Strategy

                23.4.1.7.3. Channel Strategy

        23.4.2. Becton Dickinson & Company

            23.4.2.1. Overview

            23.4.2.2. Product Portfolio

            23.4.2.3. Key Financials

            23.4.2.4. SWOT Analysis

            23.4.2.5. Key Developments

            23.4.2.6. Sales Footprint

            23.4.2.7. Strategy Overview

                23.4.2.7.1. Marketing Strategy

                23.4.2.7.2. Product Strategy

                23.4.2.7.3. Channel Strategy

        23.4.3. Cepheid (Danaher)

            23.4.3.1. Overview

            23.4.3.2. Product Portfolio

            23.4.3.3. Key Financials

            23.4.3.4. SWOT Analysis

            23.4.3.5. Key Developments

            23.4.3.6. Sales Footprint

            23.4.3.7. Strategy Overview

                23.4.3.7.1. Marketing Strategy

                23.4.3.7.2. Product Strategy

                23.4.3.7.3. Channel Strategy

        23.4.4. Siemens Healthineers

            23.4.4.1. Overview

            23.4.4.2. Product Portfolio

            23.4.4.3. Key Financials

            23.4.4.4. SWOT Analysis

            23.4.4.5. Key Developments

            23.4.4.6. Sales Footprint

            23.4.4.7. Strategy Overview

                23.4.4.7.1. Marketing Strategy

                23.4.4.7.2. Product Strategy

                23.4.4.7.3. Channel Strategy

        23.4.5. Abbott

            23.4.5.1. Overview

            23.4.5.2. Product Portfolio

            23.4.5.3. Key Financials

            23.4.5.4. SWOT Analysis

            23.4.5.5. Key Developments

            23.4.5.6. Sales Footprint

            23.4.5.7. Strategy Overview

                23.4.5.7.1. Marketing Strategy

                23.4.5.7.2. Product Strategy

                23.4.5.7.3. Channel Strategy

        23.4.6. Diasorin S.p.a.

            23.4.6.1. Overview

            23.4.6.2. Product Portfolio

            23.4.6.3. Key Financials

            23.4.6.4. SWOT Analysis

            23.4.6.5. Key Developments

            23.4.6.6. Sales Footprint

            23.4.6.7. Strategy Overview

                23.4.6.7.1. Marketing Strategy

                23.4.6.7.2. Product Strategy

                23.4.6.7.3. Channel Strategy

        23.4.7. Thermo Fisher Scientific Inc.

            23.4.7.1. Overview

            23.4.7.2. Product Portfolio

            23.4.7.3. Key Financials

            23.4.7.4. SWOT Analysis

            23.4.7.5. Key Developments

            23.4.7.6. Sales Footprint

            23.4.7.7. Strategy Overview

                23.4.7.7.1. Marketing Strategy

                23.4.7.7.2. Product Strategy

                23.4.7.7.3. Channel Strategy

        23.4.8. Qiagen

            23.4.8.1. Overview

            23.4.8.2. Product Portfolio

            23.4.8.3. Key Financials

            23.4.8.4. SWOT Analysis

            23.4.8.5. Key Developments

            23.4.8.6. Sales Footprint

            23.4.8.7. Strategy Overview

                23.4.8.7.1. Marketing Strategy

                23.4.8.7.2. Product Strategy

                23.4.8.7.3. Channel Strategy

        23.4.9. BIOMÉRIEUX

            23.4.9.1. Overview

            23.4.9.2. Product Portfolio

            23.4.9.3. Key Financials

            23.4.9.4. SWOT Analysis

            23.4.9.5. Key Developments

            23.4.9.6. Sales Footprint

            23.4.9.7. Strategy Overview

                23.4.9.7.1. Marketing Strategy

                23.4.9.7.2. Product Strategy

                23.4.9.7.3. Channel Strategy

        23.4.10. Hologic Inc.

            23.4.10.1. Overview

            23.4.10.2. Product Portfolio

            23.4.10.3. Key Financials

            23.4.10.4. SWOT Analysis

            23.4.10.5. Key Developments

            23.4.10.6. Sales Footprint

            23.4.10.7. Strategy Overview

                23.4.10.7.1. Marketing Strategy

                23.4.10.7.2. Product Strategy

                23.4.10.7.3. Channel Strategy

        23.4.11. Bio Rad Laboratories

            23.4.11.1. Overview

            23.4.11.2. Product Portfolio

            23.4.11.3. Key Financials

            23.4.11.4. SWOT Analysis

            23.4.11.5. Key Developments

            23.4.11.6. Sales Footprint

            23.4.11.7. Strategy Overview

                23.4.11.7.1. Marketing Strategy

                23.4.11.7.2. Product Strategy

                23.4.11.7.3. Channel Strategy

        23.4.12. Quidel Corporation

            23.4.12.1. Overview

            23.4.12.2. Product Portfolio

            23.4.12.3. Key Financials

            23.4.12.4. SWOT Analysis

            23.4.12.5. Key Developments

            23.4.12.6. Sales Footprint

            23.4.12.7. Strategy Overview

                23.4.12.7.1. Marketing Strategy

                23.4.12.7.2. Product Strategy

                23.4.12.7.3. Channel Strategy

        23.4.13. EKF Diagnostics

            23.4.13.1. Overview

            23.4.13.2. Product Portfolio

            23.4.13.3. Key Financials

            23.4.13.4. SWOT Analysis

            23.4.13.5. Key Developments

            23.4.13.6. Sales Footprint

            23.4.13.7. Strategy Overview

                23.4.13.7.1. Marketing Strategy

                23.4.13.7.2. Product Strategy

                23.4.13.7.3. Channel Strategy

        23.4.14. SEKISUI Diagnostics

            23.4.14.1. Overview

            23.4.14.2. Product Portfolio

            23.4.14.3. Key Financials

            23.4.14.4. SWOT Analysis

            23.4.14.5. Key Developments

            23.4.14.6. Sales Footprint

            23.4.14.7. Strategy Overview

                23.4.14.7.1. Marketing Strategy

                23.4.14.7.2. Product Strategy

                23.4.14.7.3. Channel Strategy

        23.4.15. DiaSys-Diagnostic Systems GmbH

            23.4.15.1. Overview

            23.4.15.2. Product Portfolio

            23.4.15.3. Key Financials

            23.4.15.4. SWOT Analysis

            23.4.15.5. Key Developments

            23.4.15.6. Sales Footprint

            23.4.15.7. Strategy Overview

                23.4.15.7.1. Marketing Strategy

                23.4.15.7.2. Product Strategy

                23.4.15.7.3. Channel Strategy

        23.4.16. InBios International, Inc.

            23.4.16.1. Overview

            23.4.16.2. Product Portfolio

            23.4.16.3. Key Financials

            23.4.16.4. SWOT Analysis

            23.4.16.5. Key Developments

            23.4.16.6. Sales Footprint

            23.4.16.7. Strategy Overview

                23.4.16.7.1. Marketing Strategy

                23.4.16.7.2. Product Strategy

                23.4.16.7.3. Channel Strategy

        23.4.17. Jiangsu Mole Bioscience Co., Ltd.

            23.4.17.1. Overview

            23.4.17.2. Product Portfolio

            23.4.17.3. Key Financials

            23.4.17.4. SWOT Analysis

            23.4.17.5. Key Developments

            23.4.17.6. Sales Footprint

            23.4.17.7. Strategy Overview

                23.4.17.7.1. Marketing Strategy

                23.4.17.7.2. Product Strategy

                23.4.17.7.3. Channel Strategy

        23.4.18. ACON Laboratories, Inc.

            23.4.18.1. Overview

            23.4.18.2. Product Portfolio

            23.4.18.3. Key Financials

            23.4.18.4. SWOT Analysis

            23.4.18.5. Key Developments

            23.4.18.6. Sales Footprint

            23.4.18.7. Strategy Overview

                23.4.18.7.1. Marketing Strategy

                23.4.18.7.2. Product Strategy

                23.4.18.7.3. Channel Strategy

        23.4.19. Visby Medical, Inc.

            23.4.19.1. Overview

            23.4.19.2. Product Portfolio

            23.4.19.3. Key Financials

            23.4.19.4. SWOT Analysis

            23.4.19.5. Key Developments

            23.4.19.6. Sales Footprint

            23.4.19.7. Strategy Overview

                23.4.19.7.1. Marketing Strategy

                23.4.19.7.2. Product Strategy

                23.4.19.7.3. Channel Strategy

        23.4.20. UNIMA, INC.

            23.4.20.1. Overview

            23.4.20.2. Product Portfolio

            23.4.20.3. Key Financials

            23.4.20.4. SWOT Analysis

            23.4.20.5. Key Developments

            23.4.20.6. Sales Footprint

            23.4.20.7. Strategy Overview

                23.4.20.7.1. Marketing Strategy

                23.4.20.7.2. Product Strategy

                23.4.20.7.3. Channel Strategy

24. Assumptions and Acronyms Used

25. Research Methodology

Explore Healthcare Insights

View Reports
Future Market Insights

Point-of-Care Diagnostics Market

Schedule a Call