The Point-Of-Care Breathalyzer Market is estimated to be valued at USD 452.9 million in 2025 and is projected to reach USD 773.6 million by 2035, registering a compound annual growth rate (CAGR) of 5.5% over the forecast period.
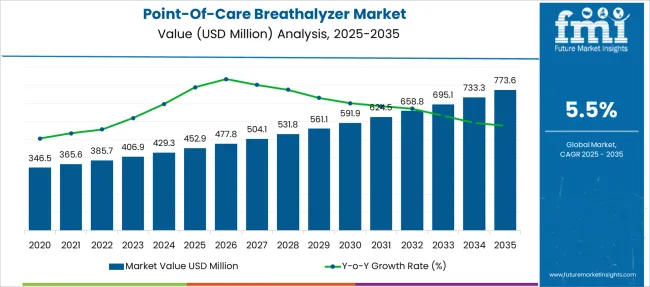
| Metric | Value |
|---|---|
| Point-Of-Care Breathalyzer Market Estimated Value in (2025 E) | USD 452.9 million |
| Point-Of-Care Breathalyzer Market Forecast Value in (2035 F) | USD 773.6 million |
| Forecast CAGR (2025 to 2035) | 5.5% |
The point-of-care breathalyzer market is witnessing measurable expansion due to increased demand for on-site alcohol testing, stringent transport safety regulations, and improvements in device portability and accuracy. Government mandates to reduce impaired driving incidents and enforce workplace sobriety standards have fueled procurement across transport, logistics, and law enforcement sectors.
Advancements in sensor calibration, digital readout accuracy, and tamper-resistant enclosures have enhanced device reliability, especially in high-frequency testing environments. Rising awareness around substance abuse management and its socio-economic costs is prompting broader institutional adoption.
Additionally, the introduction of lightweight, smartphone-compatible models and enhanced cloud data integration is enabling faster compliance and reporting workflows. The market is expected to benefit further from the standardization of alcohol monitoring policies, cross-border regulatory harmonization, and increased procurement within occupational health programs and public infrastructure systems.
The market is segmented by Product Type, Product Technology, and End-User and region. By Product Type, the market is divided into Handheld, Desktop, and Portable. In terms of Product Technology, the market is classified into Fuel-cell technology (Alcosensor III or IV), Chemical reaction (Breathalyzer), and Infrared Spectroscopy (Intoxilyzer). Based on End-User, the market is segmented into International and National transport systems, Rehabilitation centers, Government and private offices, Diagnostic centers, and Home care settings. Regionally, the market is classified into North America, Latin America, Western Europe, Eastern Europe, Balkan & Baltic Countries, Russia & Belarus, Central Asia, East Asia, South Asia & Pacific, and the Middle East & Africa.
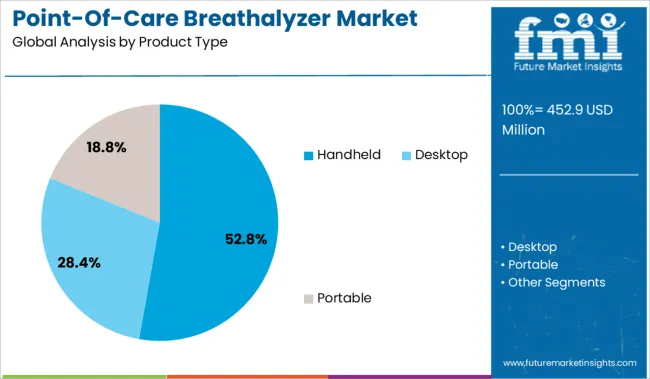
The handheld segment is projected to dominate the market with 52.8% of the total revenue share in 2025, positioning it as the leading product category. Growth in this segment is being driven by its convenience, portability, and ease of use in field conditions.
Handheld breathalyzers are favored by traffic enforcement units and workplace supervisors due to their compact design, quick response time, and minimal training requirements. Enhanced battery life, improved sensor precision, and real-time data display have improved operational efficiency during high-volume testing scenarios.
The segment is further benefiting from rising demand for non-invasive, on-the-go testing solutions that do not require elaborate setups. With handheld formats increasingly meeting industrial-grade performance standards, their adoption is being expanded across diverse use cases involving rapid, point-of-care alcohol screening.
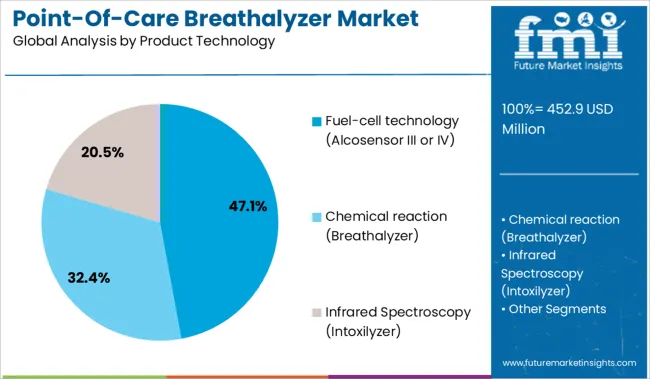
Fuel-cell-based breathalyzers especially those using platforms such as Alcosensor III or IV are expected to account for 47.1% of the total market revenue in 2025, making them the most widely adopted product technology. This leadership stems from the high specificity and accuracy of fuel-cell sensors in detecting ethanol, even at low concentrations.
Their low false-positive rate and stability over multiple tests have positioned them as the preferred technology for evidential and professional-grade testing. Unlike semiconductor sensors, fuel-cell variants are less influenced by external contaminants and environmental factors, providing consistent performance across various operating conditions.
Regulatory endorsements and certifications for legal admissibility have further bolstered confidence in their use among enforcement agencies and occupational health providers. As reliability and calibration consistency become increasingly critical, fuel-cell technology continues to be the benchmark for accuracy in point-of-care alcohol testing.
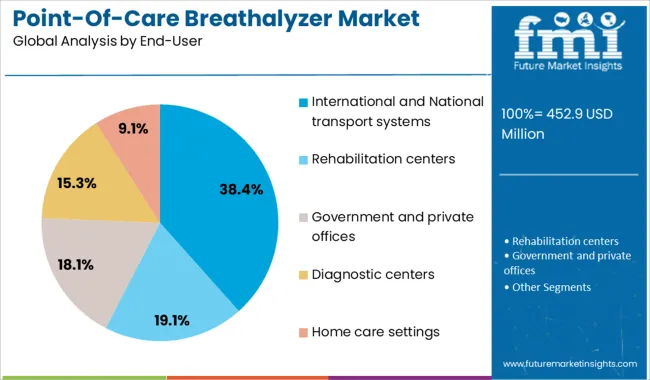
International and national transport systems are anticipated to represent 38.4% of the point-of-care breathalyzer market revenue in 2025, making them the leading end-user segment. This leadership is being shaped by strict regulatory oversight, zero-tolerance alcohol policies, and the growing emphasis on occupational safety within the logistics and public transit sectors.
Periodic breath testing of drivers, pilots, and maritime personnel has become institutionalized as part of fleet compliance programs. Transport authorities are investing in mobile breathalyzer units to conduct unannounced, on-site tests that minimize operational downtime while ensuring safety assurance.
The segment’s continued dominance is further driven by rising cross-border movement and harmonization of alcohol testing protocols across international jurisdictions. As fleet operators seek to maintain public trust and avoid liability risks, adoption of portable, point-of-care breathalyzers in transport ecosystems is expected to intensify.
Growing Alcohol Consumption to Drive the Growth of the Point-Of-Care Breathalyzer Market
Point-of-care Breathalyzer market has seen enormous growth due to its significant use to maintain safety, order, and discipline among the population. The major drivers for the point-of-care Breathalyzer market are an alarming increase in alcohol consumption seen at all age groups and also an increase in road accidents due to drunk driving.
The increasing alcohol and drug abuse, as well as increased drug testing awareness, are expected to drive demand for point-of-care breathalyzers.
Due to strict government regulations, drunk driving and alcohol abuse during work hours have led to an increase in demand for modern-use portable breathalyzers. The use of a personal portable breathalyzer to check for alcohol content within normal limits to keep a check on safe driving and productive working hours has given a drive for the point-of-care Breathalyzer market worldwide.
Moreover, the easy availability of personal Breathalyzers that can be ordered online according to one’s choice, has also been a factor to drive the point-of-care Breathalyzer market. Awareness initiative taken by the government has also led to an increase in market size for the point-of-care breathalyzer market.
High Cost of Product May Hamper the Market Growth
Although the point-of-care breathalyzer market has numerous end-uses, there are numerous obstacles that likely pose a challenge to market growth. The high cost of Breathalyzer and less market for new brands producing Breathalyzers were seen to hamper in the past but modern portable cheap Breathalyzer is taking over the point-of-care Breathalyzer market now.
The inability of a point-of-care breathalyzer to distinguish alcohol from other chemical compounds consisting of a methyl group structure is anticipated to impede the growth of the point-of-care breathalyzer market.
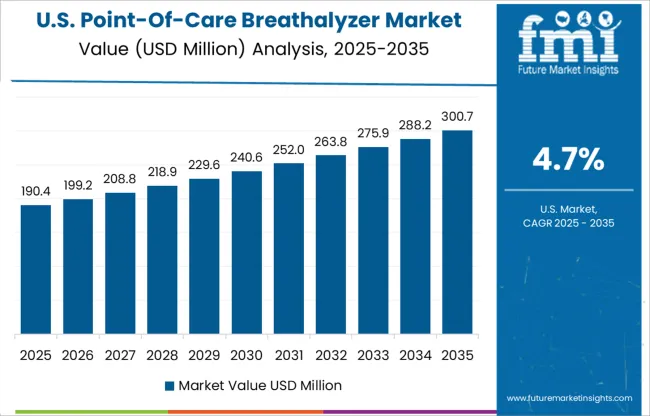
North America is likely to dominate the point-of-care breathalyzer market size by securing 35.6% of the share during the forecast period. Talking about the countries, the USA market is a prominent leader, contributing a significant share of the region.
Due to the rising demand for electronic breathalyzers, portable breathalyzers, and cannabis breathalyzers in the USA during the foreseen time. Moreover, the growing drunk & driving cases and the rising population are flourishing the USA point-of-care breathalyzer market share.
In addition, personal breathalyzers, intelligent market networking, and advanced technology are accelerating the demand for point-of-care breathalyzers in the USA. Although strict regulation and the adoption of point-of-care breathalyzers among traffic officers are flourishing, the USA point-of-care breathalyzer market growth.
The Europe point-of-care breathalyzer market is likely to secure 33.2% of the share globally during the forecast period. Increasing consumption of alcohol and stringent government laws for regular checking of alcohol during driving in the United Kingdom is surging the demand for a point-of-care breathalyzer. In addition, apart from the United Kingdom, the countries such as Germany, Spain, and France are anticipated to boost the market in the region.
Due to growing advanced technologies and the presence of numbers of key players in these counties advancing the market size in recent years. Moreover, increasing awareness and growing use of breathalyzers in detecting chronic and infectious diseases drive the USA point-of-care breathalyzer market growth during the forecast period.
During the forecast period, Japan is expected to be the fastest-growing country in the point-of-care breathalyzer market. Due to increasing demand for point-of-care breathalyzer by end-user industries such as healthcare, law enforcement & military, private workplace, and transport in Japan. In addition, the increasing use of alcohol testing devices by highway authorities propelled the Japan point-of-care breathalyzer market share during the forecast period.
On the other hand, growing awareness campaigns by Japan government and the rising adoption of a point-of-care breathalyzer in the mining & construction industries are flourishing the Japanese market size during the foreseen time.
The South Korean point-of-care breathalyzer market is growing by rising, measuring alcohol in an individual’s bloodstream in the healthcare sector. The device provides excellent and accurate data information about the patient’s health, which is likely to increase the South Korean market share during the forecast period. In addition, the growth of fuel cell technology in Japan is the prominent factor that accelerates the point-of-care breathalyzer market growth.
The manufacturers in Japan are making innovative devices by adopting this technology as per consumer demand during the forecast period. Due to the rising production of these devices, these key players are acquiring maximum output, which upsurges the market opportunities in Korea. Moreover, manufacturers are making efforts to launch new products which are likely to enhance the sales of point-of-care breathalyzers in the Korean market in recent years.
Increased Use of Breathalyzer in The Region to Drive the Market Growth
North America remains at the forefront of global demand for point-of-care breathalyzers. The promising growth of the North American market can be attributed to the burgeoning demand for electronic breathalyzers, cannabis breathalyzers, and portable breathalyzers in the region. North America is projected to account for 35.6% of the total market share in the point-of-care breathalyzer market during the assessment period.
Also, the highest population, increase in drunk driving road accidents, and strict law enforcement on alcohol. The use of personal breathalyzer, intelligent market networking, and advances in technology has led to the growth of the global market for point-of-care Breathalyzer.
Increasing awareness regarding the benefits of breathalyzers and the growing use of breathalyzers in the detection of chronic and infectious diseases drive market growth. Furthermore, the presence of key companies with a large market share is another factor fueling the sales of point-of-care breathalyzers in the region.
High Consumption of Alcoholic Beverages in The Region to Boost the Market Growth
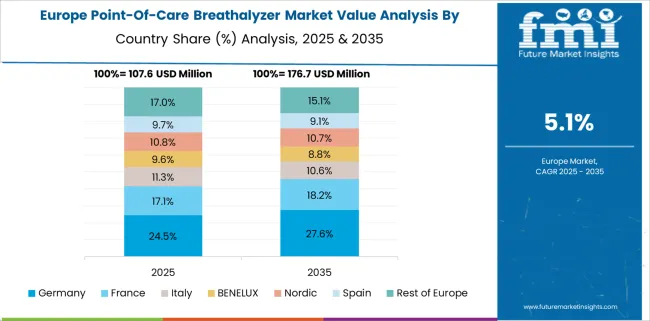
Europe holds a major market share in the point-of-care breathalyzers market mainly due to the high consumption of alcoholic beverages, and stringent laws for mandatory alcohol testing. Europe accounts for a total of 33.2% market share in the point-of-care breathalyzer market.
The rising sales of breathalyzer devices in Germany, increasing usage of passive breathalyzers in the United Kingdom, and rising demand for home-setting breathalyzers in France and Spain are all making a significant contribution to global market growth prospects for point-of-care breathalyzers. The technological advancements by the key market players in the region will also boost the growth of the market.
Asia-Pacific is expected to be the fastest-growing region in the point-of-care breathalyzer market during the forecast period. The growth of the market includes the increased demand for breathalyzers from the various end-user industries such as healthcare, law enforcement & military, government & private workplace, and transport.
The demand for point-of-care breathalyzers is increasing in transport due to the growing number of drunk driving accident cases. Rising government initiatives such as awareness campaigns regarding the availability of breathalyzers in the region are the prominent factors boosting the market growth.
Also, the increasing use of alcohol testing devices in the construction and mining sectors is expected to propel the growth of the point-of-care breathalyzer market in Asia-Pacific major economies.
The new entrants in the point-of-care breathalyzer market are continually indulging in several collaborations and highly investing in research and development activities to provide more convenient solutions to industry verticals. Some of the major start-ups that are leading the development of the market are- Applied System, Ultramind Technologies, and Precision Scientific Instrument Corporation.
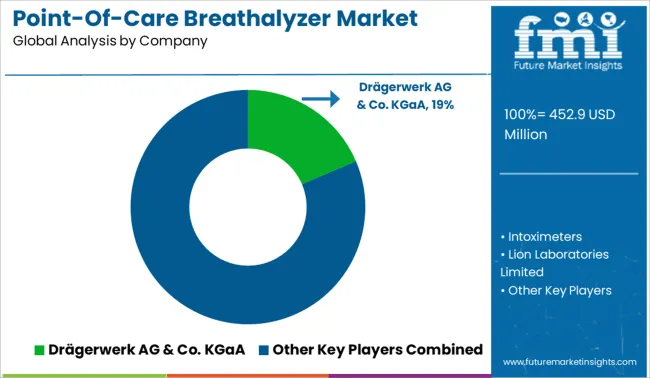
Some of the key participants present in the global point-of-care breathalyzer market include Drägerwerk AG & Co. KGaA, Intoximeters, Lion Laboratories Limited, Lifeloc Technologies, Inc., Inc., BACtrack, Quest Products, Inc., Alere, Inc., and C4 Development, Andatech Private Limited Ltd among others.
Attributed to the presence of such a high number of participants, the market is highly competitive. While global players such as Drägerwerk AG & Co. KGaA, Intoximeters, Lion Laboratories Limited, and Lifeloc Technologies, Inc., Inc., account for a considerable market size, several regional-level players are also operating across key growth regions, particularly in the Asia Pacific.
| Report Attribute | Details |
|---|---|
| Growth Rate | CAGR of 5.5% from 2025 to 2035 |
| Expected Market Value (2025) | USD 452.9 million |
| Anticipated Forecast Value (2035) | USD 773.6 million |
| Base Year for Estimation | 2024 |
| Historical Data | 2020 to 2024 |
| Forecast Period | 2025 to 2035 |
| Quantitative Units | Revenue in USD Billion, Volume in Kilotons, and CAGR from 2025 to 2035 |
| Report Coverage | Revenue Forecast, Volume Forecast, Company Ranking, Competitive Landscape, Growth Factors, Trends, and Pricing Analysis |
| Segments Covered | Product Type, Product Technology, End-User, Region |
| Regions Covered | North America; Latin America; Europe; Asia Pacific; Middle East and Africa |
| Key Countries Profiled | USA, Canada, Mexico, Brazil, Germany, Italy, France, United Kingdom, Spain, China, Japan, South Korea, Singapore, Thailand, Indonesia, Australia, NewZealand, GCC Countries, Southern Africa, Israel |
| Key Companies Profiled | Drägerwerk AG & Co. KGaA; Intoximeters; Lion Laboratories Limited; Lifeloc Technologies, Inc., Inc.; BACtrack, Quest Products, Inc.; Alere, Inc., and C4 Development; Andatech Private Limited Ltd. |
| Customization | Available Upon Request |
The global point-of-care breathalyzer market is estimated to be valued at USD 452.9 million in 2025.
The market size for the point-of-care breathalyzer market is projected to reach USD 773.6 million by 2035.
The point-of-care breathalyzer market is expected to grow at a 5.5% CAGR between 2025 and 2035.
The key product types in point-of-care breathalyzer market are handheld, desktop and portable.
In terms of product technology, fuel-cell technology (alcosensor iii or iv) segment to command 47.1% share in the point-of-care breathalyzer market in 2025.


Full Research Suite comprises of:
Market outlook & trends analysis
Interviews & case studies
Strategic recommendations
Vendor profiles & capabilities analysis
5-year forecasts
8 regions and 60+ country-level data splits
Market segment data splits
12 months of continuous data updates
DELIVERED AS:
PDF EXCEL ONLINE

Thank you!
You will receive an email from our Business Development Manager. Please be sure to check your SPAM/JUNK folder too.
Chat With
MaRIA