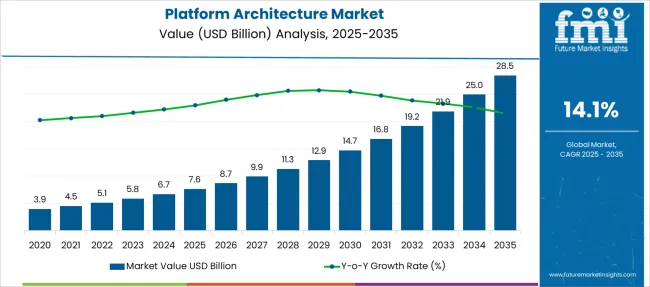
The Platform Architecture Market is estimated to be valued at USD 7.6 billion in 2025 and is projected to reach USD 28.5 billion by 2035, registering a compound annual growth rate (CAGR) of 14.1% over the forecast period.
| Metric | Value |
|---|---|
| Platform Architecture Market Estimated Value in (2025 E) | USD 7.6 billion |
| Platform Architecture Market Forecast Value in (2035 F) | USD 28.5 billion |
| Forecast CAGR (2025 to 2035) | 14.1% |
The platform architecture market is evolving rapidly, driven by digital transformation mandates, modernization of IT infrastructure, and the shift toward composable and scalable enterprise systems. Organizations are increasingly embracing decoupled architectures to support agility, real-time data exchange, and seamless integration across cloud-native ecosystems.
Enterprise demand for low-code platforms, container orchestration, and API-first frameworks is accelerating the adoption of modular architectures. In parallel, the convergence of DevOps, edge computing, and AI/ML is pushing vendors to innovate deployment pipelines and data flow orchestration within their platforms.
Investments from technology leaders and hyperscale cloud providers continue to shape the market landscape, fostering collaboration between platform developers and industry-specific solution integrators. As the need for operational resilience and application scalability intensifies, platform architecture is expected to play a foundational role in redefining software delivery, lifecycle management, and system interoperability across industries.
The market is segmented by Deployment Type, Services Type, and Verticals and region. By Deployment Type, the market is divided into Cloud-based and On-premise. In terms of Services Type, the market is classified into Software-as-a-service (SaaS) and Platform-as-a-service (PaaS). Based on Verticals, the market is segmented into IT & Telecom, Government, BFSI, Retail, and Manufacturing. Regionally, the market is classified into North America, Latin America, Western Europe, Eastern Europe, Balkan & Baltic Countries, Russia & Belarus, Central Asia, East Asia, South Asia & Pacific, and the Middle East & Africa.
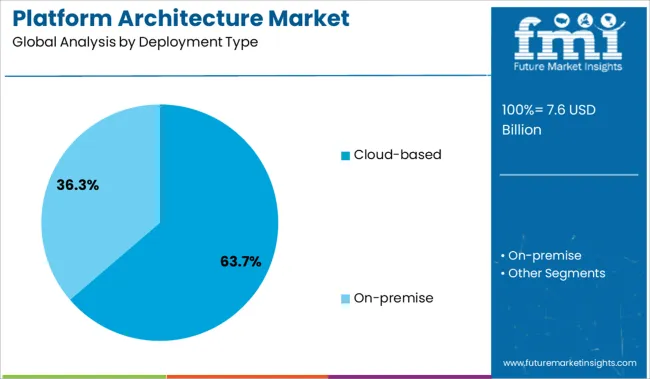
Cloud-based deployment is projected to lead the platform architecture market with a 63.7% revenue share in 2025. This leadership is being driven by the need for scalable, on-demand infrastructure that reduces capital expenditure while enhancing service agility.
The rise in multi-cloud strategies, combined with global access demands and workload portability, has shifted enterprise focus toward cloud-native architecture. Cloud-based deployments enable faster time-to-market, support CI/CD integration, and improve disaster recovery capabilities, making them ideal for dynamic and data-intensive applications.
Regulatory compliance and security features offered by cloud providers are also supporting increased adoption in both regulated and unregulated sectors. As digital-first business models continue to proliferate, cloud-native deployments are set to remain central to long-term enterprise architecture strategies.
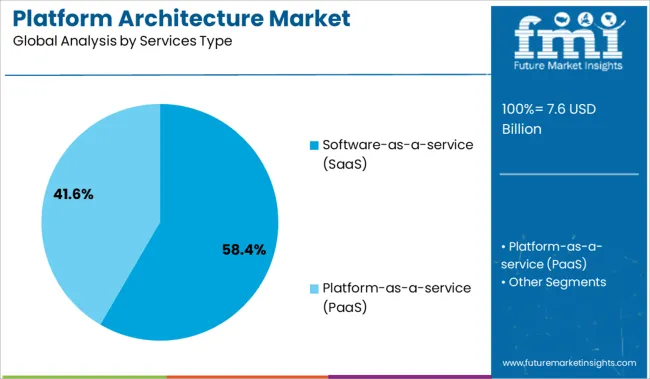
Software-as-a-service (SaaS) is anticipated to capture 58.4% of the total platform architecture market revenue in 2025, establishing it as the dominant services type. The convenience of subscription-based models, combined with automatic updates and lower IT management overhead, has made SaaS the preferred option for enterprises seeking flexibility and cost optimization.
Rapid adoption across enterprise functions including CRM, ERP, analytics, and collaboration tools has reinforced SaaS as the foundation for modular and composable architecture. Its ability to seamlessly integrate with APIs, microservices, and third-party applications supports highly interoperable system designs.
Furthermore, the scalability and ease of remote access provided by SaaS solutions have proven critical in hybrid and distributed work environments, accelerating their strategic value in platform-centric transformations.
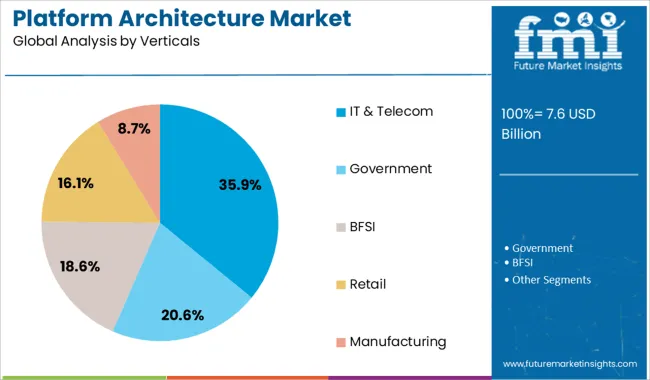
The IT & telecom sector is forecast to contribute 35.9% of the platform architecture market revenue in 2025, positioning it as the leading industry vertical. This growth is being driven by the sector’s demand for resilient, high-throughput digital infrastructure and the necessity to support evolving customer experiences across multiple digital channels.
With rising data traffic, cloud-native networking, and the rollout of 5G, IT & telecom operators are re-architecting legacy systems to enable containerization, orchestration, and real-time analytics. Platform-based strategies are increasingly adopted to manage OSS/BSS modernization, edge deployments, and network function virtualization (NFV).
As service providers prioritize automation and hyper-personalization, platform architecture is serving as a core enabler of both operational efficiency and service innovation.
The primary focus of major players is on enhancing their businesses and customer base through strategic partnerships. In addition, businesses opt for architectural services such as schematic designs, interior design, and space planning that help them attract more customers and enhance their stay experience. These factors are expected to drive the demand for platform architecture.
The need for green planning and architecture has gathered momentum, with a growing focus on energy-optimization technologies. Architects are making extensive efforts to come up with distinct designs that fit the needs of the industrial sector owing to the energy-intensive nature of the industrial sector which necessitates the recipient of distinct designs. This is estimated to contribute to global market growth.
In the healthcare sector, through the establishment of new facilities and the reorganization of existing spaces, hospitals are focused on improving patient care.
Hence, services such as construction and project management, and interior design are expected to witness significant demand, as it helps optimize space to seamlessly treat patients, improve patient outcomes, and increase patient satisfaction. Therefore, here the adoption of platform architecture is likely to be profitable.
Lack of skilled labor, resources and adequate knowledge regarding the operation and design of platform architecture is expected to be a major obstruction to market growth. Additionally, trying to develop a scalable architecture for an application can be a challenge for most providers.
Conversely, architects are able to save time and money while delivering high precision in design through the deployment of VR technology in architectural designs. Moreover, construction companies are now looking at firms that can manage and analyze the project life cycle along with providing design and advisory services. These new developments are anticipated to provide the scope of creativity for key providers.
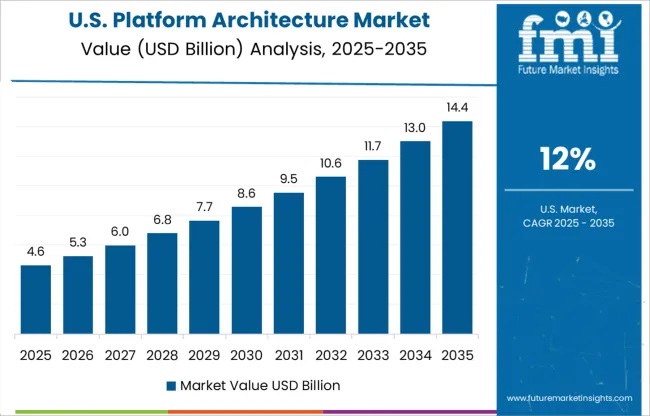
With a revenue of 28.3%, North America is the largest platform architecture market. The high demand for cloud and the Internet of Things (IoT) increases the importance of platform architecture in this region. Moreover, the adoption of platform architecture facilitates IoT fundamentals to be managed, built, and secured.
Hence, enterprises in the USA are introducing cloud platform architecture to facilitate the development and runtime of cloud applications through various services such as platform as a service (PaaS), creating lucrative growth opportunities.
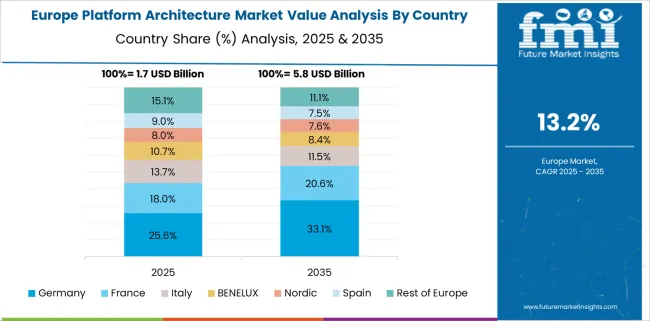
Europe currently holds the second-largest share of the platform architecture market, with a revenue of 20.4%. This is attributed to the flourishing construction sector in the IT sector in countries such as the United Kingdom and Germany, owing to new infrastructure development projects and rising investments.
Moreover, the gradual resumption of the construction of various data center facilities affected by temporary suspension due to the pandemic and the emergence of new IT projects are expected to revive the market for platform architectures.
Start-up companies in the platform architecture market share, are primarily focusing on incorporating advanced technologies such as AI, IoT, etc. to contribute to the market growth:
The platform architecture market share is bottom fragmented and top consolidated, which is attributed to the presence of some key players obtaining a major block of the market share. The players are often involved in opting for both organic and inorganic growth strategies to expand their geographical presence and their product portfolio.
A few of the latest developments in the platform architecture market are:
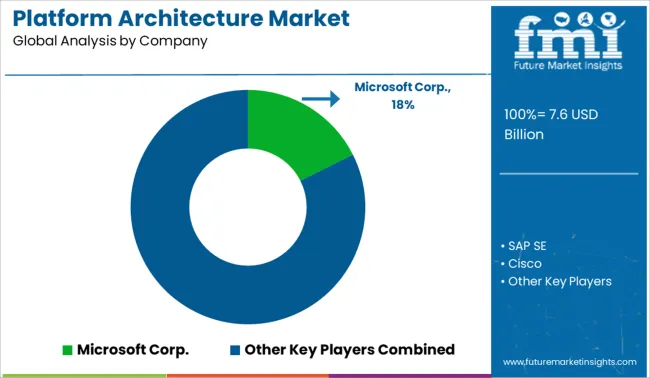
Other Market Players In The Platform Architecture Market:
| Report Attribute | Details |
|---|---|
| Growth Rate | CAGR of 4.6% from 2025 to 2035 |
| The base year for estimation | 2024 |
| Historical data | 2020 to 2024 |
| Forecast period | 2025 to 2035 |
| Quantitative units | Revenue in USD million and CAGR from 2025 to 2035 |
| Report Coverage | Revenue forecast, volume forecast, company ranking, competitive landscape, growth factors, and trends, Pricing Analysis, |
| Segments Covered | Deployment Type, Services Type, Verticals, and Region. |
| Regional scope | North America; Western; Europe Eastern Europe; Middle East; Africa; ASEAN; South Asia; Rest of Asia; Australia; and New Zealand |
| Country scope | USA, Canada, Mexico, Germany, United Kingdom, France, Italy, Spain, Russia, Belgium, Poland, Czech Republic, China, India, Japan, Australia, Brazil, Argentina, Colombia, Saudi Arabia, United Arab Emirates(UAE), Iran, South Africa |
| Key companies profiled | SAP SE; Cisco Systems Inc; IBI Group, Synopsys Inc; Microsoft Corp; Oracle Corporation; Nikken Sekkei Ltd; Perkins Eastman; IBM Corp; Jacobs Engineering Group; Apprenda Inc; RNF Technologies; Google Inc; DP Architects Pvt. Ltd; Foster + Partners. etc. |
| Customization scope | Free report customization (equivalent to up to 8 analysts' working days) with purchase. Addition or alteration to country, regional & segment scope. |
| Pricing and purchase options | Avail customized purchase options to meet your exact research needs. |
The global platform architecture market is estimated to be valued at USD 7.6 billion in 2025.
The market size for the platform architecture market is projected to reach USD 28.5 billion by 2035.
The platform architecture market is expected to grow at a 14.1% CAGR between 2025 and 2035.
The key product types in platform architecture market are cloud-based and on-premise.
In terms of services type, software-as-a-service (saas) segment to command 58.4% share in the platform architecture market in 2025.


Full Research Suite comprises of:
Market outlook & trends analysis
Interviews & case studies
Strategic recommendations
Vendor profiles & capabilities analysis
5-year forecasts
8 regions and 60+ country-level data splits
Market segment data splits
12 months of continuous data updates
DELIVERED AS:
PDF EXCEL ONLINE
Platform Lifts Market Size and Share Forecast Outlook 2025 to 2035
Platform Boots Market Trends - Growth & Industry Outlook to 2025 to 2035
Platform Shoes Market Trends - Demand & Forecast 2025 to 2035
Platform Trolley Market Growth – Trends & Forecast 2025 to 2035
AI Platform Market Size and Share Forecast Outlook 2025 to 2035
AI Platform Cloud Service Market Size and Share Forecast Outlook 2025 to 2035
Sales Platforms Software Market Size and Share Forecast Outlook 2025 to 2035
AIOps Platform Market Forecast and Outlook 2025 to 2035
Cross-Platform & Mobile Advertising Market Report – Growth 2018-2028
RevOps Platform Market Insights – Growth & Forecast 2023-2033
DataOps Platform Market Size and Share Forecast Outlook 2025 to 2035
Battery Platforms Market Analysis Size and Share Forecast Outlook 2025 to 2035
Trusted Platform Module (TPM) Market
Offshore Platform Electrification Market Size and Share Forecast Outlook 2025 to 2035
Coaching Platform Market Analysis - Size, Share, and Forecast Outlook 2025 to 2035
Agritech Platform Market Size and Share Forecast Outlook 2025 to 2035
Assessing Coaching Platform Market Share & Industry Trends
Vertical Platform Lift Market
AI Trading Platform Market Forecast Outlook 2025 to 2035
Smart City Platforms Market Size and Share Forecast Outlook 2025 to 2035

Thank you!
You will receive an email from our Business Development Manager. Please be sure to check your SPAM/JUNK folder too.
Chat With
MaRIA