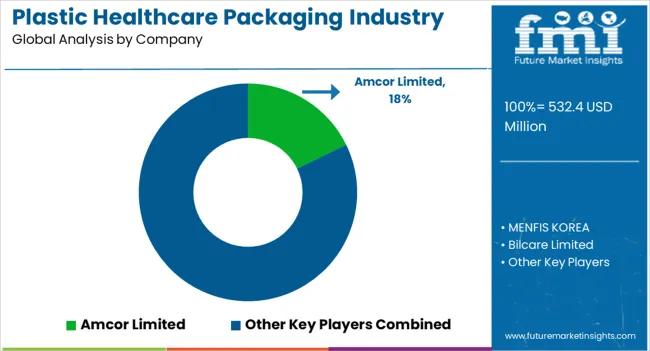
The Plastic Healthcare Packaging Industry Analysis in Korea is estimated to be valued at USD 532.4 million in 2025 and is projected to reach USD 870.1 million by 2035, registering a compound annual growth rate (CAGR) of 5.0% over the forecast period.
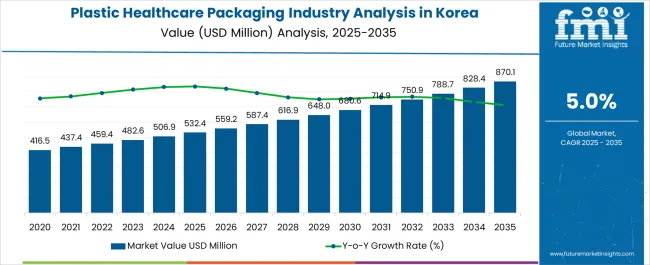
| Metric | Value |
|---|---|
| Plastic Healthcare Packaging Industry Analysis in Korea Estimated Value in (2025 E) | USD 532.4 million |
| Plastic Healthcare Packaging Industry Analysis in Korea Forecast Value in (2035 F) | USD 870.1 million |
| Forecast CAGR (2025 to 2035) | 5.0% |
The plastic healthcare packaging industry in Korea is experiencing steady growth. Rising demand for safe, reliable, and sustainable packaging solutions across pharmaceutical and biotechnology sectors is driving market expansion. Current market dynamics are characterized by increasing adoption of high-performance plastics, stringent regulatory requirements, and growing awareness of product safety and contamination prevention.
The future outlook is supported by continued investment in advanced manufacturing technologies, expansion of pharmaceutical production, and rising export-oriented healthcare activities. Growth rationale is anchored on the necessity for durable, lightweight, and tamper-evident packaging solutions that ensure product integrity and patient safety.
Innovations in material science, along with improvements in manufacturing efficiency and compliance with international quality standards, are expected to sustain market growth The convergence of regulatory support, industrial modernization, and increasing healthcare expenditure is reinforcing the adoption of plastic healthcare packaging, positioning the market for continued revenue expansion and technological advancement.
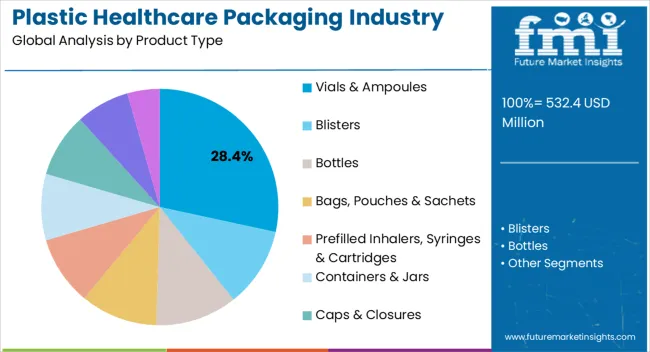
The vials and ampoules segment, accounting for 28.40% of the product type category, has been leading due to its critical role in safely storing and transporting liquid pharmaceuticals and injectable drugs. Its adoption has been supported by precision manufacturing capabilities, compliance with sterility standards, and ease of integration into automated filling and packaging lines.
Demand stability has been driven by consistent pharmaceutical production and increasing vaccination programs. Material innovations and improved barrier properties have enhanced product reliability and shelf life.
Strategic partnerships between packaging manufacturers and pharmaceutical companies have reinforced market penetration Continued technological upgrades, such as advanced molding techniques and ergonomic designs, are expected to sustain the segment’s market share and support adoption across both domestic and export markets.
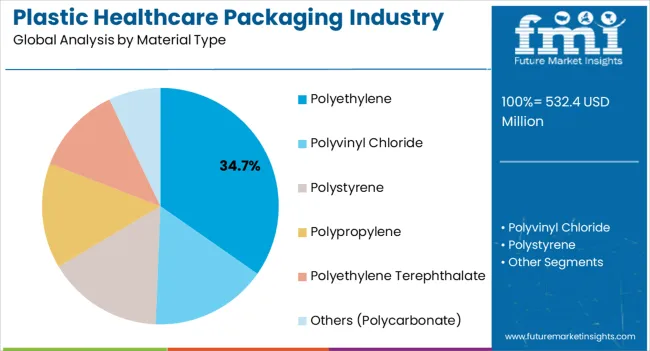
The polyethylene segment, holding 34.70% of the material type category, has maintained leadership due to its chemical resistance, flexibility, and cost-effectiveness. Adoption has been facilitated by the material’s compatibility with sterilization processes, ease of molding into complex shapes, and suitability for mass production.
Consistent supply and favorable mechanical properties have reinforced preference among manufacturers. Innovations in high-density and medical-grade polyethylene variants have enhanced safety and durability, supporting regulatory compliance.
Ongoing material research and development are expected to sustain segment share and provide opportunities for broader application across emerging healthcare packaging requirements.
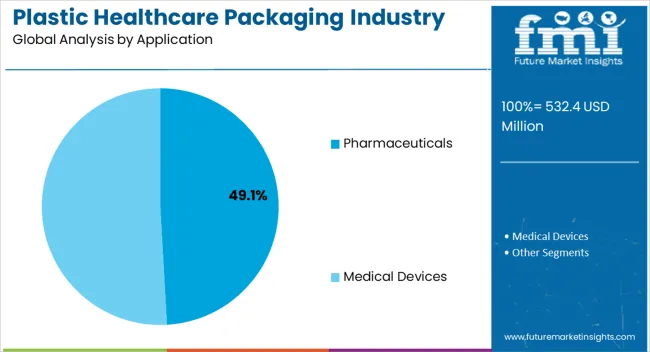
The pharmaceuticals segment, representing 49.10% of the application category, has been leading due to the critical requirement for secure and reliable packaging of drugs, vaccines, and biologics. Adoption has been driven by the expansion of pharmaceutical manufacturing and increasing patient access to medications.
Packaging solutions have been optimized for safety, traceability, and compliance with stringent Korean and international regulatory standards. Demand has been supported by growth in both domestic and export-oriented pharmaceutical production.
Technological advancements in packaging design, such as tamper-evident and child-resistant features, have reinforced market preference Continued focus on improving product integrity, distribution efficiency, and patient safety is expected to sustain the segment’s market share and drive further adoption.
Adopting sustainable packaging practices is a notable trend, aligning with global environmental concerns. The region’s healthcare packaging sector embraces technological advancements, incorporating innovative materials and manufacturing processes to enhance efficiency and product safety. Integrating e-commerce channels with plastic healthcare packaging solutions is shaping the distribution landscape. Regulatory compliance remains challenging, necessitating a strategic approach to navigate evolving standards. As South Gyeongsang contributes to Korea thriving healthcare packaging industry, the region stakeholders are actively addressing these trends and challenges to maintain a competitive edge.
A distinctive set of trends and challenges marks the plastic healthcare packaging industry in North Jeolla. The circular economy is gaining prominence, focusing on recyclable and reusable packaging solutions. The demand for personalized packaging, catering to diverse healthcare product needs, is rising. The region is at the forefront of digitalization and smart packaging integration, enhancing tracking capabilities and patient engagement.
Cost pressures pose a challenge, requiring a delicate balance between advanced packaging solutions and industry competitiveness. Harmonizing regulations within North Jeolla and across Korea is essential for ensuring standardized practices. Despite these challenges, North Jeolla commitment to innovation and sustainability positions it as a key player in Korea evolving plastic healthcare packaging landscape.
In 2025, composites hold a significant industrial share of 34.9% in the plastic healthcare packaging sector, showcasing a growing preference for lightweight and durable materials. Fixed load floor operation dominates with a substantial 56.8% share, indicating a prevalent trend towards standardized and non-adjustable load floor designs in the industry.
| Category | Industrial Share in 2025 |
|---|---|
| Polypropylene | 34.9% |
| Medical Devices | 56.8% |
With a substantial share of 34.9%, polypropylene plays a significant role in the plastic healthcare packaging industry. This versatile polymer is widely utilized for its favorable properties, durability, chemical resistance, and cost-effectiveness.
The substantial share indicates its prevalence in various packaging applications, contributing to the industry overall stability and functionality. Polypropylene dominance suggests a reliance on its favorable characteristics, such as the ability to withstand sterilization processes and provide a barrier against contaminants.
The exceptional share of 56.8% occupied by medical devices underscores their critical role in driving the plastic healthcare packaging industry. This high percentage signifies a robust demand for specialized packaging solutions tailored to the unique requirements of medical devices.
The medical devices category encompasses various products, from diagnostic tools to implantable devices, necessitating tailored and secure packaging. The significant share also reflects the industry alignment with the expanding healthcare sector and the continuous innovation in medical technology, further emphasizing the strategic importance of packaging in ensuring the safety and efficacy of medical devices.
| Attribute | Details |
|---|---|
| Estimated Industry Size in 2025 | USD 532.4 million |
| Projected Industry Size in 2035 | USD 870.1 million |
| Anticipated CAGR between 2025 to 2035 | 5.0% CAGR |
| Demand Forecast for the Plastic Healthcare Packaging Industry in Korea | 2025 to 2035 |
| Report Coverage | Industry Size, Industry Trends, Analysis of key factors influencing the Plastic Healthcare Packaging Industry in Korea, Insights on Global Players and their Industry Strategy in Korea, Ecosystem Analysis of Local and Regional Korea Providers |
| Key Provinces Analyzed | South Gyeongsang; North Jeolla; South Jeolla; Jeju; Rest of Korea |
| Key Companies Profiled | MENFIS KOREA; Bilcare Limited; Gerresheimer AG; Amcor Limited; Constantia Flexibles Group; Wipak Ltd; Comar LLC; West Rock Company; Aptar Group; West Rock Company |
The global plastic healthcare packaging industry analysis in Korea is estimated to be valued at USD 532.4 million in 2025.
The market size for the plastic healthcare packaging industry analysis in Korea is projected to reach USD 872.6 million by 2035.
The plastic healthcare packaging industry analysis in Korea is expected to grow at a 5.1% CAGR between 2025 and 2035.
The key product types in plastic healthcare packaging industry analysis in Korea are vials & ampoules, blisters, bottles, _dropper bottles, _nasal spray bottles, _liquid bottles, bags, pouches & sachets, _iv bags, _medical specialty bags, prefilled inhalers, syringes & cartridges, containers & jars, caps & closures, trays and medication tubes.
In terms of material type, polyethylene segment to command 34.7% share in the plastic healthcare packaging industry analysis in Korea in 2025.


Full Research Suite comprises of:
Market outlook & trends analysis
Interviews & case studies
Strategic recommendations
Vendor profiles & capabilities analysis
5-year forecasts
8 regions and 60+ country-level data splits
Market segment data splits
12 months of continuous data updates
DELIVERED AS:
PDF EXCEL ONLINE
Plastic Cases Market Size and Share Forecast Outlook 2025 to 2035
Plastic Cutlery Market Forecast and Outlook 2025 to 2035
Plastic Vial Market Forecast and Outlook 2025 to 2035
Plastic Tube Market Forecast and Outlook 2025 to 2035
Plastic Hot and Cold Pipe Market Forecast and Outlook 2025 to 2035
Plastic Retort Can Market Size and Share Forecast Outlook 2025 to 2035
Plastic Gears Market Size and Share Forecast Outlook 2025 to 2035
Plastic Additive Market Size and Share Forecast Outlook 2025 to 2035
Plastic Market Size and Share Forecast Outlook 2025 to 2035
Plastic Vials and Ampoules Market Size and Share Forecast Outlook 2025 to 2035
Plastic Bottles Market Size and Share Forecast Outlook 2025 to 2035
Plastic Rigid IBC Market Size and Share Forecast Outlook 2025 to 2035
Plastic Bag Market Size and Share Forecast Outlook 2025 to 2035
Plastic Dielectric Films Market Size and Share Forecast Outlook 2025 to 2035
Plastic Crates Market Size and Share Forecast Outlook 2025 to 2035
Plastic Transistors Market Size and Share Forecast Outlook 2025 to 2035
Plastic Pallets Market Size and Share Forecast Outlook 2025 to 2035
Plastics-To-Fuel (PTF) Market Size and Share Forecast Outlook 2025 to 2035
Plastic Tumblers Market Size and Share Forecast Outlook 2025 to 2035
Plastic Fillers Market Size and Share Forecast Outlook 2025 to 2035

Thank you!
You will receive an email from our Business Development Manager. Please be sure to check your SPAM/JUNK folder too.
Chat With
MaRIA