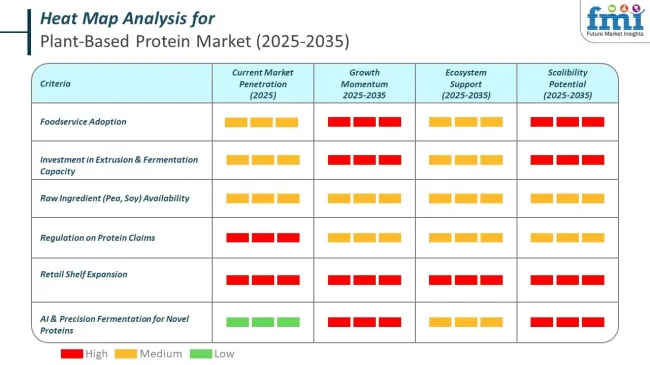
Plant-Based Protein Market Size and Share Forecast Outlook 2025 to 2035

The global plant-based protein market is projected to grow from USD 20.3 billion in 2025 to USD 46 billion by 2035, registering a CAGR of 8.5%.
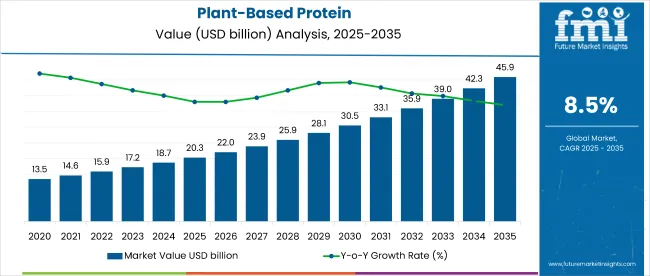
Quick Stats - Plant-Based Protein Market

  • Market Value (2025): USD 20.3 billion
  • Forecast Value (2035): USD 46 billion
  • Forecast CAGR: 8.5%
  • Form Leader in 2025: Isolates (41.2% market share)
  • Nature Segment Leader: Conventional (78.3% share)
  • Key Growth Region: East Asia (Japan is the fastest-growing market with a 9.1% CAGR)

Plant Based Protein Market

Metric Value
Industry Size (2025E) USD 20.3 billion
Industry Value (2035F) USD 46 billion
CAGR (2025 to 2035) 8.5%

Growth in this market is being driven by the rising global shift toward sustainable, ethical, and clean-label dietary choices. Increasing awareness about environmental impact, animal welfare, and health benefits is accelerating the adoption of plant-based proteins across the food & beverage, sports nutrition, and convenience food sectors.

The market holds 1.9% of the global food & beverage market and around 23.4% of the protein ingredients market. It contributes nearly 11.8% to the functional food sector and accounts for 7.0% of the meat alternatives market. In the sports nutrition segment, its share stands at 9%, while it represents 6.3% of the global dietary supplements market. Within the vegan food category, it captures over 30%, owing to its essential role in core formulations. Despite being niche in the clean-label ingredients space, it holds a growing share of around 4.5%, fueled by clean, plant-forward product demand.

The market is strongly influenced by evolving regulatory standards favoring non-GMO, organic, and clean-label certifications. Governments in regions like the USA, EU, and India are actively encouraging plant-based food innovation through agricultural policies, sustainability initiatives, and health-forward food guidelines. At the same time, industry-wide alignment with ESG frameworks, transparent supply chains, and low-carbon processing is shaping product development and marketing strategies, further strengthening the credibility and appeal of plant-based proteins.

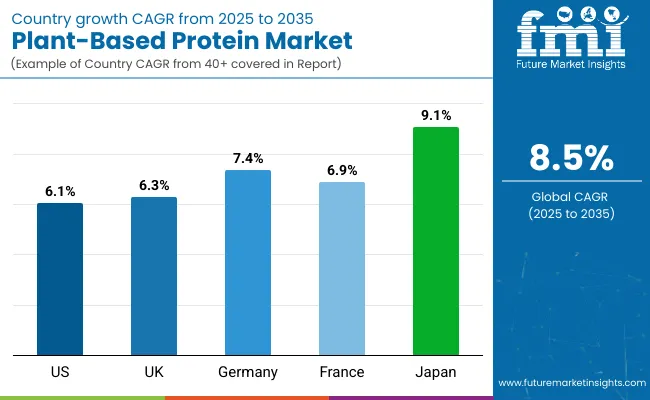
Japan is anticipated to be the fastest-growing market in the global plant-based protein industry, registering a CAGR of 9.1% from 2025 to 2035. Isolates will dominate the form segment, accounting for a 41.2% market share in 2025, while by, conventional plant-based proteins will lead the nature segment with a commanding 78.3% share. The USA and UK markets are also expected to witness steady growth, expected to expand at CAGRs of 6.1% and 6.3% respectively.

Plant-Based Protein Market Analysis by Top Investment Segments

The market is segmented by product type, form, end use, nature, and region. By product type, the market includes soy protein, wheat protein, pea protein, and others (rice, hemp, chickpea, lentil). By form, the market is segmented into isolates, concentrates, and hydrolysates.

Based on end use, the market is divided into nutritional products, sports nutrition, medical nutrition, infant nutrition, bakery, ready-to-eat, snacks & cereals, dairy, confectionary and dessert, convenience food, beverages, animal feed, and others (meat substitutes, functional foods, soups & sauces, pet nutrition). By nature, the market divided into organic and conventional. By region, the market is segmented into North America, Latin America, Europe, East Asia, South Asia, Oceania, and the Middle East & Africa.
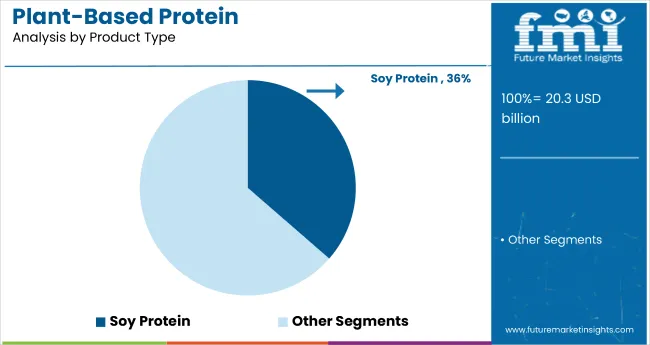
Soy Protein to Lead the Product Type Segment with 36.4% Market Share in 2025

Plant Based Protein Analysis By Product Type

Soy protein is expected to dominate the product type segment, accounting for 36.4% of the total market share in 2025. Its strong position is driven by widespread use in meat alternatives, dairy substitutes, and nutritional supplements.
  • High protein content, complete amino acid profile, and wide consumer acceptance boost soy’s application across food and beverage industries.
  • Major players like ADM and Cargill continue expanding soy-based offerings to meet global plant-based protein demand.

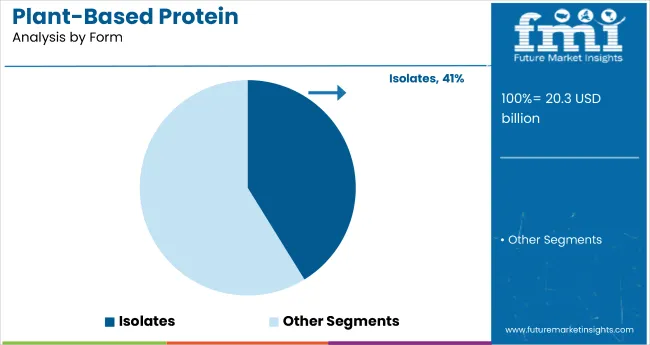
Isolates to Dominate the Form Segment with 41.2% Market Share in 2025

Plant Based Protein Analysis By Form

Isolates are projected to hold a 41.2% share of the form segment in 2025, favored for their high protein concentration and broad functional versatility.
  • Isolates are widely used in sports nutrition, infant formulas, and functional beverages due to their purity and digestibility.
  • Manufacturers prioritize isolates for clean-label, high-performance food products with minimal additives.

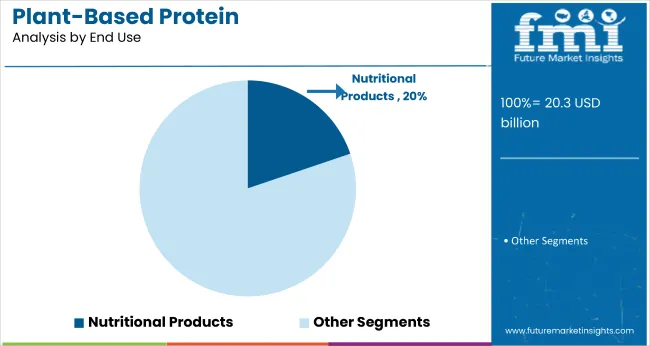
Nutritional Products to Lead the End Use Segment with 19.8% Market Share in 2025

Plant Based Protein Analysis By End Use

Nutritional products are projected to lead the end-use segment, capturing 19.8% of the global market share in 2025, reflecting strong demand from health-conscious consumers.
  • Used in protein powders, bars, and dietary supplements for athletes and wellness users.
  • Rising consumer interest in preventive health and natural ingredients boosts market penetration.

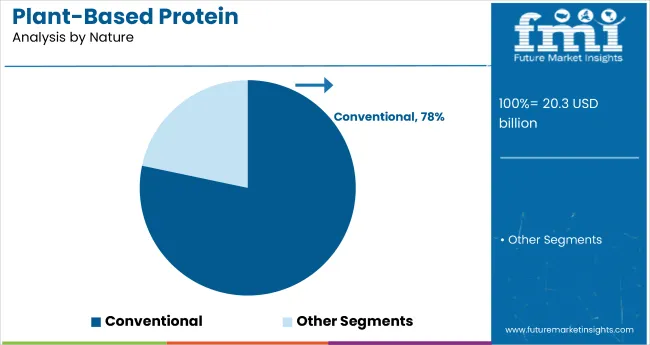
Conventional to Maintain Dominance in Nature Segment with 78.3% Market Share in 2025

Plant Based Protein Analysis By Nature

Conventional is forecast to dominate with a 78.3% market share in 2025 due to broader availability and lower cost compared to organic alternatives.

  • Preferred by large-scale food manufacturers due to consistent supply chains.
  • Economies of scale and mature processing technologies support wide adoption.

Top Plant-Based Protein Market Dynamics

The global plant-based protein market is witnessing robust growth, driven by rising consumer awareness around health, sustainability, and ethical food choices. Increasing demand for clean-label and allergen-free alternatives is accelerating adoption across food, beverage, sports nutrition, and personal care sectors.

Recent Trends in the Plant-Based Protein Market

  • Food manufacturers are developing hybrid products that combine plant-based and cultured or precision-fermented ingredients to improve sensory appeal and nutritional value.
  • Advancements in protein extraction and fermentation technologies are enabling better functional profiles and reducing off-notes associated with certain plant sources.

Challenges in the Plant-Based Protein Market
  • Price volatility of raw materials, such as peas, soy, and fava beans, due to climate change and geopolitical instability, can disrupt production and pricing strategies.
  • Digestibility issues and allergenicity in certain protein types, like soy and wheat, pose formulation challenges and limit usage among sensitive consumer groups.

Top Countries Manufacturing, Utilizing, and Supplying Plant-Based Proteins

Country Wise Analysis Of Plant Based Protein Market

Among the top five countries, Japan is projected to witness the fastest growth in the market with a CAGR of 9.1% from 2025 to 2035, driven by technological innovation in food processing and increased consumer demand for functional foods. Germany and France follow with CAGRs of 7.4% and 6.9%, respectively, supported by clean-label demand and a strong vegetarian consumer base.

The UK is expected to grow at a CAGR of 6.3%, with growth fueled by flexitarian diets and sustainability awareness. The USA remains the largest contributor by value but will expand at a relatively steady CAGR of 6.1% over the forecast period.

The report offers a comprehensive analysis across 40+ countries; five top-performing OECD countries are highlighted below.

In-depth Analysis of Plant-Based Protein Demand in USA

The USA plant-based protein market is projected to grow at a CAGR of 6.1% between 2025 and 2035, supported by strong consumer demand for clean-label, sustainable, and allergen-free food alternatives. Food and beverage giants are actively investing in plant-based innovation, particularly within ready-to-eat and nutritional products.

  • Growth led by sports nutrition and RTD beverages using pea and soy isolates.
  • High innovation levels in protein hydrolysates for medical and senior nutrition.

Growth Outlook for Plant-Based Protein in UK

The plant-based protein market in the UK is expected to grow at a CAGR of 6.3% over the next decade. The country has a rising population of flexitarians and vegans, supported by government nutrition initiatives and climate change mitigation efforts.

  • Demand driven by bakery, ready meals, and meat alternatives.
  • Growth in wheat and pea protein demand for local sourcing and allergen concerns.

Germany Plant-Based Protein Sales Analysis

The Germany plant-based protein revenue is forecasted to expand at a CAGR of 7.4% from 2025 to 2035. A strong base of vegetarian and environmentally conscious consumers is encouraging food producers to innovate across bakery, dairy alternatives, and snack categories.

  • Market growth supported by public funding in plant protein R&D.
  • High penetration of pea and wheat proteins in cereal and snack products.

France Plant-Based Protein Demand Outlook

The French plant-based protein market is projected to grow at a steady CAGR of 6.9% between 2025 and 2035. Local food heritage and increasing interest in health-centric diets are shifting demand toward plant proteins in bakery, dairy-free, and infant nutrition applications.

  • Pulse-based proteins like lentil and fava gaining traction in native formulations.
  • Nutritional products and beverages are emerging high-growth segments.

Japan Plant-Based Protein Industry Analysis

The Japan plant-based protein revenue is expected to register a robust CAGR of 9.1% during the forecast period. Innovation in fermented proteins, soy-based ingredients, and functional foods are driving adoption among health-conscious and aging consumers.
  • Increased use of soy isolates and hydrolysates in senior and medical nutrition.
  • Growth in convenience foods and protein-fortified snacks.

Leading Plant-Based Protein Suppliers

Plant Based Protein Analysis By Company

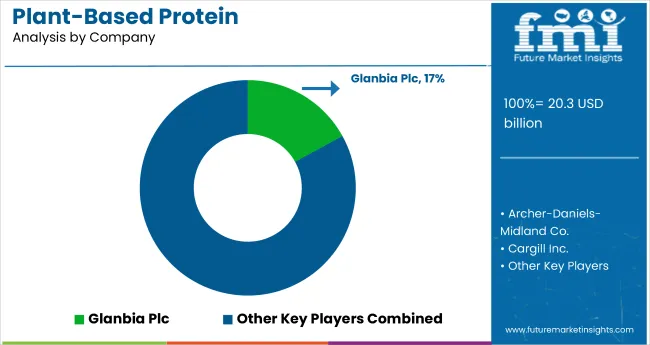
The market is moderately consolidated, with both global food ingredient giants and specialized protein innovators shaping competition. Leading suppliers such as Glanbia Plc, Archer-Daniels-Midland Co., Cargill Inc., and Kerry Inc. are driving market expansion through extensive product portfolios, strong distribution networks, and advanced R&D capabilities. These Tier-1 players are investing heavily in sustainable protein extraction technologies and offering customized formulations to serve the growing demand across functional foods, beverages, sports nutrition, and meat alternatives.

Strategic initiatives include the introduction of new plant sources (such as chickpea, lentil, and fava), clean-label formulations, and expansion in high-growth markets like Asia and Latin America. Burcon NutraScience Corporation and E.I. du Pont de Nemours & Co. are focusing on precision fermentation and protein texturization technologies to meet demand for meat and dairy alternatives.

Roquette Frères, Cosucra Groupe Warcoing, and Royal Avebe UA continue to dominate in Europe through locally sourced non-GMO proteins and clean processing standards. USA-based players like NOW Foods, Ingredion Inc., and CHS Inc. are enhancing their supply chain transparency and expanding retail presence via private label and direct-to-consumer platforms.

Recent Plant-Based Protein Industry News

  • In November 2024, Ingredion and Lantmännen entered a long-term collaboration to supply the European market with high-quality pea protein isolates. The partnership focuses on sales, product innovation, and process improvement across food and ingredient applications.
  • In November 2024, BENEO showcased scalable solutions to accelerate hybrid and plant-based product development using Meatless® texturates and faba bean protein. The approach simplifies processing while supporting taste, texture, and cost optimization across the value chain.

Plant-Based Protein Market Report Scope

Report Attributes Details
Current Total Market Size (2025) USD 20.3 billion
Projected Market Size (2035) USD 46 billion
CAGR (2025 to 2035) 8.5%
Base Year for Estimation 2024
Historical Period 2020 to 2024
Projections Period 2025 to 2035
Market Analysis Parameters Revenue in USD billion / Volume in metric tons
By Product Type Soy Protein, Wheat Protein, Pea Protein, and Others (Rice, Hemp, Chickpea, Lentil)
By Form Isolates, Concentrates, and Hydrolysates
By End Use Nutritional Products, Sports Nutrition, Medical Nutrition, Infant Nutrition, Bakery, Ready-to-Eat, Snacks & Cereals, Dairy, Confectionery and Dessert, Convenience Food, Beverages, Animal Feed, and Others (Meat Substitutes, Functional Foods, Soups & Sauces, Pet Nutrition)
By Nature Organic and Conventional
Regions Covered North America, Latin America, Europe, East Asia, South Asia, Oceania, Middle East & Africa
Countries Covered United States, United Kingdom, Germany, France, China, Japan, South Korea, Brazil, India, Australia
Key Players Glanbia Plc., Archer-Daniels-Midland Co., Cargill Inc., Kerry Inc., Burcon NutraScience Corporation, E.I. du Pont de Nemours & Co., Royal Avebe UA, Cosucra Groupe Warcoing, Ingredion Inc., Corbion, Tate & Lyle Plc., CHS Inc., Roquette Frères, AGT Food & Ingredients Inc., Now Food
Additional Attributes Dollar sales by value, market share analysis by region, and country-wise analysis

Key Segments

By Product Type:

The industry analysis explored through product types like Soy Protein, Wheat Protein, Pea Protein, Others

By Form:

Verities of forms like Isolates, Concentrates and Hydrolysates are included in the report

By Nature:

By nature segment industry has been categorised into Organic and Conventional

By End Use:

End use applications like Nutritional Products, Sports Nutrition, Medical Nutrition, Infant Nutrition, Bakery, Ready-to-eat, Snacks & Cereals, Dairy, Confectionary and Dessert, Convenience Food, Beverages, Animal Feed and Others

By Region:

Industry analysis has been carried out in key countries of North America, Latin America, Europe, Middle East and Africa, East Asia, South Asia, and Oceania

Table of Content

  1. Executive Summary
    • Global Market Outlook
    • Demand-side Trends
    • Supply-side Trends
    • Technology Roadmap Analysis
    • Analysis and Recommendations
  2. Market Overview
    • Market Coverage / Taxonomy
    • Market Definition / Scope / Limitations
  3. Market Background
    • Market Dynamics
      • Drivers
      • Restraints
      • Opportunity
      • Trends
    • Scenario Forecast
      • Demand in Optimistic Scenario
      • Demand in Likely Scenario
      • Demand in Conservative Scenario
    • Opportunity Map Analysis
    • Product Life Cycle Analysis
    • Supply Chain Analysis
      • Supply Side Participants and their Roles
        • Producers
        • Mid-Level Participants (Traders/ Agents/ Brokers)
        • Wholesalers and Distributors
      • Value Added and Value Created at Node in the Supply Chain
      • List of Raw Material Suppliers
      • List of Existing and Potential Buyer’s
    • Investment Feasibility Matrix
    • Value Chain Analysis
      • Profit Margin Analysis
      • Wholesalers and Distributors
      • Retailers
    • PESTLE and Porter’s Analysis
    • Regulatory Landscape
      • By Key Regions
      • By Key Countries
    • Regional Parent Market Outlook
    • Production and Consumption Statistics
    • Import and Export Statistics
  4. Global Market Analysis 2020 to 2024 and Forecast, 2025 to 2035
    • Historical Market Size Value (USD Billion) & Volume (Metric Tons) Analysis, 2020 to 2024
    • Current and Future Market Size Value (USD Billion) & Volume (Metric Tons) Projections, 2025 to 2035
      • Y-o-Y Growth Trend Analysis
      • Absolute $ Opportunity Analysis
  5. Global Market Pricing Analysis 2020 to 2024 and Forecast 2025 to 2035
  6. Global Market Analysis 2020 to 2024 and Forecast 2025 to 2035, By Product Type
    • Introduction / Key Findings
    • Historical Market Size Value (USD Billion) & Volume (Metric Tons) Analysis By Product Type, 2020 to 2024
    • Current and Future Market Size Value (USD Billion) & Volume (Metric Tons) Analysis and Forecast By Product Type, 2025 to 2035
      • Soy Protein
      • Wheat Protein
      • Pea Protein
      • Others (Rice, Hemp, Chickpea, Lentil)
    • Y-o-Y Growth Trend Analysis By Product Type, 2020 to 2024
    • Absolute $ Opportunity Analysis By Product Type, 2025 to 2035
  7. Global Market Analysis 2020 to 2024 and Forecast 2025 to 2035, By Form
    • Introduction / Key Findings
    • Historical Market Size Value (USD Billion) & Volume (Metric Tons) Analysis By Form, 2020 to 2024
    • Current and Future Market Size Value (USD Billion) & Volume (Metric Tons) Analysis and Forecast By Form, 2025 to 2035
      • Isolates
      • Concentrates
      • Hydrolysates
    • Y-o-Y Growth Trend Analysis By Form, 2020 to 2024
    • Absolute $ Opportunity Analysis By Form, 2025 to 2035
  8. Global Market Analysis 2020 to 2024 and Forecast 2025 to 2035, By End Use
    • Introduction / Key Findings
    • Historical Market Size Value (USD Billion) & Volume (Metric Tons) Analysis By End Use, 2020 to 2024
    • Current and Future Market Size Value (USD Billion) & Volume (Metric Tons) Analysis and Forecast By End Use, 2025 to 2035
      • Nutritional Products
      • Sports Nutrition
      • Medical Nutrition
      • Infant Nutrition
      • Bakery
      • Ready-to-eat
      • Snacks & Cereals
      • Dairy, Confectionery and Dessert
      • Convenience Food
      • Beverages
      • Animal Feed
      • Others (Meat Substitutes, Functional Foods, Soups & Sauces, Pet Nutrition)
    • Y-o-Y Growth Trend Analysis By End Use, 2020 to 2024
    • Absolute $ Opportunity Analysis By End Use, 2025 to 2035
  9. Global Market Analysis 2020 to 2024 and Forecast 2025 to 2035, By Nature
    • Introduction / Key Findings
    • Historical Market Size Value (USD Billion) & Volume (Metric Tons) Analysis By Nature, 2020 to 2024
    • Current and Future Market Size Value (USD Billion) & Volume (Metric Tons) Analysis and Forecast By Nature, 2025 to 2035
      • Organic
      • Conventional
    • Y-o-Y Growth Trend Analysis By Nature, 2020 to 2024
    • Absolute $ Opportunity Analysis By Nature, 2025 to 2035
  10. Global Market Analysis 2020 to 2024 and Forecast 2025 to 2035, By Region
    • Introduction
    • Historical Market Size Value (USD Billion) & Volume (Metric Tons) Analysis By Region, 2020 to 2024
    • Current Market Size Value (USD Billion) & Volume (Metric Tons) Analysis and Forecast By Region, 2025 to 2035
      • North America
      • Latin America
      • Western Europe
      • Eastern Europe
      • East Asia
      • South Asia & Pacific
      • Middle East and Africa
    • Market Attractiveness Analysis By Region
  11. North America Market Analysis 2020 to 2024 and Forecast 2025 to 2035, By Country
    • Historical Market Size Value (USD Billion) & Volume (Metric Tons) Trend Analysis By Market Taxonomy, 2020 to 2024
    • Market Size Value (USD Billion) & Volume (Metric Tons) Forecast By Market Taxonomy, 2025 to 2035
      • By Country
        • USA
        • Canada
        • Mexico
      • By Product Type
      • By Form
      • By End Use
      • By Nature
    • Market Attractiveness Analysis
      • By Country
      • By Product Type
      • By Form
      • By End Use
      • By Nature
    • Key Takeaways
  12. Latin America Market Analysis 2020 to 2024 and Forecast 2025 to 2035, By Country
    • Historical Market Size Value (USD Billion) & Volume (Metric Tons) Trend Analysis By Market Taxonomy, 2020 to 2024
    • Market Size Value (USD Billion) & Volume (Metric Tons) Forecast By Market Taxonomy, 2025 to 2035
      • By Country
        • Brazil
        • Argentina
        • Rest of LATAM
      • By Product Type
      • By Form
      • By End Use
      • By Nature
    • Market Attractiveness Analysis
      • By Country
      • By Product Type
      • By Form
      • By End Use
      • By Nature
    • Key Takeaways
  13. Western Europe Market Analysis 2020 to 2024 and Forecast 2025 to 2035, By Country
    • Historical Market Size Value (USD Billion) & Volume (Metric Tons) Trend Analysis By Market Taxonomy, 2020 to 2024
    • Market Size Value (USD Billion) & Volume (Metric Tons) Forecast By Market Taxonomy, 2025 to 2035
      • By Country
        • Germany
        • Italy
        • France
        • UK
        • Spain
        • BENELUX
        • Nordic
        • Rest of W.Europe
      • By Product Type
      • By Form
      • By End Use
      • By Nature
    • Market Attractiveness Analysis
      • By Country
      • By Product Type
      • By Form
      • By End Use
      • By Nature
    • Key Takeaways
  14. Eastern Europe Market Analysis 2020 to 2024 and Forecast 2025 to 2035, By Country
    • Historical Market Size Value (USD Billion) & Volume (Metric Tons) Trend Analysis By Market Taxonomy, 2020 to 2024
    • Market Size Value (USD Billion) & Volume (Metric Tons) Forecast By Market Taxonomy, 2025 to 2035
      • By Country
        • Russia
        • Hungary
        • Poland
        • Balkan & Baltics
        • Rest of E. Europe
      • By Product Type
      • By Form
      • By End Use
      • By Nature
    • Market Attractiveness Analysis
      • By Country
      • By Product Type
      • By Form
      • By End Use
      • By Nature
    • Key Takeaways
  15. East Asia Market Analysis 2020 to 2024 and Forecast 2025 to 2035, By Country
    • Historical Market Size Value (USD Billion) & Volume (Metric Tons) Trend Analysis By Market Taxonomy, 2020 to 2024
    • Market Size Value (USD Billion) & Volume (Metric Tons) Forecast By Market Taxonomy, 2025 to 2035
      • By Country
        • China
        • Japan
        • South Korea
      • By Product Type
      • By Form
      • By End Use
      • By Nature
    • Market Attractiveness Analysis
      • By Country
      • By Product Type
      • By Form
      • By End Use
      • By Nature
    • Key Takeaways
  16. South Asia & Pacific Market Analysis 2020 to 2024 and Forecast 2025 to 2035, By Country
    • Historical Market Size Value (USD Billion) & Volume (Metric Tons) Trend Analysis By Market Taxonomy, 2020 to 2024
    • Market Size Value (USD Billion) & Volume (Metric Tons) Forecast By Market Taxonomy, 2025 to 2035
      • By Country
        • India
        • Australia & New Zealand
        • ASEAN
        • Rest of SAP
      • By Product Type
      • By Form
      • By End Use
      • By Nature
    • Market Attractiveness Analysis
      • By Country
      • By Product Type
      • By Form
      • By End Use
      • By Nature
    • Key Takeaways
  17. Middle East and Africa Market Analysis 2020 to 2024 and Forecast 2025 to 2035, By Country
    • Historical Market Size Value (USD Billion) & Volume (Metric Tons) Trend Analysis By Market Taxonomy, 2020 to 2024
    • Market Size Value (USD Billion) & Volume (Metric Tons) Forecast By Market Taxonomy, 2025 to 2035
      • By Country
        • GCC Countries
        • Northern Africa
        • South Africa
        • Turkiye
        • Rest of MEA
      • By Product Type
      • By Form
      • By End Use
      • By Nature
    • Market Attractiveness Analysis
      • By Country
      • By Product Type
      • By Form
      • By End Use
      • By Nature
    • Key Takeaways
  18. Key Countries Market Analysis
    • USA
      • Pricing Analysis
      • Market Share Analysis, 2024
        • By Product Type
        • By Form
        • By End Use
        • By Nature
    • Canada
      • Pricing Analysis
      • Market Share Analysis, 2024
        • By Product Type
        • By Form
        • By End Use
        • By Nature
    • Brazil
      • Pricing Analysis
      • Market Share Analysis, 2024
        • By Product Type
        • By Form
        • By End Use
        • By Nature
    • Mexico
      • Pricing Analysis
      • Market Share Analysis, 2024
        • By Product Type
        • By Form
        • By End Use
        • By Nature
    • Argentina
      • Pricing Analysis
      • Market Share Analysis, 2024
        • By Product Type
        • By Form
        • By End Use
        • By Nature
  19. Market Structure Analysis
    • Competition Dashboard
    • Competition Benchmarking
    • Market Share Analysis of Top Players
      • By Regional
      • By Product Type
      • By Form
      • By End Use
      • By Nature
  20. Competition Analysis
    • Competition Deep Dive
      • Glanbia Plc.
        • Overview
        • Product Portfolio
        • Profitability by Market Segments (Product/Age /Sales Channel/Region)
        • Sales Footprint
        • Strategy Overview
          • Marketing Strategy
          • Product Strategy
          • Channel Strategy
      • Archer-Daniels-Midland Co.
        • Overview
        • Product Portfolio
        • Profitability by Market Segments (Product/Age /Sales Channel/Region)
        • Sales Footprint
        • Strategy Overview
          • Marketing Strategy
          • Product Strategy
          • Channel Strategy
      • Cargill Incorporation
        • Overview
        • Product Portfolio
        • Profitability by Market Segments (Product/Age /Sales Channel/Region)
        • Sales Footprint
        • Strategy Overview
          • Marketing Strategy
          • Product Strategy
          • Channel Strategy
      • Kerry Inc.
        • Overview
        • Product Portfolio
        • Profitability by Market Segments (Product/Age /Sales Channel/Region)
        • Sales Footprint
        • Strategy Overview
          • Marketing Strategy
          • Product Strategy
          • Channel Strategy
      • Burcon Nutrascience Corporation
        • Overview
        • Product Portfolio
        • Profitability by Market Segments (Product/Age /Sales Channel/Region)
        • Sales Footprint
        • Strategy Overview
          • Marketing Strategy
          • Product Strategy
          • Channel Strategy
      • E.I. du Pont de Nemours & Co.
        • Overview
        • Product Portfolio
        • Profitability by Market Segments (Product/Age /Sales Channel/Region)
        • Sales Footprint
        • Strategy Overview
          • Marketing Strategy
          • Product Strategy
          • Channel Strategy
      • Royal Avebe UA
        • Overview
        • Product Portfolio
        • Profitability by Market Segments (Product/Age /Sales Channel/Region)
        • Sales Footprint
        • Strategy Overview
          • Marketing Strategy
          • Product Strategy
          • Channel Strategy
      • Cosucra Groupe Warcoing
        • Overview
        • Product Portfolio
        • Profitability by Market Segments (Product/Age /Sales Channel/Region)
        • Sales Footprint
        • Strategy Overview
          • Marketing Strategy
          • Product Strategy
          • Channel Strategy
      • Ingredion Inc.
        • Overview
        • Product Portfolio
        • Profitability by Market Segments (Product/Age /Sales Channel/Region)
        • Sales Footprint
        • Strategy Overview
          • Marketing Strategy
          • Product Strategy
          • Channel Strategy
      • Corbion
        • Overview
        • Product Portfolio
        • Profitability by Market Segments (Product/Age /Sales Channel/Region)
        • Sales Footprint
        • Strategy Overview
          • Marketing Strategy
          • Product Strategy
          • Channel Strategy
      • Tate & Lyle Plc.
        • Overview
        • Product Portfolio
        • Profitability by Market Segments (Product/Age /Sales Channel/Region)
        • Sales Footprint
        • Strategy Overview
          • Marketing Strategy
          • Product Strategy
          • Channel Strategy
      • CHS Inc.
        • Overview
        • Product Portfolio
        • Profitability by Market Segments (Product/Age /Sales Channel/Region)
        • Sales Footprint
        • Strategy Overview
          • Marketing Strategy
          • Product Strategy
          • Channel Strategy
      • Roquette Freres
        • Overview
        • Product Portfolio
        • Profitability by Market Segments (Product/Age /Sales Channel/Region)
        • Sales Footprint
        • Strategy Overview
          • Marketing Strategy
          • Product Strategy
          • Channel Strategy
      • AGT Food & Ingredients Inc.
        • Overview
        • Product Portfolio
        • Profitability by Market Segments (Product/Age /Sales Channel/Region)
        • Sales Footprint
        • Strategy Overview
          • Marketing Strategy
          • Product Strategy
          • Channel Strategy
      • Now Food
        • Overview
        • Product Portfolio
        • Profitability by Market Segments (Product/Age /Sales Channel/Region)
        • Sales Footprint
        • Strategy Overview
          • Marketing Strategy
          • Product Strategy
          • Channel Strategy
  21. Assumptions & Acronyms Used
  22. Research Methodology

List of Tables

  • Table 1: Global Market Value (USD Billion) Forecast by Region, 2020 to 2035
  • Table 2: Global Market Volume (Metric Tons) Forecast by Region, 2020 to 2035
  • Table 3: Global Market Value (USD Billion) Forecast by Product Type, 2020 to 2035
  • Table 4: Global Market Volume (Metric Tons) Forecast by Product Type, 2020 to 2035
  • Table 5: Global Market Value (USD Billion) Forecast by Form, 2020 to 2035
  • Table 6: Global Market Volume (Metric Tons) Forecast by Form, 2020 to 2035
  • Table 7: Global Market Value (USD Billion) Forecast by End Use, 2020 to 2035
  • Table 8: Global Market Volume (Metric Tons) Forecast by End Use, 2020 to 2035
  • Table 9: Global Market Value (USD Billion) Forecast by Nature, 2020 to 2035
  • Table 10: Global Market Volume (Metric Tons) Forecast by Nature, 2020 to 2035
  • Table 11: North America Market Value (USD Billion) Forecast by Country, 2020 to 2035
  • Table 12: North America Market Volume (Metric Tons) Forecast by Country, 2020 to 2035
  • Table 13: North America Market Value (USD Billion) Forecast by Product Type, 2020 to 2035
  • Table 14: North America Market Volume (Metric Tons) Forecast by Product Type, 2020 to 2035
  • Table 15: North America Market Value (USD Billion) Forecast by Form, 2020 to 2035
  • Table 16: North America Market Volume (Metric Tons) Forecast by Form, 2020 to 2035
  • Table 17: North America Market Value (USD Billion) Forecast by End Use, 2020 to 2035
  • Table 18: North America Market Volume (Metric Tons) Forecast by End Use, 2020 to 2035
  • Table 19: North America Market Value (USD Billion) Forecast by Nature, 2020 to 2035
  • Table 20: North America Market Volume (Metric Tons) Forecast by Nature, 2020 to 2035
  • Table 21: Latin America Market Value (USD Billion) Forecast by Country, 2020 to 2035
  • Table 22: Latin America Market Volume (Metric Tons) Forecast by Country, 2020 to 2035
  • Table 23: Latin America Market Value (USD Billion) Forecast by Product Type, 2020 to 2035
  • Table 24: Latin America Market Volume (Metric Tons) Forecast by Product Type, 2020 to 2035
  • Table 25: Latin America Market Value (USD Billion) Forecast by Form, 2020 to 2035
  • Table 26: Latin America Market Volume (Metric Tons) Forecast by Form, 2020 to 2035
  • Table 27: Latin America Market Value (USD Billion) Forecast by End Use, 2020 to 2035
  • Table 28: Latin America Market Volume (Metric Tons) Forecast by End Use, 2020 to 2035
  • Table 29: Latin America Market Value (USD Billion) Forecast by Nature, 2020 to 2035
  • Table 30: Latin America Market Volume (Metric Tons) Forecast by Nature, 2020 to 2035
  • Table 31: Western Europe Market Value (USD Billion) Forecast by Country, 2020 to 2035
  • Table 32: Western Europe Market Volume (Metric Tons) Forecast by Country, 2020 to 2035
  • Table 33: Western Europe Market Value (USD Billion) Forecast by Product Type, 2020 to 2035
  • Table 34: Western Europe Market Volume (Metric Tons) Forecast by Product Type, 2020 to 2035
  • Table 35: Western Europe Market Value (USD Billion) Forecast by Form, 2020 to 2035
  • Table 36: Western Europe Market Volume (Metric Tons) Forecast by Form, 2020 to 2035
  • Table 37: Western Europe Market Value (USD Billion) Forecast by End Use, 2020 to 2035
  • Table 38: Western Europe Market Volume (Metric Tons) Forecast by End Use, 2020 to 2035
  • Table 39: Western Europe Market Value (USD Billion) Forecast by Nature, 2020 to 2035
  • Table 40: Western Europe Market Volume (Metric Tons) Forecast by Nature, 2020 to 2035
  • Table 41: Eastern Europe Market Value (USD Billion) Forecast by Country, 2020 to 2035
  • Table 42: Eastern Europe Market Volume (Metric Tons) Forecast by Country, 2020 to 2035
  • Table 43: Eastern Europe Market Value (USD Billion) Forecast by Product Type, 2020 to 2035
  • Table 44: Eastern Europe Market Volume (Metric Tons) Forecast by Product Type, 2020 to 2035
  • Table 45: Eastern Europe Market Value (USD Billion) Forecast by Form, 2020 to 2035
  • Table 46: Eastern Europe Market Volume (Metric Tons) Forecast by Form, 2020 to 2035
  • Table 47: Eastern Europe Market Value (USD Billion) Forecast by End Use, 2020 to 2035
  • Table 48: Eastern Europe Market Volume (Metric Tons) Forecast by End Use, 2020 to 2035
  • Table 49: Eastern Europe Market Value (USD Billion) Forecast by Nature, 2020 to 2035
  • Table 50: Eastern Europe Market Volume (Metric Tons) Forecast by Nature, 2020 to 2035
  • Table 51: East Asia Market Value (USD Billion) Forecast by Country, 2020 to 2035
  • Table 52: East Asia Market Volume (Metric Tons) Forecast by Country, 2020 to 2035
  • Table 53: East Asia Market Value (USD Billion) Forecast by Product Type, 2020 to 2035
  • Table 54: East Asia Market Volume (Metric Tons) Forecast by Product Type, 2020 to 2035
  • Table 55: East Asia Market Value (USD Billion) Forecast by Form, 2020 to 2035
  • Table 56: East Asia Market Volume (Metric Tons) Forecast by Form, 2020 to 2035
  • Table 57: East Asia Market Value (USD Billion) Forecast by End Use, 2020 to 2035
  • Table 58: East Asia Market Volume (Metric Tons) Forecast by End Use, 2020 to 2035
  • Table 59: East Asia Market Value (USD Billion) Forecast by Nature, 2020 to 2035
  • Table 60: East Asia Market Volume (Metric Tons) Forecast by Nature, 2020 to 2035
  • Table 61: South Asia & Pacific Market Value (USD Billion) Forecast by Country, 2020 to 2035
  • Table 62: South Asia & Pacific Market Volume (Metric Tons) Forecast by Country, 2020 to 2035
  • Table 63: South Asia & Pacific Market Value (USD Billion) Forecast by Product Type, 2020 to 2035
  • Table 64: South Asia & Pacific Market Volume (Metric Tons) Forecast by Product Type, 2020 to 2035
  • Table 65: South Asia & Pacific Market Value (USD Billion) Forecast by Form, 2020 to 2035
  • Table 66: South Asia & Pacific Market Volume (Metric Tons) Forecast by Form, 2020 to 2035
  • Table 67: South Asia & Pacific Market Value (USD Billion) Forecast by End Use, 2020 to 2035
  • Table 68: South Asia & Pacific Market Volume (Metric Tons) Forecast by End Use, 2020 to 2035
  • Table 69: South Asia & Pacific Market Value (USD Billion) Forecast by Nature, 2020 to 2035
  • Table 70: South Asia & Pacific Market Volume (Metric Tons) Forecast by Nature, 2020 to 2035
  • Table 71: Middle East and Africa Market Value (USD Billion) Forecast by Country, 2020 to 2035
  • Table 72: Middle East and Africa Market Volume (Metric Tons) Forecast by Country, 2020 to 2035
  • Table 73: Middle East and Africa Market Value (USD Billion) Forecast by Product Type, 2020 to 2035
  • Table 74: Middle East and Africa Market Volume (Metric Tons) Forecast by Product Type, 2020 to 2035
  • Table 75: Middle East and Africa Market Value (USD Billion) Forecast by Form, 2020 to 2035
  • Table 76: Middle East and Africa Market Volume (Metric Tons) Forecast by Form, 2020 to 2035
  • Table 77: Middle East and Africa Market Value (USD Billion) Forecast by End Use, 2020 to 2035
  • Table 78: Middle East and Africa Market Volume (Metric Tons) Forecast by End Use, 2020 to 2035
  • Table 79: Middle East and Africa Market Value (USD Billion) Forecast by Nature, 2020 to 2035
  • Table 80: Middle East and Africa Market Volume (Metric Tons) Forecast by Nature, 2020 to 2035

List of Figures

  • Figure 1: Global Market Volume (Metric Tons) Forecast 2020 to 2035
  • Figure 2: Global Market Pricing Analysis
  • Figure 3: Global Market Value (USD Billion) Forecast 2020 to 2035
  • Figure 4: Global Market Value Share and BPS Analysis by Product Type, 2025 and 2035
  • Figure 5: Global Market Y-o-Y Growth Comparison by Product Type, 2025 to 2035
  • Figure 6: Global Market Attractiveness Analysis by Product Type
  • Figure 7: Global Market Value Share and BPS Analysis by Form, 2025 and 2035
  • Figure 8: Global Market Y-o-Y Growth Comparison by Form, 2025 to 2035
  • Figure 9: Global Market Attractiveness Analysis by Form
  • Figure 10: Global Market Value Share and BPS Analysis by End Use, 2025 and 2035
  • Figure 11: Global Market Y-o-Y Growth Comparison by End Use, 2025 to 2035
  • Figure 12: Global Market Attractiveness Analysis by End Use
  • Figure 13: Global Market Value Share and BPS Analysis by Nature, 2025 and 2035
  • Figure 14: Global Market Y-o-Y Growth Comparison by Nature, 2025 to 2035
  • Figure 15: Global Market Attractiveness Analysis by Nature
  • Figure 16: Global Market Value (USD Billion) Share and BPS Analysis by Region, 2025 and 2035
  • Figure 17: Global Market Y-o-Y Growth Comparison by Region, 2025 to 2035
  • Figure 18: Global Market Attractiveness Analysis by Region
  • Figure 19: North America Market Incremental $ Opportunity, 2025 to 2035
  • Figure 20: Latin America Market Incremental $ Opportunity, 2025 to 2035
  • Figure 21: Western Europe Market Incremental $ Opportunity, 2025 to 2035
  • Figure 22: Eastern Europe Market Incremental $ Opportunity, 2025 to 2035
  • Figure 23: East Asia Market Incremental $ Opportunity, 2025 to 2035
  • Figure 24: South Asia & Pacific Market Incremental $ Opportunity, 2025 to 2035
  • Figure 25: Middle East and Africa Market Incremental $ Opportunity, 2025 to 2035
  • Figure 26: North America Market Value Share and BPS Analysis by Country, 2025 and 2035
  • Figure 27: North America Market Value Share and BPS Analysis by Product Type, 2025 and 2035
  • Figure 28: North America Market Y-o-Y Growth Comparison by Product Type, 2025 to 2035
  • Figure 29: North America Market Attractiveness Analysis by Product Type
  • Figure 30: North America Market Value Share and BPS Analysis by Form, 2025 and 2035
  • Figure 31: North America Market Y-o-Y Growth Comparison by Form, 2025 to 2035
  • Figure 32: North America Market Attractiveness Analysis by Form
  • Figure 33: North America Market Value Share and BPS Analysis by End Use, 2025 and 2035
  • Figure 34: North America Market Y-o-Y Growth Comparison by End Use, 2025 to 2035
  • Figure 35: North America Market Attractiveness Analysis by End Use
  • Figure 36: North America Market Value Share and BPS Analysis by Nature, 2025 and 2035
  • Figure 37: North America Market Y-o-Y Growth Comparison by Nature, 2025 to 2035
  • Figure 38: North America Market Attractiveness Analysis by Nature
  • Figure 39: Latin America Market Value Share and BPS Analysis by Country, 2025 and 2035
  • Figure 40: Latin America Market Value Share and BPS Analysis by Product Type, 2025 and 2035
  • Figure 41: Latin America Market Y-o-Y Growth Comparison by Product Type, 2025 to 2035
  • Figure 42: Latin America Market Attractiveness Analysis by Product Type
  • Figure 43: Latin America Market Value Share and BPS Analysis by Form, 2025 and 2035
  • Figure 44: Latin America Market Y-o-Y Growth Comparison by Form, 2025 to 2035
  • Figure 45: Latin America Market Attractiveness Analysis by Form
  • Figure 46: Latin America Market Value Share and BPS Analysis by End Use, 2025 and 2035
  • Figure 47: Latin America Market Y-o-Y Growth Comparison by End Use, 2025 to 2035
  • Figure 48: Latin America Market Attractiveness Analysis by End Use
  • Figure 49: Latin America Market Value Share and BPS Analysis by Nature, 2025 and 2035
  • Figure 50: Latin America Market Y-o-Y Growth Comparison by Nature, 2025 to 2035
  • Figure 51: Latin America Market Attractiveness Analysis by Nature
  • Figure 52: Western Europe Market Value Share and BPS Analysis by Country, 2025 and 2035
  • Figure 53: Western Europe Market Value Share and BPS Analysis by Product Type, 2025 and 2035
  • Figure 54: Western Europe Market Y-o-Y Growth Comparison by Product Type, 2025 to 2035
  • Figure 55: Western Europe Market Attractiveness Analysis by Product Type
  • Figure 56: Western Europe Market Value Share and BPS Analysis by Form, 2025 and 2035
  • Figure 57: Western Europe Market Y-o-Y Growth Comparison by Form, 2025 to 2035
  • Figure 58: Western Europe Market Attractiveness Analysis by Form
  • Figure 59: Western Europe Market Value Share and BPS Analysis by End Use, 2025 and 2035
  • Figure 60: Western Europe Market Y-o-Y Growth Comparison by End Use, 2025 to 2035
  • Figure 61: Western Europe Market Attractiveness Analysis by End Use
  • Figure 62: Western Europe Market Value Share and BPS Analysis by Nature, 2025 and 2035
  • Figure 63: Western Europe Market Y-o-Y Growth Comparison by Nature, 2025 to 2035
  • Figure 64: Western Europe Market Attractiveness Analysis by Nature
  • Figure 65: Eastern Europe Market Value Share and BPS Analysis by Country, 2025 and 2035
  • Figure 66: Eastern Europe Market Value Share and BPS Analysis by Product Type, 2025 and 2035
  • Figure 67: Eastern Europe Market Y-o-Y Growth Comparison by Product Type, 2025 to 2035
  • Figure 68: Eastern Europe Market Attractiveness Analysis by Product Type
  • Figure 69: Eastern Europe Market Value Share and BPS Analysis by Form, 2025 and 2035
  • Figure 70: Eastern Europe Market Y-o-Y Growth Comparison by Form, 2025 to 2035
  • Figure 71: Eastern Europe Market Attractiveness Analysis by Form
  • Figure 72: Eastern Europe Market Value Share and BPS Analysis by End Use, 2025 and 2035
  • Figure 73: Eastern Europe Market Y-o-Y Growth Comparison by End Use, 2025 to 2035
  • Figure 74: Eastern Europe Market Attractiveness Analysis by End Use
  • Figure 75: Eastern Europe Market Value Share and BPS Analysis by Nature, 2025 and 2035
  • Figure 76: Eastern Europe Market Y-o-Y Growth Comparison by Nature, 2025 to 2035
  • Figure 77: Eastern Europe Market Attractiveness Analysis by Nature
  • Figure 78: East Asia Market Value Share and BPS Analysis by Country, 2025 and 2035
  • Figure 79: East Asia Market Value Share and BPS Analysis by Product Type, 2025 and 2035
  • Figure 80: East Asia Market Y-o-Y Growth Comparison by Product Type, 2025 to 2035
  • Figure 81: East Asia Market Attractiveness Analysis by Product Type
  • Figure 82: East Asia Market Value Share and BPS Analysis by Form, 2025 and 2035
  • Figure 83: East Asia Market Y-o-Y Growth Comparison by Form, 2025 to 2035
  • Figure 84: East Asia Market Attractiveness Analysis by Form
  • Figure 85: East Asia Market Value Share and BPS Analysis by End Use, 2025 and 2035
  • Figure 86: East Asia Market Y-o-Y Growth Comparison by End Use, 2025 to 2035
  • Figure 87: East Asia Market Attractiveness Analysis by End Use
  • Figure 88: East Asia Market Value Share and BPS Analysis by Nature, 2025 and 2035
  • Figure 89: East Asia Market Y-o-Y Growth Comparison by Nature, 2025 to 2035
  • Figure 90: East Asia Market Attractiveness Analysis by Nature
  • Figure 91: South Asia & Pacific Market Value Share and BPS Analysis by Country, 2025 and 2035
  • Figure 92: South Asia & Pacific Market Value Share and BPS Analysis by Product Type, 2025 and 2035
  • Figure 93: South Asia & Pacific Market Y-o-Y Growth Comparison by Product Type, 2025 to 2035
  • Figure 94: South Asia & Pacific Market Attractiveness Analysis by Product Type
  • Figure 95: South Asia & Pacific Market Value Share and BPS Analysis by Form, 2025 and 2035
  • Figure 96: South Asia & Pacific Market Y-o-Y Growth Comparison by Form, 2025 to 2035
  • Figure 97: South Asia & Pacific Market Attractiveness Analysis by Form
  • Figure 98: South Asia & Pacific Market Value Share and BPS Analysis by End Use, 2025 and 2035
  • Figure 99: South Asia & Pacific Market Y-o-Y Growth Comparison by End Use, 2025 to 2035
  • Figure 100: South Asia & Pacific Market Attractiveness Analysis by End Use
  • Figure 101: South Asia & Pacific Market Value Share and BPS Analysis by Nature, 2025 and 2035
  • Figure 102: South Asia & Pacific Market Y-o-Y Growth Comparison by Nature, 2025 to 2035
  • Figure 103: South Asia & Pacific Market Attractiveness Analysis by Nature
  • Figure 104: Middle East and Africa Market Value Share and BPS Analysis by Country, 2025 and 2035
  • Figure 105: Middle East and Africa Market Value Share and BPS Analysis by Product Type, 2025 and 2035
  • Figure 106: Middle East and Africa Market Y-o-Y Growth Comparison by Product Type, 2025 to 2035
  • Figure 107: Middle East and Africa Market Attractiveness Analysis by Product Type
  • Figure 108: Middle East and Africa Market Value Share and BPS Analysis by Form, 2025 and 2035
  • Figure 109: Middle East and Africa Market Y-o-Y Growth Comparison by Form, 2025 to 2035
  • Figure 110: Middle East and Africa Market Attractiveness Analysis by Form
  • Figure 111: Middle East and Africa Market Value Share and BPS Analysis by End Use, 2025 and 2035
  • Figure 112: Middle East and Africa Market Y-o-Y Growth Comparison by End Use, 2025 to 2035
  • Figure 113: Middle East and Africa Market Attractiveness Analysis by End Use
  • Figure 114: Middle East and Africa Market Value Share and BPS Analysis by Nature, 2025 and 2035
  • Figure 115: Middle East and Africa Market Y-o-Y Growth Comparison by Nature, 2025 to 2035
  • Figure 116: Middle East and Africa Market Attractiveness Analysis by Nature
  • Figure 117: Global Market - Tier Structure Analysis
  • Figure 118: Global Market - Company Share Analysis

Frequently Asked Questions

What is the projected size of the plant-based protein market in 2025?

The market is valued at USD 20.3 billion in 2025.

What is the outlook on plant-based protein demand by 2035?

The market is forecasted to reach USD 46 billion by 2035, reflecting a CAGR of 8.5%.

Which form segment accounts for the largest share of the market?

Isolates will lead the form segment with a 41.2% share in 2025.

Which nature category is expected to dominate the market?

Conventional will account for 78.3% of the global market share in 2025.

Which country is projected to have the fastest-growing plant-based protein market?

Japan is projected to grow at the fastest rate, with a CAGR of 9.1% from 2025 to 2035.

Explore Similar Insights

Future Market Insights

Plant-Based Protein Market