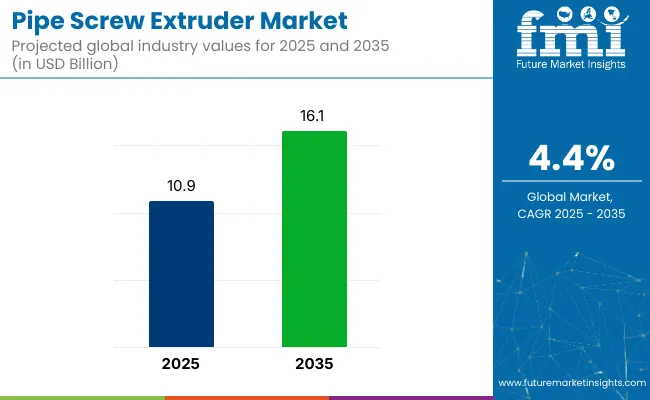
The pipe screw extruder market size is projected to be worth US$ 10.1 billion in 2023. The market is likely to surpass US$ 15.5 billion by 2033 at a CAGR of 4.4% during the forecast period. The market growth is being propelled by notable industrialization in emerging and established nations and an increased focus on air quality management. Advancements in pipe screw extruders have played a significant role in enhancing the production efficiency and output quality of plastic pipes. These advancements include improvements in extruder design, control systems, automation, and the integration of Industry 4.0 technologies. Such developments have led to increased production capacities, reduced downtime, and improved overall operational efficiency for manufacturers.
The pipe screw extruder market has been growing steadily in recent years, driven by various factors such as urbanization, infrastructure development, and the increasing use of plastic pipes in various applications. Plastic pipes offer several advantages over traditional materials, such as lightweight, corrosion resistance, ease of installation, and cost-effectiveness, which have contributed to their growing popularity across various sectors, including construction, agriculture, and telecommunications.
Moreover, the rising global population and the need for improved water supply and sanitation systems in both developed and developing countries have been driving the demand for plastic pipes. Additionally, the replacement of aging infrastructure in developed regions has also boosted the market growth.
Other Drivers Propelling the Demand for Pipe Screw Extruders include:
Challenges for Companies /Manufacturers in the Pipe Screw Extruder Market:
Opportunities in the Pipe Screw Extruder Industry:
Latest Trends in the Pipe Screw Extruder Market:
Attributes | Details |
---|---|
Pipe Screw Extruder Market Size (2023) | US$ 10.1 billion |
Pipe Screw Extruder Market Projected Size (2033) | US$ 15.5 billion |
Value CAGR (2023 to 2033) | 4.4% |
Don't pay for what you don't need
Customize your report by selecting specific countries or regions and save 30%!
From 2018 to 2022, the global pipe screw extruder market experienced a CAGR of 4.1%, reaching a market size of US$ 15.5 billion in 2023 at a growing CAGR of 4.4%.
From 2018 to 2022, the global pipe screw extruder industry witnessed steady growth due to the increasing demand for pipes and fittings in various industries. The pipe screw extruder market is also being driven by the increasing use of plastics in the chemical processing, food and beverage processing, and oil and gas production industries. The increasing demand for plastic pipes and fittings in these industries is expected to drive the growth of the pipe screw extruder market.
Looking ahead, the global pipe screw extruder industry is expected to rise at a CAGR of 4.4% from The pipe screw extruder market is anticipated to experience steady expansion in the coming years, driven by several factors.
Firstly, the rising demand for pipes in various industries such as construction, agriculture, and infrastructure development is likely to boost the market. As countries continue to invest in infrastructure projects and urbanization, the need for efficient pipe systems for water supply, drainage, and irrigation will grow, leading to an increased demand for pipe screw extruders. Additionally, the growing trend towards sustainable and eco-friendly materials is expected to contribute to market growth. The adoption of recyclable and environmentally friendly polymers for pipe manufacturing may lead to the development of innovative pipe screw extruders that can handle these materials, catering to the evolving needs of the market.
Country | The United States |
---|---|
Market Size (US$ billion) by End of Forecast Period (2033) | US$ 1.5 billion |
CAGR % 2023 to End of Forecast (2033) | 6.2% |
The Pipe Screw Extruder industry in the United States is expected to reach a market share of US$ 1.5 billion by 2033, expanding at a CAGR of 6.2%. The Pipe Screw Extruder industry in the United States is expected to witness growth due to the increasing focus on Construction activities, Oil & gas exploration and infrastructure development. The Surge in the US shale gas market has stimulated a rise in the demand for pipes employed in natural gas exploration and transportation.
Country | China |
---|---|
Market Size (US$ billion) by End of Forecast Period (2033) | US$ 2.09 billion |
CAGR % 2023 to End of Forecast (2033) | 7.1% |
The pipe screw extruders industry in China is expected to reach a market share of US$ 2.09 billion, expanding at a CAGR of 7.1% during the forecast period. The China market is projected to experience growth owing to the rising demand for pipe screw extruders as china is already a major player in this market due to its large manufacturing sector and infrastructure projects.
Country | Germany |
---|---|
Market Size (US$ billion) by End of Forecast Period (2033) | US$ 1.3 billion |
CAGR % 2023 to End of Forecast (2033) | 8.1% |
The pipe screw extruder industry in China is anticipated to reach a market share of US$ 1.3 billion, moving at a CAGR of 8.1 % during the forecast period. The pipe screw extruder industry in Germany is expected to grow prominently due to the increasing demand for Energy Sector and the consistent requirement in the automotive sector.
Due to the rising demand for extruded food products such snacks, breakfast cereals, and other convenience foods, the food sector is driving the pipe screw extruder market. These items are made using pipe screw extruders, which combine the components and mold them into the appropriate shape. Due to the high production quantities and regular quality requirements for food products, the food industry is a significant customer of pipe screw extruders. Pipe screw extruders are also used in the food industry to lower manufacturing costs and increase efficiency. As a result, the market for pipe screw extruders is expanding significantly thanks in large part to the food industry.
Get the data you need at a Fraction of the cost
Personalize your report by choosing insights you need
and save 40%!
The pipe screw extruder industry is highly competitive, with numerous players vying for market share. In such a scenario, key players must adopt effective strategies to stay ahead of the competition.
Key Strategies Adopted by the Players
The top companies in the pipe screw extruder market make significant investments in R&D to enhance the functionality and effectiveness of their products. This can involve the creation of new materials and technologies, enhanced extruder functioning and design, and more effective manufacturing procedures.
Key players in the industry are able to serve a wider variety of customers and fulfil a wider range of industrial needs by extending their product portfolio to include a greater range of pipe screw extruder types and sizes.
Key companies in the pipe screw extruder business should focus on building great client relationships since it promotes customer loyalty and satisfaction. This can be achieved through giving personalized solutions, providing exceptional customer service, and keeping lines of communication open.
For major participants in the pipe screw extruder business, concentrating on cost-effectiveness and efficiency in manufacturing processes is crucial since it lowers production costs and boosts profitability. Lean manufacturing techniques, production process optimization, and the use of energy-efficient machinery can all help achieve this.
Key Players in the Pipe Screw Extruder Industry
Key Developments in the Pipe Screw Extruder Market:
The global pipe screw extruder industry is expected to hit a value of US$ 10.1 billion by 2023.
The pipe screw extruder demand is set to expand by 4.4% during the assessment period.
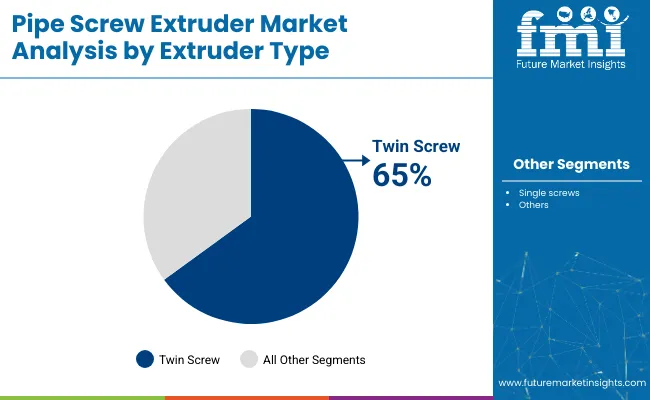
The Twin Screw segment is projected to hold the dominant share of the market.
The market is predicted to exceed US$ 15.5 billion by 2033.
The United States offers key opportunities for new entrants in the pipe screw extruder industry.
1. Executive Summary
1.1. Global Market Outlook
1.2. Demand Side Trends
1.3. Supply Side Trends
1.4. Technology Roadmap
1.5. Analysis and Recommendations
2. Market Overview
2.1. Market Coverage / Taxonomy
2.2. Market Definition / Scope / Limitations
3. Key Market Trends
3.1. Key Trends Impacting the Market
3.2. Product Innovation / Development Trends
4. Key Success Factors
4.1. Product Adoption / Usage Analysis
4.2. Product USPs / Features
4.3. Strategic Promotional Strategies
5. Global Market Demand Analysis 2018 to 2022 and Forecast, 2023 to 2033
5.1. Historical Market Volume (Tons) Analysis, 2018 to 2022
5.2. Current and Future Market Volume (Tons) Projections, 2023 to 2033
5.3. Y-o-Y Growth Trend Analysis
6. Global Market - Pricing Analysis
6.1. Regional Pricing Analysis By Extruder Type
6.2. Global Average Pricing Analysis Benchmark
7. Global Market Demand (in Value or Size in US$ Million) Analysis 2018 to 2022 and Forecast, 2023 to 2033
7.1. Historical Market Value (US$ Million) Analysis, 2018 to 2022
7.2. Current and Future Market Value (US$ Million) Projections, 2023 to 2033
7.2.1. Y-o-Y Growth Trend Analysis
7.2.2. Absolute $ Opportunity Analysis
8. Market Background
8.1. Macro-Economic Factors
8.1.1. Global GDP Growth Outlook
8.1.2. Parent Market Outlook
8.1.3. Other Macro-Economic Factors
8.2. Forecast Factors - Relevance & Impact
8.2.1. Top Companies Historical Growth
8.2.2. GDP Growth forecast
8.2.3. Manufacturing Industry forecast
8.2.4. Global Urbanization Growth Outlook
8.2.5. Business Climate
8.2.6. Covid-19 Impact Assessment
8.2.7. End-use Industry Growth Outlook
8.3. Value Chain
8.3.1. Product Manufacturers
8.3.2. End Users
8.3.3. Avg. Profitability Margins
8.4. COVID-19 Crisis – Impact Assessment
8.4.1. Current Statistics
8.4.2. Short-Mid-Long Term Outlook
8.4.3. Likely Rebound
8.5. Market Dynamics
8.5.1. Drivers
8.5.2. Restraints
8.5.3. Opportunity Analysis
8.6. Global Supply Demand Analysis
8.7. Key Regulations & Certifications
9. Global Market Analysis 2018 to 2022 and Forecast 2023 to 2033, By Extruder Type
9.1. Introduction / Key Findings
9.2. Historical Market Size (US$ Million) and Volume Analysis By Extruder Type, 2018 to 2022
9.3. Current and Future Market Size (US$ Million) and Volume Analysis and Forecast By Extruder Type, 2023 to 2033
9.3.1. Single Screw
9.3.2. Twin Screw
9.4. Market Attractiveness Analysis By Extruder Type
10. Global Market Analysis 2018 to 2022 and Forecast 2023 to 2033, By End Use
10.1. Introduction / Key Findings
10.2. Historical Market Size (US$ Million) and Volume Analysis By End Use, 2018 to 2022
10.3. Current and Future Market Size (US$ Million) and Volume Analysis and Forecast By End Use, 2023 to 2033
10.3.1. Plastic Industries
10.3.2. Rubber Industries
10.3.3. Food Industries
10.3.4. Building & Construction
10.3.5. Others
10.4. Market Attractiveness Analysis By End Use
11. Global Market Analysis 2018 to 2022 and Forecast 2023 to 2033, by Region
11.1. Introduction
11.2. Historical Market Size (US$ Million) and Volume Analysis By Region, 2018 to 2022
11.3. Current Market Size (US$ Million) and Volume Analysis and Forecast By Region, 2023 to 2033
11.3.1. North America
11.3.2. Latin America
11.3.3. Western Europe
11.3.4. Eastern Europe
11.3.5. Central Asia
11.3.6. Russia & Belarus
11.3.7. Balkan & Baltic Countries
11.3.8. Middle East and Africa (MEA)
11.3.9. East Asia
11.3.10. South Asia and Pacific
11.4. Market Attractiveness Analysis By Region
12. North America Market Analysis 2018 to 2022 and Forecast 2023 to 2033
12.1. Introduction
12.2. Pricing Analysis
12.3. Historical Market Size (US$ Million) and Volume Trend Analysis By Market Taxonomy, 2018 to 2022
12.4. Market Size (US$ Million) and Volume Forecast By Market Taxonomy, 2023 to 2033
12.4.1. By Country
12.4.1.1. U.S.
12.4.1.2. Canada
12.4.2. By Extruder Type
12.4.3. By End Use
12.5. Market Attractiveness Analysis
12.5.1. By Country
12.5.2. By Extruder Type
12.5.3. By End Use
12.6. Market Trends
12.7. Key Market Participants - Intensity Mapping
12.8. Drivers and Restraints - Impact Analysis
13. Latin America Market Analysis 2018 to 2022 and Forecast 2023 to 2033
13.1. Introduction
13.2. Pricing Analysis
13.3. Historical Market Size (US$ Million) and Volume Trend Analysis By Market Taxonomy, 2018 to 2022
13.4. Market Size (US$ Million) and Volume Forecast By Market Taxonomy, 2023 to 2033
13.4.1. By Country
13.4.1.1. Brazil
13.4.1.2. Mexico
13.4.1.3. Argentina
13.4.1.4. Rest of Latin America
13.4.2. By Extruder Type
13.4.3. By End Use
13.5. Market Attractiveness Analysis
13.5.1. By Country
13.5.2. By Extruder Type
13.5.3. By End Use
13.6. Market Trends
13.7. Key Market Participants - Intensity Mapping
13.8. Drivers and Restraints - Impact Analysis
14. Western Europe Market Analysis 2018 to 2022 and Forecast 2023 to 2033
14.1. Introduction
14.2. Pricing Analysis
14.3. Historical Market Size (US$ Million) and Volume Trend Analysis By Market Taxonomy, 2018 to 2022
14.4. Market Size (US$ Million) and Volume Forecast By Market Taxonomy, 2023 to 2033
14.4.1. By Country
14.4.1.1. Germany
14.4.1.2. Italy
14.4.1.3. France
14.4.1.4. U.K.
14.4.1.5. Spain
14.4.1.6. BENELUX
14.4.1.7. NORDICS
14.4.1.8. Rest of Western Europe
14.4.2. By Extruder Type
14.4.3. By End Use
14.5. Market Attractiveness Analysis
14.5.1. By Country
14.5.2. By Extruder Type
14.5.3. By End Use
14.6. Market Trends
14.7. Key Market Participants - Intensity Mapping
14.8. Drivers and Restraints - Impact Analysis
15. Eastern Europe Market Analysis 2018 to 2022 and Forecast 2023 to 2033
15.1. Introduction
15.2. Pricing Analysis
15.3. Historical Market Size (US$ Million) and Volume Trend Analysis By Market Taxonomy, 2018 to 2022
15.4. Market Size (US$ Million) and Volume Forecast By Market Taxonomy, 2023 to 2033
15.4.1. By Country
15.4.1.1. Poland
15.4.1.2. Hungary
15.4.1.3. Romania
15.4.1.4. Czech Republic
15.4.1.5. Rest of Eastern Europe
15.4.2. By Extruder Type
15.4.3. By End Use
15.5. Market Attractiveness Analysis
15.5.1. By Country
15.5.2. By Extruder Type
15.5.3. By End Use
15.6. Market Trends
15.7. Key Market Participants - Intensity Mapping
15.8. Drivers and Restraints - Impact Analysis
16. Central Asia Market Analysis 2018 to 2022 and Forecast 2023 to 2033
16.1. Introduction
16.2. Pricing Analysis
16.3. Historical Market Size (US$ Million) and Volume Trend Analysis By Market Taxonomy, 2018 to 2022
16.4. Market Size (US$ Million) and Volume Forecast By Market Taxonomy, 2023 to 2033
16.4.1. By Extruder Type
16.4.2. By End Use
16.5. Market Attractiveness Analysis
16.5.1. By Extruder Type
16.5.2. By End Use
16.6. Market Trends
16.7. Key Market Participants - Intensity Mapping
16.8. Drivers and Restraints - Impact Analysis
17. Russia & Belarus Market Analysis 2018 to 2022 and Forecast 2023 to 2033
17.1. Introduction
17.2. Pricing Analysis
17.3. Historical Market Size (US$ Million) and Volume Trend Analysis By Market Taxonomy, 2018 to 2022
17.4. Market Size (US$ Million) and Volume Forecast By Market Taxonomy, 2023 to 2033
17.4.1. By Extruder Type
17.4.2. By End Use
17.5. Market Attractiveness Analysis
17.5.1. By Extruder Type
17.5.2. By End Use
17.6. Market Trends
17.7. Key Market Participants - Intensity Mapping
17.8. Drivers and Restraints - Impact Analysis
18. Balkan & Baltic Countries Market Analysis 2018 to 2022 and Forecast 2023 to 2033
18.1. Introduction
18.2. Pricing Analysis
18.3. Historical Market Size (US$ Million) and Volume Trend Analysis By Market Taxonomy, 2018 to 2022
18.4. Market Size (US$ Million) and Volume Forecast By Market Taxonomy, 2023 to 2033
18.4.1. By Extruder Type
18.4.2. By End Use
18.5. Market Attractiveness Analysis
18.5.1. By Extruder Type
18.5.2. By End Use
18.6. Market Trends
18.7. Key Market Participants - Intensity Mapping
18.8. Drivers and Restraints - Impact Analysis
19. South Asia and Pacific Market Analysis 2018 to 2022 and Forecast 2023 to 2033
19.1. Introduction
19.2. Pricing Analysis
19.3. Historical Market Size (US$ Million) and Volume Trend Analysis By Market Taxonomy, 2018 to 2022
19.4. Market Size (US$ Million) and Volume Forecast By Market Taxonomy, 2023 to 2033
19.4.1. By Country
19.4.1.1. India
19.4.1.2. ASEAN
19.4.1.3. Oceania
19.4.1.4. Rest of South Asia & Pacific
19.4.2. By Extruder Type
19.4.3. By End Use
19.5. Market Attractiveness Analysis
19.5.1. By Country
19.5.2. By Extruder Type
19.5.3. By End Use
19.6. Market Trends
19.7. Key Market Participants - Intensity Mapping
19.8. Drivers and Restraints - Impact Analysis
20. East Asia Market Analysis 2018 to 2022 and Forecast 2023 to 2033
20.1. Introduction
20.2. Pricing Analysis
20.3. Historical Market Size (US$ Million) and Volume Trend Analysis By Market Taxonomy, 2018 to 2022
20.4. Market Size (US$ Million) and Volume Forecast By Market Taxonomy, 2023 to 2033
20.4.1. By Country
20.4.1.1. China
20.4.1.2. Japan
20.4.1.3. South Korea
20.4.2. By Extruder Type
20.4.3. By End Use
20.5. Market Attractiveness Analysis
20.5.1. By Country
20.5.2. By Extruder Type
20.5.3. By End Use
20.6. Market Trends
20.7. Key Market Participants - Intensity Mapping
20.8. Drivers and Restraints - Impact Analysis
21. Middle East and Africa Market Analysis 2018 to 2022 and Forecast 2023 to 2033
21.1. Introduction
21.2. Pricing Analysis
21.3. Historical Market Size (US$ Million) and Volume Trend Analysis By Market Taxonomy, 2018 to 2022
21.4. Market Size (US$ Million) and Volume Forecast By Market Taxonomy, 2023 to 2033
21.4.1. By Country
21.4.1.1. GCC Countries
21.4.1.2. Türkiye
21.4.1.3. Northern Africa
21.4.1.4. South Africa
21.4.1.5. Rest of Middle East and Africa
21.4.2. By Extruder Type
21.4.3. By End Use
21.5. Market Attractiveness Analysis
21.5.1. By Country
21.5.2. By Extruder Type
21.5.3. By End Use
21.6. Market Trends
21.7. Key Market Participants - Intensity Mapping
21.8. Drivers and Restraints - Impact Analysis
22. Country-wise Market Analysis
22.1. Introduction
22.1.1. Market Value Proportion Analysis, By Key Countries
22.1.2. Global Vs. Country Growth Comparison
22.2. U.S. Market Analysis
22.2.1. By Extruder Type
22.2.2. By End Use
22.3. Canada Market Analysis
22.3.1. By Extruder Type
22.3.2. By End Use
22.4. Mexico Market Analysis
22.4.1. By Extruder Type
22.4.2. By End Use
22.5. Brazil Market Analysis
22.5.1. By Extruder Type
22.5.2. By End Use
22.6. Argentina Market Analysis
22.6.1. By Extruder Type
22.6.2. By End Use
22.7. Germany Market Analysis
22.7.1. By Extruder Type
22.7.2. By End Use
22.8. Italy Market Analysis
22.8.1. By Extruder Type
22.8.2. By End Use
22.9. France Market Analysis
22.9.1. By Extruder Type
22.9.2. By End Use
22.10. U.K. Market Analysis
22.10.1. By Extruder Type
22.10.2. By End Use
22.11. Spain Market Analysis
22.11.1. By Extruder Type
22.11.2. By End Use
22.12. NORDICS Market Analysis
22.12.1. By Extruder Type
22.12.2. By End Use
22.13. Poland Market Analysis
22.13.1. By Extruder Type
22.13.2. By End Use
22.14. Hungary Market Analysis
22.14.1. By Extruder Type
22.14.2. By End Use
22.15. Romania Market Analysis
22.15.1. By Extruder Type
22.15.2. By End Use
22.16. Czech Republic Market Analysis
22.16.1. By Extruder Type
22.16.2. By End Use
22.17. China Market Analysis
22.17.1. By Extruder Type
22.17.2. By End Use
22.18. Japan Market Analysis
22.18.1. By Extruder Type
22.18.2. By End Use
22.19. S. Korea Market Analysis
22.19.1. By Extruder Type
22.19.2. By End Use
22.20. India Market Analysis
22.20.1. By Extruder Type
22.20.2. By End Use
22.21. ASEAN Market Analysis
22.21.1. By Extruder Type
22.21.2. By End Use
22.22. Australia and New Zealand Market Analysis
22.22.1. By Extruder Type
22.22.2. By End Use
22.23. KSA Market Analysis
22.23.1. By Extruder Type
22.23.2. By End Use
22.24. UAE Market Analysis
22.24.1. By Extruder Type
22.24.2. By End Use
22.25. Northern Africa Market Analysis
22.25.1. By Extruder Type
22.25.2. By End Use
22.26. Turkey Market Analysis
22.26.1. By Extruder Type
22.26.2. By End Use
22.27. South Africa Market Analysis
22.27.1. By Extruder Type
22.27.2. By End Use
22.28. Israel Market Analysis
22.28.1. By Extruder Type
22.28.2. By End Use
23. Market Structure Analysis
23.1. Market Analysis by Tier of Companies (Pipe Screw Extruder)
23.2. Market Concentration
23.3. Market Share Analysis of Top Players
23.4. Production Capacity Analysis
23.5. Market Presence Analysis
23.5.1. By Category-C Footprint of Players
23.5.2. By Regional Footprint of Players
23.5.3. By Channel Footprint of Players
24. Competition Analysis
24.1. Competition Dashboard
24.2. Competition Benchmarking
24.3. Competition Deep Dive
24.3.1. Eaton Corporation plc
24.3.1.1. Overview
24.3.1.2. Product Portfolio
24.3.1.3. Profitability by Market Segments (Product/Channel/Region)
24.3.1.4. Sales Footprint
24.3.1.5. Strategy Overview
24.3.2. ITT Inc.
24.3.2.1. Overview
24.3.2.2. Product Portfolio
24.3.2.3. Profitability by Market Segments (Product/Channel/Region)
24.3.2.4. Sales Footprint
24.3.2.5. Strategy Overview
24.3.3. Parker Hannifin Corporation
24.3.3.1. Overview
24.3.3.2. Product Portfolio
24.3.3.3. Profitability by Market Segments (Product/Channel/Region)
24.3.3.4. Sales Footprint
24.3.3.5. Strategy Overview
24.3.4. Flowserve Corporation
24.3.4.1. Overview
24.3.4.2. Product Portfolio
24.3.4.3. Profitability by Market Segments (Product/Channel/Region)
24.3.4.4. Sales Footprint
24.3.4.5. Strategy Overview
24.3.5. Graco Inc.
24.3.5.1. Overview
24.3.5.2. Product Portfolio
24.3.5.3. Profitability by Market Segments (Product/Channel/Region)
24.3.5.4. Sales Footprint
24.3.5.5. Strategy Overview
24.3.6. Rotork plc
24.3.6.1. Overview
24.3.6.2. Product Portfolio
24.3.6.3. Profitability by Market Segments (Product/Channel/Region)
24.3.6.4. Sales Footprint
24.3.6.5. Strategy Overview
24.3.7. Rotomac International Limited
24.3.7.1. Overview
24.3.7.2. Product Portfolio
24.3.7.3. Profitability by Market Segments (Product/Channel/Region)
24.3.7.4. Sales Footprint
24.3.7.5. Strategy Overview
24.3.8. Schlumberger Limited
24.3.8.1. Overview
24.3.8.2. Product Portfolio
24.3.8.3. Profitability by Market Segments (Product/Channel/Region)
24.3.8.4. Sales Footprint
24.3.8.5. Strategy Overview
24.3.9. Cameron International Corporation
24.3.9.1. Overview
24.3.9.2. Product Portfolio
24.3.9.3. Profitability by Market Segments (Product/Channel/Region)
24.3.9.4. Sales Footprint
24.3.9.5. Strategy Overview
24.3.10. Weir Group plc
24.3.10.1. Overview
24.3.10.2. Product Portfolio
24.3.10.3. Profitability by Market Segments (Product/Channel/Region)
24.3.10.4. Sales Footprint
24.3.10.5. Strategy Overview
24.3.11. Metso Corporation
24.3.11.1. Overview
24.3.11.2. Product Portfolio
24.3.11.3. Profitability by Market Segments (Product/Channel/Region)
24.3.11.4. Sales Footprint
24.3.11.5. Strategy Overview
24.3.12. Flowserve Corporation
24.3.12.1. Overview
24.3.12.2. Product Portfolio
24.3.12.3. Profitability by Market Segments (Product/Channel/Region)
24.3.12.4. Sales Footprint
24.3.12.5. Strategy Overview
25. Primary Insights
26. Assumptions and Acronyms Used
27. Research Methodology
Explore Industrial Automation Insights
View Reports