Physical Therapy Supplies Market Outlook from 2025 to 2035

The physical therapy supplies market is experiencing steady expansion, driven by increased demand for rehabilitation care, rising sports injuries, and an aging population with mobility challenges. Healthcare system reports and hospital procurement data have highlighted sustained investments in physiotherapy departments, particularly in outpatient and home-based care settings.

Technological enhancements in treatment modalities, such as portable and high-frequency ultrasound therapy devices, have further supported clinical adoption across a wide range of specialties. Additionally, awareness campaigns promoting early musculoskeletal care and injury prevention have improved access to physiotherapy services for non-geriatric populations.

Insurance coverage for physical therapy sessions and supportive health policies in both developed and developing regions have contributed to increased utilization of physical therapy supplies. Looking forward, the market is expected to witness consistent growth, supported by advancements in ergonomic therapy tools, digital physiotherapy platforms, and the expansion of musculoskeletal care programs. Segmental leadership is anticipated to continue across ultrasound devices, non-geriatric demographics, and musculoskeletal applications due to their broad therapeutic scope, preventive care focus, and integration in routine rehabilitation protocols.
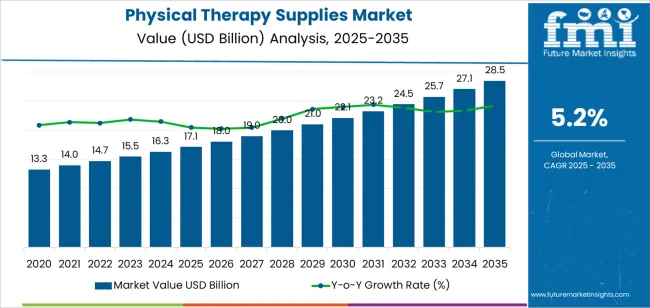
Quick Stats for Physical Therapy Supplies Market

  • Physical Therapy Supplies Market Industry Value (2025): USD 17.1 billion
  • Physical Therapy Supplies Market Forecast Value (2035): USD 28.5 billion
  • Physical Therapy Supplies Market Forecast CAGR: 5.2%
  • Leading Segment in Physical Therapy Supplies Market in 2025: Ultrasound (42.0%)
  • Key Growth Region in Physical Therapy Supplies Market: North America, Asia-Pacific, Europe
  • Top Key Players in Physical Therapy Supplies Market: BTL, EMS Physio Ltd., Dynatronics Corporation, RICHMAR, Performance Health, Storz Medical AG, Zimmer MedizinSysteme GmbH, ITO Co. Ltd., Enraf‑Nonius, Whitehall Manufacturing

Physical Therapy Supplies Market Market Value Analysis

Metric Value
Physical Therapy Supplies Market Estimated Value in (2025 E) USD 17.1 billion
Physical Therapy Supplies Market Forecast Value in (2035 F) USD 28.5 billion
Forecast CAGR (2025 to 2035) 5.2%

Segmental Analysis

The market is segmented by Type, Demographics, Application, and End Use and region. By Type, the market is divided into Ultrasound, Hydrotherapy, Cryotherapy, Continuous Passive Motion, Electric Stimulation, Heat Therapy, Therapeutic Exercise, and Others. In terms of Demographics, the market is classified into Non‑Geriatric Population and Geriatric Population. Based on Application, the market is segmented into Musculoskeletal, Neurology, Pediatrics, Cardiovascular & Pulmonary, and Other Applications. By End Use, the market is divided into Hospitals & Clinics, Rehabilitation Centers, and Others. Regionally, the market is classified into North America, Latin America, Western Europe, Eastern Europe, Balkan & Baltic Countries, Russia & Belarus, Central Asia, East Asia, South Asia & Pacific, and the Middle East & Africa.
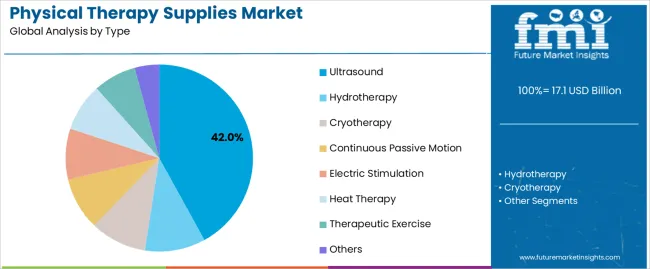
Insights into the Type Segment: Ultrasound

Physical Therapy Supplies Market Analysis By Type

The Ultrasound segment is projected to account for 42.0% of the physical therapy supplies market revenue in 2025, maintaining its dominance due to its effectiveness in deep tissue stimulation and accelerated healing. Growth in this segment has been driven by increased clinical reliance on ultrasound therapy for treating soft tissue injuries, inflammation, and chronic pain.

Healthcare providers have favored ultrasound devices for their non-invasive nature, portability, and ability to enhance blood flow and cellular repair processes. Advancements in device miniaturization and user-friendly digital interfaces have facilitated widespread use in both clinical and home care environments.

Moreover, manufacturers have developed cost-effective models catering to physiotherapy clinics, sports centers, and rehabilitation facilities. As musculoskeletal disorders and sports-related injuries become more common across all age groups, the demand for therapeutic ultrasound is expected to remain strong, sustaining the segment’s market leadership.
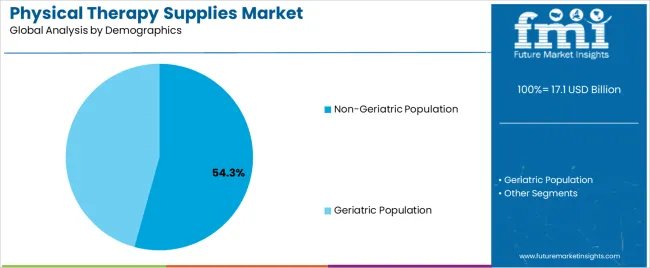
Insights into the Demographics Segment: Non-Geriatric Population

Physical Therapy Supplies Market Analysis By Demographics

The Non-Geriatric Population segment is projected to contribute 54.3% of the physical therapy supplies market revenue in 2025, leading the demographic segmentation. Growth in this segment has been supported by rising physical activity levels, increasing participation in sports and fitness routines, and a surge in workplace-related musculoskeletal conditions.

Younger adults have increasingly sought early intervention for pain management and injury prevention, leading to greater utilization of physical therapy services. Corporate wellness programs and preventive care initiatives have also played a role in encouraging therapy engagement among working-age individuals.

Additionally, non-geriatric populations have demonstrated higher adoption of digital physical therapy tools, including app-based exercise tracking and portable therapy devices. The segment's prominence reflects the broader trend of proactive health management and the growing recognition of physical therapy’s role in long-term musculoskeletal wellness.
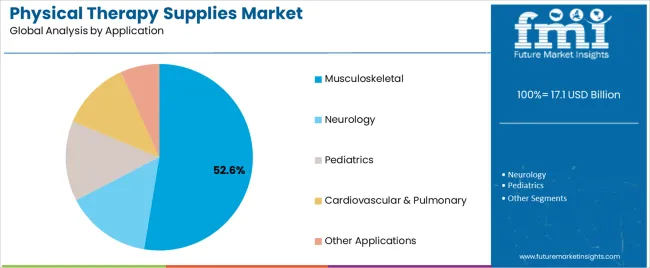
Insights into the Application Segment: Musculoskeletal

Physical Therapy Supplies Market Analysis By Application

The Musculoskeletal segment is projected to represent 52.6% of the physical therapy supplies market revenue in 2025, establishing itself as the largest application area. This growth has been driven by the high prevalence of conditions such as back pain, arthritis, ligament injuries, and post-surgical rehabilitation needs.

Clinical guidelines and orthopedic care protocols have increasingly incorporated physical therapy as a first-line or adjunct treatment for musculoskeletal disorders. Healthcare providers have emphasized early mobilization and targeted exercises to improve patient outcomes and reduce surgical intervention risks.

The rise in sedentary lifestyles and ergonomic stress among the global working population has further increased the incidence of musculoskeletal complaints. Innovations in therapy equipment specifically designed for joint mobilization, muscle strengthening, and postural correction have also expanded treatment capabilities. With musculoskeletal conditions continuing to be a leading cause of disability worldwide, this segment is expected to retain its dominant role in the market.

Semi Annual Market Update

Based on several semi-annual periods from 2025 through 2035, the following table illustrates the anticipated CAGR for physical therapy supplies. A CAGR of 5.2% is predicted for the first half (H1) of the decade from 2025 to 2035, followed by an attenuated 4.9% growth rate in the second half (H2).

Particular Value CAGR
H1 5.2% (2025 to 2035)
H2 5% (2025 to 2035)
H1 4.9% (2025 to 2035)
H2 4.6% (2025 to 2035)

Moving forward into the next period, from H1 2025 to H2 2035, the annual CAGR is projected to reach 4.9% in the first half and remain relatively low at 4.6% in the second half.

Key Industry Highlights

Aging Population and Advanced Technologies to Drive Physical Therapy Supplies Market

Physical therapy supplies are driven by an aging population worldwide since older adults are more likely to have conditions related to mobility, arthritis, and osteoporosis.

A rising incidence of chronic diseases such as cardiovascular diseases, diabetes, and obesity is leading to an increase in long-term physical therapy demand. As physical therapy continues to be acknowledged and adopted as an effective method of recovery and rehabilitation, the industry is expected to grow further.

A number of technological advances are improving the efficiency and accessibility of physical therapy, such as augmented reality, robotic rehabilitation devices, and telehealth solutions. Numerous government funding programs and reimbursement policies contribute to the accessibility and affordability of physical therapy.

A combination of these factors creates a robust industry environment for manufacturers and suppliers supplying physical therapy supplies. As a result, the demand for physical therapy supplies is on the rise.

Wearable Technologies and Home Care Services Contribute to a Growing Trend

The use of online and remote physical therapy services has increased significantly in recent years. With the COVID-19 pandemic in full swing, therapy services have become more convenient and accessible for clients.

With the introduction of wearable technology, patients can track and monitor their progress in real-time, allowing personalized therapy and improved outcomes.

The use of artificial intelligence and machine learning in physical therapy practices is allowing practitioners to create personalized treatment plans and predict outcomes. In addition to preventive care, physical therapy is proving to be increasingly popular with patients in order to prevent serious health problems from occurring in the future.

In recent years, overall health and fitness have become increasingly important. The industry for patients wishing to receive physical therapy at home has also grown as portable and easy-to-use home-based physical therapy equipment has become available.

Physical Therapy Supplies will Benefit from Digital Health Technologies

Developing and offering a wide assortment of physical therapy supplies, including advanced therapeutic devices, exercise equipment, and components, will increase sales. To enhance the adoption and loyalty of physical therapy products, educational initiatives and training programs are being introduced to keep physical therapists informed about the latest techniques and products.

Increased customer satisfaction and recurring business can be achieved by providing better service, extensive support, and user-friendly products.

New markets have seen a rise in physical therapy as healthcare infrastructure has improved, providing significant opportunities to industry players. Investment in research and development can lead to higher industry shares with innovative products such as smart rehabilitation devices, advanced exercise equipment, and user-friendly home therapy programs.

Using digital health technologies can help patients engage in therapy and adhere to treatment regimens, from tracking therapy with mobile apps to immersive therapy sessions using virtual reality.

The development of personalized therapy solutions based on data analytics and feedback from patients can result in improved therapy outcomes and improved patient satisfaction, resulting in increased brand loyalty.

Regulatory Uncertainty Regarding Physical Therapy Supplies May Restrict Industry Growth

Small clinics and individuals seeking to use physical therapy goods at home may find purchasing physical therapy goods to be a costly endeavor.

The development and promotion of new products and machinery may be affected by several rules and regulations in the physical therapy field. The process of overcoming these regulatory barriers can be time-consuming and expensive for producers.

Modifications to healthcare insurance policies and coverage significantly impact the cost of care incurred by patients. The result could be a reduction in quality and a variation in services. The cost of healthcare can restrict patient's access to healthcare services, resulting in situations where they cannot receive necessary treatment.

Insurance policies and government programs may restrict clinics from investing in the latest technologies. Physical therapy clinics might have difficulty comparing products and making wise purchases when industry standards do not exist. The lack of consistency could adversely affect patient safety and outcomes.

2020 to 2024 Physical Therapy Supplies Sales Outlook Compared to Demand Forecast from 2025 to 2035

The physical therapy supplies market registered a CAGR of 4.9% during the historical period between 2020 and 2025. A value of USD 17.1 billion was achieved in 2025 for the physical therapy supplies market, up from USD 13.3 billion in 2020.

Positive growth was observed in the physical therapy supplies market as cost-saving and remote service initiatives gained traction. In addition to improving rehabilitation outcomes, multidisciplinary approaches have been found to be effective.

Some physical therapy practices let their patients download apps for their phones. It is possible for patients using these apps to contact their physical therapy doctors, view their own statistics, and even follow instructions on how to carry out guided exercises through the use of these apps.

A few decades have passed since myofascial release treatment was introduced, but the tools that are used are always changing. By using these tools, therapists are able to provide more effective treatments for myofascial release.

The World Health Organization estimates that one out of three people in the world suffers from chronic pain. Having pain is one of the leading causes of lost productivity, which in turn has a significant impact on the economy. Diabetes, hypertension, cancer, and arthritis are common chronic diseases associated with acute pain.

Physical therapy procedures are made easier and more efficient when robotic devices are utilized in robot-assisted therapy.

In addition to helping with repetitive workouts, these tools can also give patients and therapists real-time feedback about their progress as well as enable precise and controlled movements during the workout. Several illnesses have shown promising outcomes with robot-assisted therapy, including spinal cord injury and stroke recovery.

Market Concentration

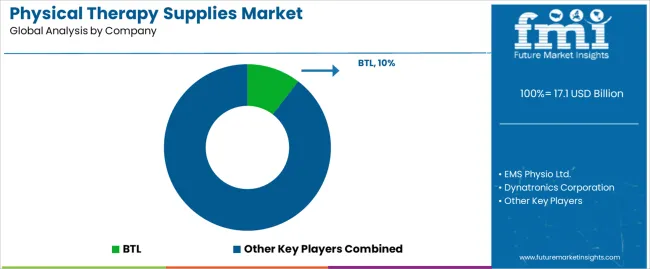
Tier 1 companies represent industry leaders, capturing a sizeable industry share of 27% in the global industry. These are companies that provide direct service to consumers, businesses, or original equipment manufacturers (OEMs).

Companies in the physical therapy supplies market tend to be larger, well-established corporations whose products are distributed directly to patients, clinics, and hospitals. Businesses with strong brands, good distribution networks, and the ability to launch new products quickly are the best.

Since they have direct industry access and can react quickly to changes in demand, they tend to do well. Prominent companies within Tier 1 include BLT, Performance Health, Zimmer MedizinSysteme GmbH, and Storz Medical AG.

Mid-size players in Tier 2, with a 33% market share, have a strong presence in specific regions and influence local markets. Their strengths include a strong overseas presence and a detailed understanding of their markets. Parts and components are supplied to Tier 1 companies by Tier 2 companies.

Companies involved in such production may manufacture components or materials used in the production of physical therapy equipment. Despite not directly dealing with end customers, these businesses make up an integral part of the supply chain. Tier 2 companies include Dynatronics Corporation, RICHMAR, EMS Physio Ltd., and Enraf-Nonius.

Tier 3 consists mostly of small businesses with a local presence that serves niche markets. Companies in Tier 3 typically supply basic components or raw materials to Tier 2 companies. Industry fluctuations can significantly impact the performance of these firms since they often are farther from the final product.

The success of their operations is often inextricably linked to the health of the industry as well as their ability to provide the necessary materials for the broader supply chain. Low margins and high volumes determine their performance, making them more vulnerable to raw material price fluctuations. Players include ITO Co. Ltd, and Whitehall Manufacturing.

Country-wise Insights

Detailed industry analysis of physical therapy supplies markets are provided for different countries. An analysis of industry demand is provided for several regions around the world, including North America, Europe, Asia Pacific, and others.

The United States is anticipated to remain at the forefront in North America, with a value share of 77.6% through 2035. In Asia Pacific, South Korea is projected to witness a CAGR of 4.7% by 2035.

Countries Value CAGR (2025 to 2035)
United States 5%
Canada 3.9%
United Kingdom 5.1%
Germany 5.4%
India 6.1%
China 5.8%
Thailand 5.5%

Reimbursement Policies to Boost Sales for Physical Therapy Supplies in the United States

Physical therapy in the United States is expected to experience a significant increase in demand in the future. Numerous factors have contributed to the demand for these services, including the aging population and the desire to remain active in retirement. Physical therapy is vital for older people suffering from heart attacks, strokes, and impaired mobility that require rehabilitation.

Favorable reimbursement policies and insurance coverage are fueling business growth. Since the Affordable Care Act and other healthcare reforms have improved rehabilitation services' coverage, a greater number of people are able to access physical therapy. This increases the demand for physical therapy supplies as physical therapy services become more prevalent.

Sport and Fitness-Related Injuries to Fuel Demand in the United Kingdom

The United Kingdom industry is expected to show significant growth over the next few years. Over the forecast period, the industry is projected to expand at a CAGR of 5.1%. The rising prevalence of musculoskeletal disorders in the United Kingdom is driving demand for physical therapy supplies.

A growing focus on various forms of research and development and government funding to increase growth. In addition, physical therapy is becoming more widely recognized as a treatment option, thereby increasing industry growth.

Increased participation in physical activities is driving interest in fitness and sports in the United Kingdom. The increased number of sports-related injuries calls for the development of more tools and services in the field of physical therapy. Sedentary lifestyles and government initiatives promoting exercise are also contributing to this trend.

An Influx of Rehabilitation Centers in India Push the Physical Therapy Supplies Market

A positive growth trajectory is being shown in the industry for physical therapy supplies in India. The industry in India is likely to expand at a CAGR of 6.1% from 2025 to 2035.

Private healthcare facilities and specialist clinics are increasing, driving demand for physical therapy services. In addition to improving accessibility and affordability of healthcare, government initiatives also aid the industry's growth. The availability of affordable healthcare services will further boost the industry's demand.

A rise in medical tourism and the expansion of rehabilitation centers will enhance the country's economic growth. Healthcare centers will increase initiatives and introduce therapy programs in the coming years, which will lead to an expansion of the industry.

As awareness of aquatic therapies grows and adoption increases, the industry will flourish. The availability of different insurance plans and the demand for effective treatments have led to consumers adopting therapies remotely from their houses.

Category-wise Insights

Information about the industry's leading segments is provided in this section. The ultrasound segment accounted for 42% of the value share in 2025. Based on the application, musculoskeletal had a market share of 63.4% in 2025.

Handheld Devices and Innovation will Dominate the Industry for Ultrasound Physical Therapy Supplies

Type Ultrasound
Value Share (2025) 42%

The ultrasound segment held the largest industry share in terms of revenue, accounting for approximately 42% of the industry in 2025. Musculoskeletal issues can be successfully treated using ultrasound therapy, which reduces pain and promotes tissue healing. The popularity of it has led to a spike in demand for physical therapy supplies and equipment.

Professionals and physiotherapists utilize a therapeutic ultrasound device to treat pain issues and promote tissue healing. Ultrasound therapy uses sound waves that are outside the range of human hearing in order to treat ailments such as runner's knee and muscle strains. The benefits of ultrasound therapy are becoming more apparent to both patients and medical professionals.

Physical therapists are receiving more training in ultrasound procedures each year, resulting in an increase in adoption rates, which in turn leads to a rise in the demand for ultrasound supplies.

The advancement of ultrasound technology, including portable and handheld devices, has streamlined the integration of ultrasound therapy into physical therapy procedures and opened up new avenues for ultrasound therapy. As a result of these developments, clinics are now using ultrasonography more frequently, thereby increasing the demand for items related to ultrasonography.

Musculoskeletal Practices Use Most Physical Therapy Supplies

Application Musculoskeletal
Value Share (2025) 63.4%

The musculoskeletal segment generated 63.4% of revenue in 2025. Musculoskeletal physiotherapy is one aspect of physical therapy that focuses on identifying, managing, and preventing musculoskeletal disorders.

Various alignments, such as tendons, muscle strains, and joint pain, are addressed. A major objective of musculoskeletal physiotherapy is to increase mobility, strength, and flexibility while alleviating pain and inflammation.

Musculoskeletal physiotherapy is one of the most crucial aspects of many healing therapies. Musculoskeletal care includes identifying, managing, and avoiding conditions that can affect the body.

A wide range of supplies and equipment are utilized in musculoskeletal physical therapy, including electrical muscle stimulation equipment, orthopedic immobilization devices, rehabilitation equipment, and isokinetic devices. By using these tools, therapists can provide efficient and thorough treatment for patients with musculoskeletal conditions.’

Patients with musculoskeletal conditions may also benefit from exercise programs recommended by physical therapists. A physical therapist may also employ manual therapy techniques such as manipulations, mobilizations, and massages along with exercises to relieve pain and increase mobility.

Physiotherapists can use exercises and stretches as part of the process of improving mobility, strength, and flexibility. Patients can benefit from these exercises when combined with other treatments to meet their specific needs.
Competitive Landscape

Physical Therapy Supplies Market Analysis By Company

Manufacturers are adopting a variety of marketing strategies to reach potential buyers and expand their customer base, including launching new products, expanding globally, and partnering.

Recent Industry Developments in Physical Therapy Supplies Market

  • In April 2025, Performance Health, a leading healthcare provider, introduced SISSEL® products as part of its comprehensive wellness offering. By partnering with Performance Health, SISSEL® will be able to offer its vast network of clinicians and consumers natural and effective options for well-being.

Key Players of the Physical Therapy Supplies Industry

  • BTL
  • EMS Physio Ltd.
  • Dynatronics Corporation
  • RICHMAR
  • Performance Health
  • Storz Medical AG
  • Zimmer MedizinSysteme GmbH
  • ITO Co. Ltd.
  • Enraf-Nonius
  • Whitehall Manufacturing

Key Segments of the Physical Therapy Supplies Market

By Type:

In terms of type, the industry is divided into hydrotherapy, cryotherapy, continuous passive motion, ultrasound, electric stimulation, heat therapy, therapeutic exercise, and others.

By Demographics:

In terms of capacity, the industry is segregated into a non-geriatric population and, a geriatric population.

By Application:

In terms of application, the industry is segmented into neurology (stroke, spinal cord injuries, Parkinson’s disease, multiple sclerosis, cerebral palsy, and others), musculoskeletal, pediatrics, cardiovascular & pulmonary, and others.

By End-use:

The industry is classified by end-use industries as hospitals & clinics, rehabilitation centers, and others.

By Region:

Key countries of North America, Latin America, Western Europe, Eastern Europe, South Asia, East Asia, Middle East and Africa have been covered in the report.

Frequently Asked Questions

How big is the physical therapy supplies market in 2025?

The global physical therapy supplies market is estimated to be valued at USD 17.1 billion in 2025.

What will be the size of physical therapy supplies market in 2035?

The market size for the physical therapy supplies market is projected to reach USD 28.5 billion by 2035.

How much will be the physical therapy supplies market growth between 2025 and 2035?

The physical therapy supplies market is expected to grow at a 5.2% CAGR between 2025 and 2035.

What are the key product types in the physical therapy supplies market?

The key product types in physical therapy supplies market are ultrasound, hydrotherapy, cryotherapy, continuous passive motion, electric stimulation, heat therapy, therapeutic exercise and others.

Which demographics segment to contribute significant share in the physical therapy supplies market in 2025?

In terms of demographics, non‑geriatric population segment to command 54.3% share in the physical therapy supplies market in 2025.

Table of Content

  1. Executive Summary
    • Global Market Outlook
    • Demand to side Trends
    • Supply to side Trends
    • Technology Roadmap Analysis
    • Analysis and Recommendations
  2. Market Overview
    • Market Coverage / Taxonomy
    • Market Definition / Scope / Limitations
  3. Market Background
    • Market Dynamics
      • Drivers
      • Restraints
      • Opportunity
      • Trends
    • Scenario Forecast
      • Demand in Optimistic Scenario
      • Demand in Likely Scenario
      • Demand in Conservative Scenario
    • Opportunity Map Analysis
    • Product Life Cycle Analysis
    • Supply Chain Analysis
    • Investment Feasibility Matrix
    • Value Chain Analysis
    • PESTLE and Porter’s Analysis
    • Regulatory Landscape
    • Regional Parent Market Outlook
    • Production and Consumption Statistics
    • Import and Export Statistics
  4. Global Market Analysis 2020 to 2024 and Forecast, 2025 to 2035
    • Historical Market Size Value (USD Million) Analysis, 2020 to 2024
    • Current and Future Market Size Value (USD Million) Projections, 2025 to 2035
      • Y to o to Y Growth Trend Analysis
      • Absolute $ Opportunity Analysis
  5. Global Market Pricing Analysis 2020 to 2024 and Forecast 2025 to 2035
  6. Global Market Analysis 2020 to 2024 and Forecast 2025 to 2035, By Type
    • Introduction / Key Findings
    • Historical Market Size Value (USD Million) Analysis By Type , 2020 to 2024
    • Current and Future Market Size Value (USD Million) Analysis and Forecast By Type , 2025 to 2035
      • Ultrasound
      • Hydrotherapy
      • Cryotherapy
      • Continuous Passive Motion
      • Electric Stimulation
      • Heat Therapy
      • Therapeutic Exercise
      • Others
    • Y to o to Y Growth Trend Analysis By Type , 2020 to 2024
    • Absolute $ Opportunity Analysis By Type , 2025 to 2035
  7. Global Market Analysis 2020 to 2024 and Forecast 2025 to 2035, By Demographics
    • Introduction / Key Findings
    • Historical Market Size Value (USD Million) Analysis By Demographics, 2020 to 2024
    • Current and Future Market Size Value (USD Million) Analysis and Forecast By Demographics, 2025 to 2035
      • Non‑Geriatric Population
      • Geriatric Population
    • Y to o to Y Growth Trend Analysis By Demographics, 2020 to 2024
    • Absolute $ Opportunity Analysis By Demographics, 2025 to 2035
  8. Global Market Analysis 2020 to 2024 and Forecast 2025 to 2035, By Application
    • Introduction / Key Findings
    • Historical Market Size Value (USD Million) Analysis By Application, 2020 to 2024
    • Current and Future Market Size Value (USD Million) Analysis and Forecast By Application, 2025 to 2035
      • Musculoskeletal
      • Neurology
        • Stroke
        • Spinal Cord Injuries
        • Parkinson’s Disease
        • Multiple Sclerosis
        • Cerebral Palsy
      • Pediatrics
      • Cardiovascular & Pulmonary
      • Other Applications
    • Y to o to Y Growth Trend Analysis By Application, 2020 to 2024
    • Absolute $ Opportunity Analysis By Application, 2025 to 2035
  9. Global Market Analysis 2020 to 2024 and Forecast 2025 to 2035, By End Use
    • Introduction / Key Findings
    • Historical Market Size Value (USD Million) Analysis By End Use, 2020 to 2024
    • Current and Future Market Size Value (USD Million) Analysis and Forecast By End Use, 2025 to 2035
      • Hospitals & Clinics
      • Rehabilitation Centers
      • Others
    • Y to o to Y Growth Trend Analysis By End Use, 2020 to 2024
    • Absolute $ Opportunity Analysis By End Use, 2025 to 2035
  10. Global Market Analysis 2020 to 2024 and Forecast 2025 to 2035, By Region
    • Introduction
    • Historical Market Size Value (USD Million) Analysis By Region, 2020 to 2024
    • Current Market Size Value (USD Million) Analysis and Forecast By Region, 2025 to 2035
      • North America
      • Latin America
      • Western Europe
      • Eastern Europe
      • East Asia
      • South Asia and Pacific
      • Middle East & Africa
    • Market Attractiveness Analysis By Region
  11. North America Market Analysis 2020 to 2024 and Forecast 2025 to 2035, By Country
    • Historical Market Size Value (USD Million) Trend Analysis By Market Taxonomy, 2020 to 2024
    • Market Size Value (USD Million) Forecast By Market Taxonomy, 2025 to 2035
      • By Country
        • USA
        • Canada
        • Mexico
      • By Type
      • By Demographics
      • By Application
      • By End Use
    • Market Attractiveness Analysis
      • By Country
      • By Type
      • By Demographics
      • By Application
      • By End Use
    • Key Takeaways
  12. Latin America Market Analysis 2020 to 2024 and Forecast 2025 to 2035, By Country
    • Historical Market Size Value (USD Million) Trend Analysis By Market Taxonomy, 2020 to 2024
    • Market Size Value (USD Million) Forecast By Market Taxonomy, 2025 to 2035
      • By Country
        • Brazil
        • Chile
        • Rest of Latin America
      • By Type
      • By Demographics
      • By Application
      • By End Use
    • Market Attractiveness Analysis
      • By Country
      • By Type
      • By Demographics
      • By Application
      • By End Use
    • Key Takeaways
  13. Western Europe Market Analysis 2020 to 2024 and Forecast 2025 to 2035, By Country
    • Historical Market Size Value (USD Million) Trend Analysis By Market Taxonomy, 2020 to 2024
    • Market Size Value (USD Million) Forecast By Market Taxonomy, 2025 to 2035
      • By Country
        • Germany
        • UK
        • Italy
        • Spain
        • France
        • Nordic
        • BENELUX
        • Rest of Western Europe
      • By Type
      • By Demographics
      • By Application
      • By End Use
    • Market Attractiveness Analysis
      • By Country
      • By Type
      • By Demographics
      • By Application
      • By End Use
    • Key Takeaways
  14. Eastern Europe Market Analysis 2020 to 2024 and Forecast 2025 to 2035, By Country
    • Historical Market Size Value (USD Million) Trend Analysis By Market Taxonomy, 2020 to 2024
    • Market Size Value (USD Million) Forecast By Market Taxonomy, 2025 to 2035
      • By Country
        • Russia
        • Poland
        • Hungary
        • Balkan & Baltic
        • Rest of Eastern Europe
      • By Type
      • By Demographics
      • By Application
      • By End Use
    • Market Attractiveness Analysis
      • By Country
      • By Type
      • By Demographics
      • By Application
      • By End Use
    • Key Takeaways
  15. East Asia Market Analysis 2020 to 2024 and Forecast 2025 to 2035, By Country
    • Historical Market Size Value (USD Million) Trend Analysis By Market Taxonomy, 2020 to 2024
    • Market Size Value (USD Million) Forecast By Market Taxonomy, 2025 to 2035
      • By Country
        • China
        • Japan
        • South Korea
      • By Type
      • By Demographics
      • By Application
      • By End Use
    • Market Attractiveness Analysis
      • By Country
      • By Type
      • By Demographics
      • By Application
      • By End Use
    • Key Takeaways
  16. South Asia and Pacific Market Analysis 2020 to 2024 and Forecast 2025 to 2035, By Country
    • Historical Market Size Value (USD Million) Trend Analysis By Market Taxonomy, 2020 to 2024
    • Market Size Value (USD Million) Forecast By Market Taxonomy, 2025 to 2035
      • By Country
        • India
        • ASEAN
        • Australia & New Zealand
        • Rest of South Asia and Pacific
      • By Type
      • By Demographics
      • By Application
      • By End Use
    • Market Attractiveness Analysis
      • By Country
      • By Type
      • By Demographics
      • By Application
      • By End Use
    • Key Takeaways
  17. Middle East & Africa Market Analysis 2020 to 2024 and Forecast 2025 to 2035, By Country
    • Historical Market Size Value (USD Million) Trend Analysis By Market Taxonomy, 2020 to 2024
    • Market Size Value (USD Million) Forecast By Market Taxonomy, 2025 to 2035
      • By Country
        • Kingdom of Saudi Arabia
        • Other GCC Countries
        • Turkiye
        • South Africa
        • Other African Union
        • Rest of Middle East & Africa
      • By Type
      • By Demographics
      • By Application
      • By End Use
    • Market Attractiveness Analysis
      • By Country
      • By Type
      • By Demographics
      • By Application
      • By End Use
    • Key Takeaways
  18. Key Countries Market Analysis
    • USA
      • Pricing Analysis
      • Market Share Analysis, 2024
        • By Type
        • By Demographics
        • By Application
        • By End Use
    • Canada
      • Pricing Analysis
      • Market Share Analysis, 2024
        • By Type
        • By Demographics
        • By Application
        • By End Use
    • Mexico
      • Pricing Analysis
      • Market Share Analysis, 2024
        • By Type
        • By Demographics
        • By Application
        • By End Use
    • Brazil
      • Pricing Analysis
      • Market Share Analysis, 2024
        • By Type
        • By Demographics
        • By Application
        • By End Use
    • Chile
      • Pricing Analysis
      • Market Share Analysis, 2024
        • By Type
        • By Demographics
        • By Application
        • By End Use
    • Germany
      • Pricing Analysis
      • Market Share Analysis, 2024
        • By Type
        • By Demographics
        • By Application
        • By End Use
    • UK
      • Pricing Analysis
      • Market Share Analysis, 2024
        • By Type
        • By Demographics
        • By Application
        • By End Use
    • Italy
      • Pricing Analysis
      • Market Share Analysis, 2024
        • By Type
        • By Demographics
        • By Application
        • By End Use
    • Spain
      • Pricing Analysis
      • Market Share Analysis, 2024
        • By Type
        • By Demographics
        • By Application
        • By End Use
    • France
      • Pricing Analysis
      • Market Share Analysis, 2024
        • By Type
        • By Demographics
        • By Application
        • By End Use
    • India
      • Pricing Analysis
      • Market Share Analysis, 2024
        • By Type
        • By Demographics
        • By Application
        • By End Use
    • ASEAN
      • Pricing Analysis
      • Market Share Analysis, 2024
        • By Type
        • By Demographics
        • By Application
        • By End Use
    • Australia & New Zealand
      • Pricing Analysis
      • Market Share Analysis, 2024
        • By Type
        • By Demographics
        • By Application
        • By End Use
    • China
      • Pricing Analysis
      • Market Share Analysis, 2024
        • By Type
        • By Demographics
        • By Application
        • By End Use
    • Japan
      • Pricing Analysis
      • Market Share Analysis, 2024
        • By Type
        • By Demographics
        • By Application
        • By End Use
    • South Korea
      • Pricing Analysis
      • Market Share Analysis, 2024
        • By Type
        • By Demographics
        • By Application
        • By End Use
    • Russia
      • Pricing Analysis
      • Market Share Analysis, 2024
        • By Type
        • By Demographics
        • By Application
        • By End Use
    • Poland
      • Pricing Analysis
      • Market Share Analysis, 2024
        • By Type
        • By Demographics
        • By Application
        • By End Use
    • Hungary
      • Pricing Analysis
      • Market Share Analysis, 2024
        • By Type
        • By Demographics
        • By Application
        • By End Use
    • Kingdom of Saudi Arabia
      • Pricing Analysis
      • Market Share Analysis, 2024
        • By Type
        • By Demographics
        • By Application
        • By End Use
    • Turkiye
      • Pricing Analysis
      • Market Share Analysis, 2024
        • By Type
        • By Demographics
        • By Application
        • By End Use
    • South Africa
      • Pricing Analysis
      • Market Share Analysis, 2024
        • By Type
        • By Demographics
        • By Application
        • By End Use
  19. Market Structure Analysis
    • Competition Dashboard
    • Competition Benchmarking
    • Market Share Analysis of Top Players
      • By Regional
      • By Type
      • By Demographics
      • By Application
      • By End Use
  20. Competition Analysis
    • Competition Deep Dive
      • BTL
        • Overview
        • Product Portfolio
        • Profitability by Market Segments (Product/Age /Sales Channel/Region)
        • Sales Footprint
        • Strategy Overview
          • Marketing Strategy
          • Product Strategy
          • Channel Strategy
      • EMS Physio Ltd.
      • Dynatronics Corporation
      • RICHMAR
      • Performance Health
      • Storz Medical AG
      • Zimmer MedizinSysteme GmbH
      • ITO Co. Ltd.
      • Enraf‑Nonius
      • Whitehall Manufacturing
  21. Assumptions & Acronyms Used
  22. Research Methodology

List of Tables

  • Table 1: Global Market Value (USD Million) Forecast by Region, 2020 to 2035
  • Table 2: Global Market Value (USD Million) Forecast by Type , 2020 to 2035
  • Table 3: Global Market Value (USD Million) Forecast by Demographics, 2020 to 2035
  • Table 4: Global Market Value (USD Million) Forecast by Application, 2020 to 2035
  • Table 5: Global Market Value (USD Million) Forecast by End Use, 2020 to 2035
  • Table 6: North America Market Value (USD Million) Forecast by Country, 2020 to 2035
  • Table 7: North America Market Value (USD Million) Forecast by Type , 2020 to 2035
  • Table 8: North America Market Value (USD Million) Forecast by Demographics, 2020 to 2035
  • Table 9: North America Market Value (USD Million) Forecast by Application, 2020 to 2035
  • Table 10: North America Market Value (USD Million) Forecast by End Use, 2020 to 2035
  • Table 11: Latin America Market Value (USD Million) Forecast by Country, 2020 to 2035
  • Table 12: Latin America Market Value (USD Million) Forecast by Type , 2020 to 2035
  • Table 13: Latin America Market Value (USD Million) Forecast by Demographics, 2020 to 2035
  • Table 14: Latin America Market Value (USD Million) Forecast by Application, 2020 to 2035
  • Table 15: Latin America Market Value (USD Million) Forecast by End Use, 2020 to 2035
  • Table 16: Western Europe Market Value (USD Million) Forecast by Country, 2020 to 2035
  • Table 17: Western Europe Market Value (USD Million) Forecast by Type , 2020 to 2035
  • Table 18: Western Europe Market Value (USD Million) Forecast by Demographics, 2020 to 2035
  • Table 19: Western Europe Market Value (USD Million) Forecast by Application, 2020 to 2035
  • Table 20: Western Europe Market Value (USD Million) Forecast by End Use, 2020 to 2035
  • Table 21: Eastern Europe Market Value (USD Million) Forecast by Country, 2020 to 2035
  • Table 22: Eastern Europe Market Value (USD Million) Forecast by Type , 2020 to 2035
  • Table 23: Eastern Europe Market Value (USD Million) Forecast by Demographics, 2020 to 2035
  • Table 24: Eastern Europe Market Value (USD Million) Forecast by Application, 2020 to 2035
  • Table 25: Eastern Europe Market Value (USD Million) Forecast by End Use, 2020 to 2035
  • Table 26: East Asia Market Value (USD Million) Forecast by Country, 2020 to 2035
  • Table 27: East Asia Market Value (USD Million) Forecast by Type , 2020 to 2035
  • Table 28: East Asia Market Value (USD Million) Forecast by Demographics, 2020 to 2035
  • Table 29: East Asia Market Value (USD Million) Forecast by Application, 2020 to 2035
  • Table 30: East Asia Market Value (USD Million) Forecast by End Use, 2020 to 2035
  • Table 31: South Asia and Pacific Market Value (USD Million) Forecast by Country, 2020 to 2035
  • Table 32: South Asia and Pacific Market Value (USD Million) Forecast by Type , 2020 to 2035
  • Table 33: South Asia and Pacific Market Value (USD Million) Forecast by Demographics, 2020 to 2035
  • Table 34: South Asia and Pacific Market Value (USD Million) Forecast by Application, 2020 to 2035
  • Table 35: South Asia and Pacific Market Value (USD Million) Forecast by End Use, 2020 to 2035
  • Table 36: Middle East & Africa Market Value (USD Million) Forecast by Country, 2020 to 2035
  • Table 37: Middle East & Africa Market Value (USD Million) Forecast by Type , 2020 to 2035
  • Table 38: Middle East & Africa Market Value (USD Million) Forecast by Demographics, 2020 to 2035
  • Table 39: Middle East & Africa Market Value (USD Million) Forecast by Application, 2020 to 2035
  • Table 40: Middle East & Africa Market Value (USD Million) Forecast by End Use, 2020 to 2035

List of Figures

  • Figure 1: Global Market Pricing Analysis
  • Figure 2: Global Market Value (USD Million) Forecast 2020-2035
  • Figure 3: Global Market Value Share and BPS Analysis by Type , 2025 and 2035
  • Figure 4: Global Market Y to o to Y Growth Comparison by Type , 2025-2035
  • Figure 5: Global Market Attractiveness Analysis by Type
  • Figure 6: Global Market Value Share and BPS Analysis by Demographics, 2025 and 2035
  • Figure 7: Global Market Y to o to Y Growth Comparison by Demographics, 2025-2035
  • Figure 8: Global Market Attractiveness Analysis by Demographics
  • Figure 9: Global Market Value Share and BPS Analysis by Application, 2025 and 2035
  • Figure 10: Global Market Y to o to Y Growth Comparison by Application, 2025-2035
  • Figure 11: Global Market Attractiveness Analysis by Application
  • Figure 12: Global Market Value Share and BPS Analysis by End Use, 2025 and 2035
  • Figure 13: Global Market Y to o to Y Growth Comparison by End Use, 2025-2035
  • Figure 14: Global Market Attractiveness Analysis by End Use
  • Figure 15: Global Market Value (USD Million) Share and BPS Analysis by Region, 2025 and 2035
  • Figure 16: Global Market Y to o to Y Growth Comparison by Region, 2025-2035
  • Figure 17: Global Market Attractiveness Analysis by Region
  • Figure 18: North America Market Incremental Dollar Opportunity, 2025-2035
  • Figure 19: Latin America Market Incremental Dollar Opportunity, 2025-2035
  • Figure 20: Western Europe Market Incremental Dollar Opportunity, 2025-2035
  • Figure 21: Eastern Europe Market Incremental Dollar Opportunity, 2025-2035
  • Figure 22: East Asia Market Incremental Dollar Opportunity, 2025-2035
  • Figure 23: South Asia and Pacific Market Incremental Dollar Opportunity, 2025-2035
  • Figure 24: Middle East & Africa Market Incremental Dollar Opportunity, 2025-2035
  • Figure 25: North America Market Value Share and BPS Analysis by Country, 2025 and 2035
  • Figure 26: North America Market Value Share and BPS Analysis by Type , 2025 and 2035
  • Figure 27: North America Market Y to o to Y Growth Comparison by Type , 2025-2035
  • Figure 28: North America Market Attractiveness Analysis by Type
  • Figure 29: North America Market Value Share and BPS Analysis by Demographics, 2025 and 2035
  • Figure 30: North America Market Y to o to Y Growth Comparison by Demographics, 2025-2035
  • Figure 31: North America Market Attractiveness Analysis by Demographics
  • Figure 32: North America Market Value Share and BPS Analysis by Application, 2025 and 2035
  • Figure 33: North America Market Y to o to Y Growth Comparison by Application, 2025-2035
  • Figure 34: North America Market Attractiveness Analysis by Application
  • Figure 35: North America Market Value Share and BPS Analysis by End Use, 2025 and 2035
  • Figure 36: North America Market Y to o to Y Growth Comparison by End Use, 2025-2035
  • Figure 37: North America Market Attractiveness Analysis by End Use
  • Figure 38: Latin America Market Value Share and BPS Analysis by Country, 2025 and 2035
  • Figure 39: Latin America Market Value Share and BPS Analysis by Type , 2025 and 2035
  • Figure 40: Latin America Market Y to o to Y Growth Comparison by Type , 2025-2035
  • Figure 41: Latin America Market Attractiveness Analysis by Type
  • Figure 42: Latin America Market Value Share and BPS Analysis by Demographics, 2025 and 2035
  • Figure 43: Latin America Market Y to o to Y Growth Comparison by Demographics, 2025-2035
  • Figure 44: Latin America Market Attractiveness Analysis by Demographics
  • Figure 45: Latin America Market Value Share and BPS Analysis by Application, 2025 and 2035
  • Figure 46: Latin America Market Y to o to Y Growth Comparison by Application, 2025-2035
  • Figure 47: Latin America Market Attractiveness Analysis by Application
  • Figure 48: Latin America Market Value Share and BPS Analysis by End Use, 2025 and 2035
  • Figure 49: Latin America Market Y to o to Y Growth Comparison by End Use, 2025-2035
  • Figure 50: Latin America Market Attractiveness Analysis by End Use
  • Figure 51: Western Europe Market Value Share and BPS Analysis by Country, 2025 and 2035
  • Figure 52: Western Europe Market Value Share and BPS Analysis by Type , 2025 and 2035
  • Figure 53: Western Europe Market Y to o to Y Growth Comparison by Type , 2025-2035
  • Figure 54: Western Europe Market Attractiveness Analysis by Type
  • Figure 55: Western Europe Market Value Share and BPS Analysis by Demographics, 2025 and 2035
  • Figure 56: Western Europe Market Y to o to Y Growth Comparison by Demographics, 2025-2035
  • Figure 57: Western Europe Market Attractiveness Analysis by Demographics
  • Figure 58: Western Europe Market Value Share and BPS Analysis by Application, 2025 and 2035
  • Figure 59: Western Europe Market Y to o to Y Growth Comparison by Application, 2025-2035
  • Figure 60: Western Europe Market Attractiveness Analysis by Application
  • Figure 61: Western Europe Market Value Share and BPS Analysis by End Use, 2025 and 2035
  • Figure 62: Western Europe Market Y to o to Y Growth Comparison by End Use, 2025-2035
  • Figure 63: Western Europe Market Attractiveness Analysis by End Use
  • Figure 64: Eastern Europe Market Value Share and BPS Analysis by Country, 2025 and 2035
  • Figure 65: Eastern Europe Market Value Share and BPS Analysis by Type , 2025 and 2035
  • Figure 66: Eastern Europe Market Y to o to Y Growth Comparison by Type , 2025-2035
  • Figure 67: Eastern Europe Market Attractiveness Analysis by Type
  • Figure 68: Eastern Europe Market Value Share and BPS Analysis by Demographics, 2025 and 2035
  • Figure 69: Eastern Europe Market Y to o to Y Growth Comparison by Demographics, 2025-2035
  • Figure 70: Eastern Europe Market Attractiveness Analysis by Demographics
  • Figure 71: Eastern Europe Market Value Share and BPS Analysis by Application, 2025 and 2035
  • Figure 72: Eastern Europe Market Y to o to Y Growth Comparison by Application, 2025-2035
  • Figure 73: Eastern Europe Market Attractiveness Analysis by Application
  • Figure 74: Eastern Europe Market Value Share and BPS Analysis by End Use, 2025 and 2035
  • Figure 75: Eastern Europe Market Y to o to Y Growth Comparison by End Use, 2025-2035
  • Figure 76: Eastern Europe Market Attractiveness Analysis by End Use
  • Figure 77: East Asia Market Value Share and BPS Analysis by Country, 2025 and 2035
  • Figure 78: East Asia Market Value Share and BPS Analysis by Type , 2025 and 2035
  • Figure 79: East Asia Market Y to o to Y Growth Comparison by Type , 2025-2035
  • Figure 80: East Asia Market Attractiveness Analysis by Type
  • Figure 81: East Asia Market Value Share and BPS Analysis by Demographics, 2025 and 2035
  • Figure 82: East Asia Market Y to o to Y Growth Comparison by Demographics, 2025-2035
  • Figure 83: East Asia Market Attractiveness Analysis by Demographics
  • Figure 84: East Asia Market Value Share and BPS Analysis by Application, 2025 and 2035
  • Figure 85: East Asia Market Y to o to Y Growth Comparison by Application, 2025-2035
  • Figure 86: East Asia Market Attractiveness Analysis by Application
  • Figure 87: East Asia Market Value Share and BPS Analysis by End Use, 2025 and 2035
  • Figure 88: East Asia Market Y to o to Y Growth Comparison by End Use, 2025-2035
  • Figure 89: East Asia Market Attractiveness Analysis by End Use
  • Figure 90: South Asia and Pacific Market Value Share and BPS Analysis by Country, 2025 and 2035
  • Figure 91: South Asia and Pacific Market Value Share and BPS Analysis by Type , 2025 and 2035
  • Figure 92: South Asia and Pacific Market Y to o to Y Growth Comparison by Type , 2025-2035
  • Figure 93: South Asia and Pacific Market Attractiveness Analysis by Type
  • Figure 94: South Asia and Pacific Market Value Share and BPS Analysis by Demographics, 2025 and 2035
  • Figure 95: South Asia and Pacific Market Y to o to Y Growth Comparison by Demographics, 2025-2035
  • Figure 96: South Asia and Pacific Market Attractiveness Analysis by Demographics
  • Figure 97: South Asia and Pacific Market Value Share and BPS Analysis by Application, 2025 and 2035
  • Figure 98: South Asia and Pacific Market Y to o to Y Growth Comparison by Application, 2025-2035
  • Figure 99: South Asia and Pacific Market Attractiveness Analysis by Application
  • Figure 100: South Asia and Pacific Market Value Share and BPS Analysis by End Use, 2025 and 2035
  • Figure 101: South Asia and Pacific Market Y to o to Y Growth Comparison by End Use, 2025-2035
  • Figure 102: South Asia and Pacific Market Attractiveness Analysis by End Use
  • Figure 103: Middle East & Africa Market Value Share and BPS Analysis by Country, 2025 and 2035
  • Figure 104: Middle East & Africa Market Value Share and BPS Analysis by Type , 2025 and 2035
  • Figure 105: Middle East & Africa Market Y to o to Y Growth Comparison by Type , 2025-2035
  • Figure 106: Middle East & Africa Market Attractiveness Analysis by Type
  • Figure 107: Middle East & Africa Market Value Share and BPS Analysis by Demographics, 2025 and 2035
  • Figure 108: Middle East & Africa Market Y to o to Y Growth Comparison by Demographics, 2025-2035
  • Figure 109: Middle East & Africa Market Attractiveness Analysis by Demographics
  • Figure 110: Middle East & Africa Market Value Share and BPS Analysis by Application, 2025 and 2035
  • Figure 111: Middle East & Africa Market Y to o to Y Growth Comparison by Application, 2025-2035
  • Figure 112: Middle East & Africa Market Attractiveness Analysis by Application
  • Figure 113: Middle East & Africa Market Value Share and BPS Analysis by End Use, 2025 and 2035
  • Figure 114: Middle East & Africa Market Y to o to Y Growth Comparison by End Use, 2025-2035
  • Figure 115: Middle East & Africa Market Attractiveness Analysis by End Use
  • Figure 116: Global Market - Tier Structure Analysis
  • Figure 117: Global Market - Company Share Analysis
Dashboard
Dashboard
Dashboard
Dashboard
Dashboard
Dashboard

Full Research Suite comprises of:

Market outlook & trends analysis

Market outlook & trends analysis

Interviews & case studies

Interviews & case studies

Strategic recommendations

Strategic recommendations

Vendor profiles & capabilities analysis

Vendor profiles & capabilities analysis

5-year forecasts

5-year forecasts

8 regions and 60+ country-level data splits

8 regions and 60+ country-level data splits

Market segment data splits

Market segment data splits

12 months of continuous data updates

12 months of continuous data updates

DELIVERED AS:

PDF EXCEL ONLINE

Full Research Suite


$5000

$7500

$10000

Buy Report Now
Similar Industry Reports

Similar Industry Reports

Physical-Digital Integration Market

Physical-Digital Integration Market Size and Share Forecast Outlook 2025 to 2035

Physical Security Information Management (PSIM) Market

Physical Security Information Management (PSIM) Market Size and Share Forecast Outlook 2025 to 2035

Physical Security Market

Physical Security Market Insights - Growth & Forecast through 2034

Physical Security Equipment Market

Physical Security Equipment Market Analysis – Growth & Trends 2017-2027

Cyber-Physical System Market

Cyber-Physical System Market Size and Share Forecast Outlook 2025 to 2035

Paraffin Physical Therapy Market

Paraffin Physical Therapy Market Size and Share Forecast Outlook 2025 to 2035

IV Therapy and Vein Access Devices Market

IV Therapy and Vein Access Devices Market Insights – Trends & Forecast 2024-2034

Mesotherapy Market
Mesotherapy Market

Mesotherapy Market Size and Share Forecast Outlook 2025 to 2035

Cryotherapy Market
Cryotherapy Market

Cryotherapy Market Growth - Demand, Trends & Emerging Applications 2025 to 2035

Aromatherapy Market
Aromatherapy Market

Aromatherapy Market Size and Share Forecast Outlook 2025 to 2035

Radiotherapy Positioning Devices Market

Radiotherapy Positioning Devices Market Size and Share Forecast Outlook 2025 to 2035

Cell Therapy Systems Market

Cell Therapy Systems Market Size and Share Forecast Outlook 2025 to 2035

Chemotherapy-Induced Nausea And Vomiting Therapeutics Market

Chemotherapy-Induced Nausea And Vomiting Therapeutics Market Size and Share Forecast Outlook 2025 to 2035

Phototherapy Lamps And Units For Aesthetic Medicine Market

Phototherapy Lamps And Units For Aesthetic Medicine Market Size and Share Forecast Outlook 2025 to 2035

Phototherapy Equipment Market

Phototherapy Equipment Market Size and Share Forecast Outlook 2025 to 2035

Phototherapy Treatment Market

Phototherapy Treatment Market Size and Share Forecast Outlook 2025 to 2035

Heat Therapy Units Market

Heat Therapy Units Market Analysis - Size, Share, and Forecast 2025 to 2035

Chemotherapy Induced Anemia Market

Chemotherapy Induced Anemia Market Trends and Forecast 2025 to 2035

Radiotherapy Patient Positioning Accessories Market

Radiotherapy Patient Positioning Accessories Market Trends – Forecast 2025 to 2035

Phototherapy Lamps Market

Phototherapy Lamps Market Growth - Trends & Forecast 2025 to 2035

Future Market Insights

Physical Therapy Supplies Market

Chat With MaRIA

Chat With

MaRIA

Hi There, I am MaRIA, Your Market Research Intelligence Assistant. How may I help you?