The global pharmaceutical secondary packaging market is valued at USD 87,542 million in 2025 and is set to reach USD 142,836 million by 2035, growing at a CAGR of 5.0%. The market stands at the forefront of a transformative decade that promises to redefine drug protection infrastructure and pharmaceutical packaging excellence across prescription drugs, over-the-counter medications, biologics, and specialty pharmaceuticals sectors. The market's journey from USD 87,542 million in 2025 to USD 142,836 million by 2035 represents substantial growth, demonstrating the accelerating adoption of advanced protection systems and sophisticated pharmaceutical packaging solutions across cartons, labels, inserts, and compliance packaging applications.
The first half of the decade (2025-2030) will witness the market climbing from USD 87,542 million to approximately USD 112,847 million, adding USD 25,305 million in value, which constitutes 42% of the total forecast growth period. This phase will be characterized by the rapid adoption of smart packaging systems, driven by increasing demand for patient safety features and enhanced regulatory compliance requirements worldwide. Anti-counterfeiting capabilities and serialization features will become standard expectations rather than premium options.
The latter half (2030-2035) will witness sustained growth from USD 112,847 million to USD 142,836 million, representing an addition of USD 29,989 million or 58% of the decade's expansion. This period will be defined by mass market penetration of digital packaging systems, integration with comprehensive track-and-trace platforms, and seamless compatibility with existing pharmaceutical manufacturing infrastructure. The market trajectory signals fundamental shifts in how pharmaceutical companies and packaging converters approach drug protection solutions, with participants positioned to benefit from sustained demand across multiple therapeutic segments.
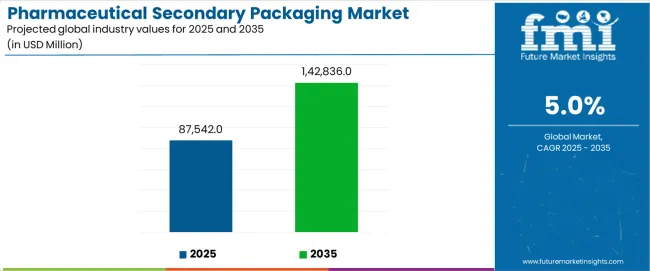
The pharmaceutical secondary packaging market demonstrates distinct growth phases with varying market characteristics and competitive dynamics. Between 2025 and 2030, the market progresses through its regulatory compliance adoption phase, expanding from USD 87,542 million to USD 112,847 million with steady annual increments averaging 4.8% growth. This period showcases the transition from traditional packaging formats to advanced serialization systems with enhanced track-and-trace capabilities and integrated patient safety features becoming mainstream requirements.
The 2025-2030 phase adds USD 25,305 million to market value, representing 42% of total decade expansion. Market maturation factors include standardization of serialization protocols, declining technology costs for smart packaging production, and increasing pharmaceutical company awareness of anti-counterfeiting benefits reaching 75-80% effectiveness in drug protection applications. Competitive landscape evolution during this period features established manufacturers like Amcor plc and Schott AG expanding their technology portfolios while new entrants focus on specialized digital printing solutions and enhanced security feature integration.
From 2030 to 2035, market dynamics shift toward advanced digitalization and multi-therapeutic deployment, with growth accelerating from USD 112,847 million to USD 142,836 million, adding USD 29,989 million or 58% of total expansion. This phase transition logic centers on universal smart packaging systems, integration with automated pharmaceutical manufacturing, and deployment across diverse therapeutic scenarios, becoming standard rather than specialized packaging formats. The competitive environment matures with focus shifting from basic serialization to comprehensive patient engagement and compatibility with digital health platforms.
| Metric | Value |
|---|---|
| Market Value (2025) | USD 87,542 million |
| Market Forecast (2035) | USD 142,836 million |
| Growth Rate | 5.00% CAGR |
| Leading Material Type | Folding Cartons |
| Primary Application | Prescription Drugs |
The market demonstrates strong fundamentals with folding cartons systems capturing a dominant share through superior protection capabilities and cost-effective manufacturing processes. Prescription drug applications drive primary demand, supported by increasing generic drug production requirements and branded pharmaceutical presentation solutions. Geographic expansion remains concentrated in developed markets with established pharmaceutical manufacturing infrastructure, while emerging economies show accelerating adoption rates driven by healthcare modernization projects and rising pharmaceutical production activity.
The pharmaceutical secondary packaging market represents a compelling intersection of drug protection innovation, regulatory compliance enhancement, and patient safety management. With robust growth projected from USD 87,542 million in 2025 to USD 142,836 million by 2035 at a 5.00% CAGR, this market is driven by increasing pharmaceutical production trends, regulatory serialization requirements, and commercial demand for anti-counterfeiting protection formats.
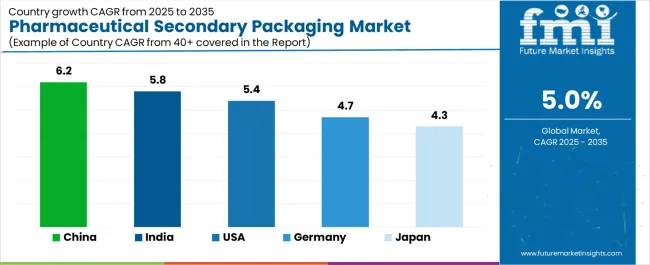
The market's expansion reflects a fundamental shift in how pharmaceutical companies and packaging converters approach drug packaging infrastructure. Strong growth opportunities exist across diverse therapeutic areas, from prescription medications requiring tamper-evident features to over-the-counter products demanding consumer-friendly designs. Geographic expansion is particularly pronounced in Asia-Pacific markets, led by China (6.2% CAGR) and India (5.8% CAGR), while established markets in North America and Europe drive innovation and specialized therapeutic segment development.
The dominance of folding cartons systems and prescription drug applications underscores the importance of proven protection technology and regulatory compliance in driving adoption. Material optimization and serialization complexity remain key challenges, creating opportunities for companies that can deliver reliable performance while maintaining manufacturing efficiency.
Market expansion rests on three fundamental shifts driving adoption across pharmaceutical and healthcare sectors. Regulatory compliance creates compelling advantages through serialization systems that provide comprehensive drug authentication and tracking capabilities, enabling pharmaceutical companies to meet global anti-counterfeiting requirements while maintaining supply chain integrity and justifying investment over standard packaging formats. Patient safety enhancement accelerates as healthcare providers worldwide seek advanced packaging systems that deliver medication adherence support directly to treatment environments, enabling therapeutic optimization that aligns with clinical protocols and maximizes treatment outcomes. Manufacturing efficiency drives adoption from pharmaceutical producers requiring standardized packaging solutions that maximize production throughput while maintaining regulatory compliance during distribution and retail operations.
The growth faces headwinds from technology implementation complexity that differs across manufacturing facilities regarding equipment integration and validation processes, potentially limiting performance reliability in high-volume pharmaceutical production categories. Material cost variations also persist regarding specialized security features and serialization components that may increase total packaging costs in markets with stringent regulatory standards.
Primary Classification: The market segments by material type into folding cartons, labels, inserts, blister packs, and bottles categories, representing the evolution from basic pharmaceutical packaging to comprehensive drug protection formats for integrated therapeutic operations.
Secondary Breakdown: Application segmentation divides the market into prescription drugs, over-the-counter medications, biologics, vaccines, and others sectors, reflecting distinct requirements for protection capabilities, regulatory compliance, and patient safety features.
Regional Classification: Geographic distribution covers North America, Europe, Asia Pacific, Latin America, and the Middle East & Africa, with developed markets leading innovation while emerging economies show accelerating growth patterns driven by pharmaceutical manufacturing development programs.
The segmentation structure reveals technology progression from standard carton packaging toward integrated smart packaging platforms with enhanced serialization and patient engagement capabilities, while application diversity spans from prescription medications to biologics requiring comprehensive protection and regulatory compliance solutions.
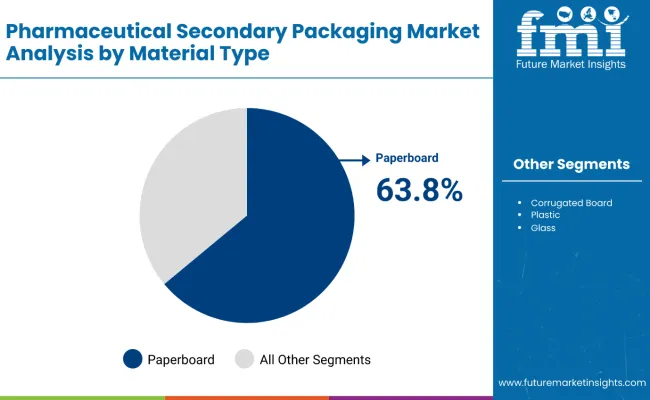
Folding cartons segment is estimated to account for 39% of the pharmaceutical secondary packaging market share in 2025. The segment's leading position stems from its fundamental role as a critical component in drug protection applications and its extensive use across multiple prescription and over-the-counter medication sectors. Folding cartons' dominance is attributed to its superior protection capabilities, including excellent barrier properties, tamper-evidence features, and cost-effective manufacturing processes that make it indispensable for pharmaceutical packaging operations.
Market Position: Folding cartons systems command the leading position in the pharmaceutical secondary packaging market through advanced printing technologies, including comprehensive graphics reproduction, regulatory text accommodation, and reliable structural integrity that enable manufacturers to deploy packaging solutions across diverse therapeutic environments.
Value Drivers: The segment benefits from pharmaceutical company preference for proven packaging formats that provide exceptional product protection without requiring specialized manufacturing infrastructure. Efficient material usage enables deployment in prescription packaging, over-the-counter applications, and institutional settings where regulatory compliance and cost-effectiveness represent critical selection requirements.
Competitive Advantages: Folding cartons systems differentiate through excellent printability characteristics, proven regulatory acceptance, and compatibility with standard pharmaceutical packaging equipment that enhance drug protection capabilities while maintaining economical manufacturing profiles suitable for diverse therapeutic packaging applications.
Key market characteristics:
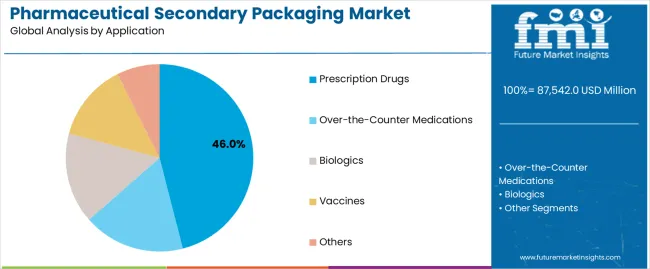
Prescription drugs segment is projected to hold 46% of the pharmaceutical secondary packaging market share in 2025. The segment's market leadership is driven by the extensive use of secondary packaging in branded medications, generic drug formulations, specialty therapeutics, and chronic disease treatments, where packaging serves as both a protective component and regulatory compliance surface. The prescription drug industry's consistent investment in advanced packaging materials supports the segment's dominant position.
Market Context: Prescription drug applications dominate the market due to widespread adoption of serialization requirements and increasing focus on patient safety, medication adherence, and anti-counterfeiting protection that enhance therapeutic outcomes while maintaining regulatory compliance.
Appeal Factors: Pharmaceutical manufacturers prioritize packaging reliability, regulatory compliance, and integration with automated production lines that enable coordinated deployment across multiple manufacturing facilities. The segment benefits from substantial generic drug growth and branded pharmaceutical investments that emphasize high-quality packaging for therapeutic applications.
Growth Drivers: Healthcare system expansion programs incorporate advanced packaging as standard protection for prescription medications. At the same time, pharmaceutical company initiatives are increasing demand for smart packaging systems that comply with serialization standards and enhance patient medication management.
Market Challenges: Regulatory complexity variations and serialization cost requirements may limit deployment flexibility in price-sensitive generic drug categories or emerging market scenarios.
Application dynamics include:
Growth Accelerators: Regulatory compliance drives primary adoption as serialization systems provide exceptional anti-counterfeiting capabilities that enable drug authentication without compromising manufacturing efficiency, supporting supply chain security and patient safety that require advanced packaging formats. Patient safety innovation accelerates market growth as pharmaceutical companies seek smart packaging solutions that maintain medication integrity during distribution while enhancing adherence monitoring through integrated digital features. Healthcare modernization increases worldwide, creating sustained demand for advanced packaging systems that complement therapeutic protocols and provide competitive advantages in pharmaceutical differentiation.
Growth Inhibitors: Technology implementation challenges differ across manufacturing facilities regarding equipment integration and validation complexity, which may limit market penetration and efficiency in high-volume pharmaceutical categories with demanding production requirements. Regulatory cost premium persists regarding serialization infrastructure and specialized security features that may increase total packaging costs in price-sensitive therapeutic applications with tight margin specifications. Market fragmentation across multiple material types and regulatory requirements creates compatibility concerns between different manufacturing equipment and existing pharmaceutical production infrastructure.
Market Evolution Patterns: Adoption accelerates in prescription drug and biologics sectors where patient safety justifies technology investments, with geographic concentration in developed markets transitioning toward mainstream adoption in emerging economies driven by pharmaceutical manufacturing expansion and healthcare system modernization. Technology development focuses on enhanced serialization capabilities, improved tamper-evidence features, and integration with digital health platforms that optimize therapeutic outcomes and manufacturing efficiency. The market could face disruption if alternative protection technologies or regulatory innovations significantly challenge traditional secondary packaging advantages in pharmaceutical applications.
The pharmaceutical secondary packaging market demonstrates varied regional dynamics with Growth Leaders including China (6.2% CAGR) and India (5.8% CAGR) driving expansion through pharmaceutical manufacturing growth and healthcare modernization. Steady Performers encompass the USA (5.4% CAGR), Germany (4.7% CAGR), and Japan (4.3% CAGR), benefiting from established pharmaceutical sectors and advanced regulatory frameworks.
| Country | CAGR (2025-2035) |
|---|---|
| China | 6.2% |
| India | 5.8% |
| USA | 5.4% |
| Germany | 4.7% |
| Japan | 4.3% |
Regional synthesis reveals Asia-Pacific markets leading growth through pharmaceutical manufacturing expansion and healthcare system development, while European countries maintain steady expansion supported by specialized biologic applications and advanced regulatory requirements. North American markets show strong growth driven by prescription drug innovation and smart packaging adoption.
China establishes regional leadership through explosive pharmaceutical production expansion and comprehensive healthcare system modernization, integrating advanced secondary packaging systems as standard components in prescription drug manufacturing and generic medication applications. The country's 6.2% CAGR through 2035 reflects healthcare investment growth promoting domestic pharmaceutical production and manufacturing capacity development that mandate the use of advanced packaging systems in therapeutic operations. Growth concentrates in major pharmaceutical hubs, including Shanghai, Beijing, and Guangzhou, where manufacturing networks showcase integrated packaging systems that appeal to domestic companies seeking enhanced regulatory compliance and international pharmaceutical standards.
Chinese manufacturers are developing innovative packaging solutions that combine local production advantages with international regulatory specifications, including advanced serialization capabilities and enhanced tamper-evidence features.
Strategic Market Indicators:
The Indian market emphasizes prescription drug applications, including rapid generic pharmaceutical development and comprehensive healthcare infrastructure expansion that increasingly incorporates secondary packaging for medication protection and regulatory compliance applications. The country is projected to show a 5.8% CAGR through 2035, driven by massive pharmaceutical manufacturing activity under healthcare modernization initiatives and commercial demand for affordable, high-quality protection systems. Indian pharmaceutical manufacturers prioritize cost-effectiveness with secondary packaging delivering regulatory compliance through economical material usage and efficient manufacturing capabilities.
Technology deployment channels include major pharmaceutical companies, generic drug manufacturers, and contract manufacturing organizations that support high-volume usage for domestic and export applications.
Performance Metrics:
The USA market emphasizes advanced packaging features, including innovative serialization technologies and integration with comprehensive pharmaceutical supply chains that manage drug protection, patient safety, and regulatory compliance applications through unified packaging systems. The country is projected to show a 5.4% CAGR through 2035, driven by prescription drug innovation under healthcare transformation trends and commercial demand for smart, connected packaging systems. American pharmaceutical companies prioritize patient outcomes with secondary packaging delivering comprehensive protection through advanced security features and digital integration.
Technology deployment channels include major pharmaceutical manufacturers, specialty drug companies, and contract packaging organizations that support custom development for therapeutic operations.
Performance Metrics:
In Frankfurt, Munich, and Hamburg, German pharmaceutical manufacturers and packaging converters are implementing advanced secondary packaging systems to enhance drug protection capabilities and support regulatory compliance that aligns with quality protocols and European standards. The German market demonstrates sustained growth with a 4.7% CAGR through 2035, driven by biologic drug innovation programs and pharmaceutical company investments that emphasize premium packaging systems for therapeutic and specialty applications. German pharmaceutical facilities are prioritizing packaging systems that provide exceptional regulatory compliance while maintaining compatibility with recycling requirements and minimizing material waste, particularly important in prescription drug packaging and specialty therapeutic operations.
Market expansion benefits from pharmaceutical quality programs that mandate enhanced protection in packaging specifications, creating sustained demand across Germany's pharmaceutical and biotechnology sectors, where serialization excellence and regulatory precision represent critical requirements.
Strategic Market Indicators:
Japan's sophisticated pharmaceutical market demonstrates meticulous secondary packaging deployment, growing at 4.3% CAGR, with documented operational excellence in drug protection and regulatory compliance applications through integration with existing manufacturing systems and quality assurance infrastructure. The country leverages engineering expertise in pharmaceutical manufacturing and packaging precision to maintain market leadership. Pharmaceutical centers, including Tokyo, Osaka, and Nagoya, showcase advanced installations where packaging systems integrate with comprehensive serialization platforms and regulatory compliance systems to optimize drug protection and patient safety.
Japanese pharmaceutical manufacturers prioritize protection precision and regulatory consistency in product development, creating demand for premium packaging systems with advanced features, including ultra-secure sealing and integration with track-and-trace protocols. The market benefits from established pharmaceutical infrastructure and willingness to invest in specialized packaging technologies that provide superior drug protection and regulatory compliance.
Market Intelligence Brief:
The pharmaceutical secondary packaging market in Europe is projected to grow from USD 23,847 million in 2025 to USD 36,294 million by 2035, registering a CAGR of 4.3% over the forecast period. Germany is expected to maintain its leadership position with a 34.7% market share in 2025, declining slightly to 34.2% by 2035, supported by its pharmaceutical excellence and major manufacturing centers, including North Rhine-Westphalia and Bavaria.
France follows with a 21.8% share in 2025, projected to reach 22.3% by 2035, driven by comprehensive biologic drug development and pharmaceutical company initiatives. The United Kingdom holds a 18.6% share in 2025, expected to maintain 18.9% by 2035 through established pharmaceutical sectors and advanced regulatory compliance. Italy commands a 12.4% share, while Spain accounts for 8.2% in 2025. The Rest of Europe region is anticipated to gain momentum, expanding its collective share from 4.3% to 4.8% by 2035, attributed to increasing pharmaceutical development in Eastern European countries and emerging Nordic biotechnology companies implementing advanced packaging programs.
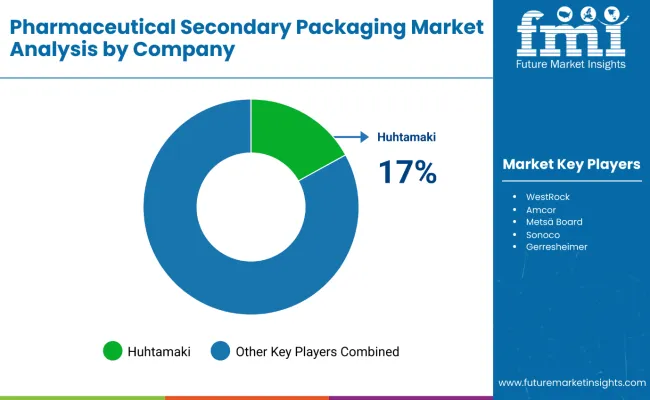
The pharmaceutical secondary packaging market operates with moderate concentration, featuring approximately 18-25 participants, where leading companies control roughly 42-48% of the global market share through established manufacturing networks and comprehensive packaging solution capabilities. Competition emphasizes regulatory compliance, protection performance, and serialization efficiency rather than price-based rivalry.
Market leaders encompass Amcor plc, Schott AG, and West Pharmaceutical Services, which maintain competitive advantages through extensive pharmaceutical packaging expertise, global manufacturing networks, and comprehensive technical support capabilities that create customer loyalty and support regulatory requirements. These companies leverage decades of pharmaceutical experience and ongoing technology investments to develop advanced packaging systems with exceptional protection features and regulatory compliance capabilities. Amcor plc leads with 15% share.
Specialty challengers include AptarGroup Inc., CCL Industries, and Berry Global Group, which compete through specialized pharmaceutical innovation focus and efficient manufacturing solutions that appeal to pharmaceutical companies seeking premium protection formats and custom regulatory flexibility. These companies differentiate through engineering emphasis and specialized therapeutic application focus.
Market dynamics favor participants that combine reliable protection performance with advanced serialization support, including track-and-trace integration and anti-counterfeiting capabilities. Competitive pressure intensifies as traditional packaging manufacturers expand into pharmaceutical applications. At the same time, specialized pharmaceutical packaging converters challenge established players through innovative security features and cost-effective production targeting emerging generic drug segments.
| Item | Value |
|---|---|
| Quantitative Units | USD 87,542 million |
| Material Type | Folding Cartons, Labels, Inserts, Blister Packs, Bottles |
| Application | Prescription Drugs, Over-the-Counter Medications, Biologics, Vaccines, Others |
| Regions Covered | North America, Europe, Asia Pacific, Latin America, Middle East & Africa |
| Countries Covered | USA, Germany, Japan, China, India, and 25+ additional countries |
| Key Companies Profiled | Amcor plc, Schott AG, West Pharmaceutical Services, AptarGroup Inc., CCL Industries, Berry Global Group |
| Additional Attributes | Dollar sales by material type and application categories, regional adoption trends across North America, Europe, and Asia-Pacific, competitive landscape with pharmaceutical packaging manufacturers and converters, pharmaceutical company preferences for protection performance and regulatory compliance, integration with manufacturing equipment and serialization systems, innovations in packaging technology and security features, and development of specialized therapeutic solutions with enhanced protection capabilities and patient safety features |
The global pharmaceutical secondary packaging market is estimated to be valued at USD 87,542.0 million in 2025.
The market size for the pharmaceutical secondary packaging market is projected to reach USD 142,836.0 million by 2035.
The pharmaceutical secondary packaging market is expected to grow at a 5.0% CAGR between 2025 and 2035.
The key product types in pharmaceutical secondary packaging market are folding cartons , labels, inserts, blister packs and bottles.
In terms of application, prescription drugs segment to command 46.0% share in the pharmaceutical secondary packaging market in 2025.


Full Research Suite comprises of:
Market outlook & trends analysis
Interviews & case studies
Strategic recommendations
Vendor profiles & capabilities analysis
5-year forecasts
8 regions and 60+ country-level data splits
Market segment data splits
12 months of continuous data updates
DELIVERED AS:
PDF EXCEL ONLINE
Industry Share & Competitive Positioning in Pharmaceutical Secondary Packaging
Pharmaceutical Manufacturing Equipment Market Forecast and Outlook 2025 to 2035
Pharmaceutical Plastic Bottle Market Forecast and Outlook 2025 to 2035
Pharmaceutical Grade Sodium Carbonate Market Forecast and Outlook 2025 to 2035
Pharmaceutical Industry Analysis in Saudi Arabia Forecast and Outlook 2025 to 2035
Pharmaceutical Grade Sodium Chloride Market Size and Share Forecast Outlook 2025 to 2035
Pharmaceutical Plastic Pots Market Size and Share Forecast Outlook 2025 to 2035
Pharmaceuticals Pouch Market Size and Share Forecast Outlook 2025 to 2035
Pharmaceutical Mini Batch Blender Market Size and Share Forecast Outlook 2025 to 2035
Pharmaceutical Continuous Manufacturing Equipment Market Size and Share Forecast Outlook 2025 to 2035
Pharmaceutical Liquid Prefilters Market Size and Share Forecast Outlook 2025 to 2035
Pharmaceutical Grade P-Toluenesulfonic Acid Market Size and Share Forecast Outlook 2025 to 2035
Pharmaceutical Glass Container Industry Analysis in Europe Size and Share Forecast Outlook 2025 to 2035
Pharmaceutical Container Market Size and Share Forecast Outlook 2025 to 2035
Pharmaceutical Sterility Testing Market Size and Share Forecast Outlook 2025 to 2035
Pharmaceuticals Preservative Market Size and Share Forecast Outlook 2025 to 2035
Pharmaceutical Track and Trace Systems Market Size and Share Forecast Outlook 2025 to 2035
Pharmaceutical Vials Market Size and Share Forecast Outlook 2025 to 2035
Pharmaceuticals Machinery Market Size and Share Forecast Outlook 2025 to 2035
Pharmaceutical Logistics Market Size and Share Forecast Outlook 2025 to 2035

Thank you!
You will receive an email from our Business Development Manager. Please be sure to check your SPAM/JUNK folder too.
Chat With
MaRIA