Pharma Trays Market Size and Share Forecast Outlook 2025 to 2035

The pharma trays market is projected to grow from USD 7.4 billion in 2025 to USD 14.3 billion by 2035, registering a CAGR of 6.8% during the forecast period. Sales in 2024 reached USD 50.6 billion. Growth has been supported by rising needs for tamper-evident, durable, and sterile packaging across pharmaceutical logistics.
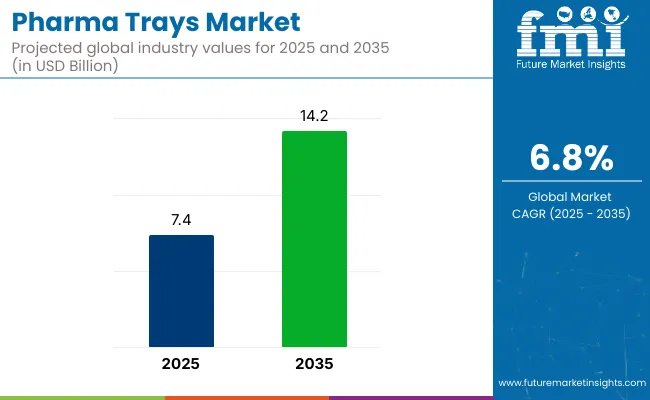
Quick Stats of Pharma Trays Market

  • Market Value (2025): USD 7.4 billion
  • Forecast Value (2035): USD 14.3 billion
  • Forecast CAGR: 6.8%
  • Material Leader in 2025: Thermoformed plastic (42.5% market share)
  • Top End Use: Pharmaceutical Manufacturers (39.2% share)
  • Key Growth Country: North America (USA is the fastest-growing market with 7.1% CAGR)

Pharma Trays Market

Metric Value
Market Size in 2025 USD 7.4 billion
Projected Market Size in 2035 USD 14.3 billion
CAGR (2025 to 2035) 6.8%

In India and globally, demand from hospitals, clinics, and contract manufacturers has led to wider use of thermoformed trays for injection vials, ampoules, and surgical kits. Increased spending on advanced healthcare infrastructure and vaccine distribution efforts has also stimulated usage. Recyclable and reclosable formats have gained traction across bulk packaging and secondary containment. Government procurement programs have also encouraged regional tray suppliers to expand production.

In May 2025, Nelipak Corporation, a leading global provider of healthcare packaging solutions for medical device, diagnostic, pharmaceutical drug delivery, and other demanding applications, announced that it will establish a new packaging production site in Costa Rica. “We are excited to announce another major investment in our global operating footprint in order to support customers on a global, regional and local basis” said Pat Chambliss, CEO of Nelipak.

“Costa Rica is a significant and growing hub for medical device manufacturing and this investment demonstrates our commitment to serve customers in the region with world-class local production.” Production capabilities at the site will include thin-gauge thermoforming for medical device trays and blisters; heavy-gauge thermoforming for deep draw tubs and trays, and die cut pouch cards and inserts.

Eco-conscious formulations and minimal-waste formats have shaped innovation in the pharma trays market. Compostable trays, PET-G substitutions, and mono-material laminates have been introduced to meet regulatory targets and brand sustainability goals.

Pharma companies have also adopted AI-based quality control systems and automated forming machines to improve hygiene, accuracy, and turnaround times. In India, pharma exporters have begun investing in reusable packaging systems, particularly for clinical trial kits and vaccine shipments. The market has responded by offering cleaner extrusion lines, lower gauge materials, and tamper-resistant lid seals. Pharmaceutical logistics standards have created room for innovation in bio-based and cold chain-compliant tray formats.

Over the next decade, opportunities in the pharma trays market will be driven by stricter GMP guidelines, global pharma outsourcing, and expansion of biopharma cold chains. India’s export sector is expected to account for a significant portion of tray-based packaging adoption, especially in vaccine logistics.

Additional growth has been projected in temperature-sensitive transport trays, supported by demand from the U.S., Europe, and Japan. Strategic R&D will be directed toward recyclable, RFID-compatible tray formats with improved seal integrity. Competitive advantages will be gained by suppliers offering scalable, cleanroom-ready tray designs and compliant barrier coatings. The pharma trays market will remain central to the sterile packaging ecosystem.

Analyzing Pharma Trays Market by Top Investment Segment

The market is segmented based on material type, tray type, end-use setting, and region. By material type, the segmentation includes thermoformed plastic (PET, PVC, PS, PP), polycarbonate, HDPE, paper-based & molded fiber, and biodegradable/bio-based polymers, with thermoformed plastics dominating due to their lightweight, clarity, and design adaptability for sensitive pharma items.

Tray types include blister trays, compartmental/divided trays, nest able/stackable trays, insert trays, lidded trays, and anti-static trays, with blister trays being most utilized for their product visibility and contamination prevention in controlled environments.

End-use settings span pharmaceutical manufacturing units, hospitals & clinics, diagnostic laboratories, contract packaging organizations (CPOs), and research & academic institutions-where manufacturing units lead due to automation in high-throughput packaging. Regionally, the market is distributed across North America, Latin America, East Asia, South Asia & Pacific, Eastern Europe, Western Europe, Oceania, and Middle East & Africa.
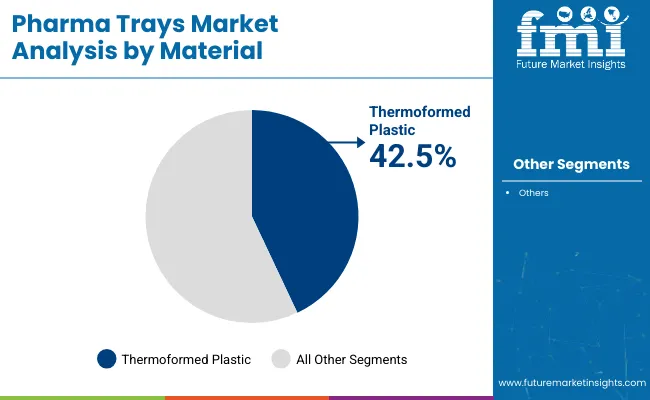
Thermoformed Plastic Trays Preferred for Precision and Sterile Compatibility

Pharma Trays Market Analysis By Material

Thermoformed plastic trays are projected to account for approximately 42.5% of the global pharma trays market by 2025. Materials such as PET, PVC, PS, and PP have been widely utilized due to their clarity, chemical resistance, and formability under heat. These trays have supported aseptic packaging for ampoules, vials, and prefilled syringes in both cleanroom and high-speed lines.

Recyclable grades and antimicrobial coatings have gained traction for reducing contamination risk and aligning with sustainability goals. Custom cavities, tamper-evident seals, and moisture barriers have been incorporated to meet global pharmaceutical compliance standards.

The lightweight profile and stackable design of thermoformed trays have optimized packaging volume and logistics. Manufacturers have favored PET/PP combinations for dual-compartment drug-device packaging. Regulatory approvals and material traceability have reinforced the adoption of medical-grade thermoformed plastics in GMP environments.

The scalability of thermoforming processes has allowed for rapid production of trays tailored to specific pharmaceutical applications. Advancements in thermoforming technology have enhanced the precision and consistency of tray dimensions. This has been crucial for automated filling and sealing operations.

The cost-effectiveness of thermoformed trays has also contributed to their widespread adoption. As the demand for biologics and personalized medicine grows, the need for customized and reliable packaging solutions has intensified. Thermoformed plastic trays have met this demand by offering flexibility in design and compatibility with various sterilization methods. Their role in ensuring product integrity during storage and transportation has been indispensable. Consequently, their market share is expected to remain significant in the foreseeable future.
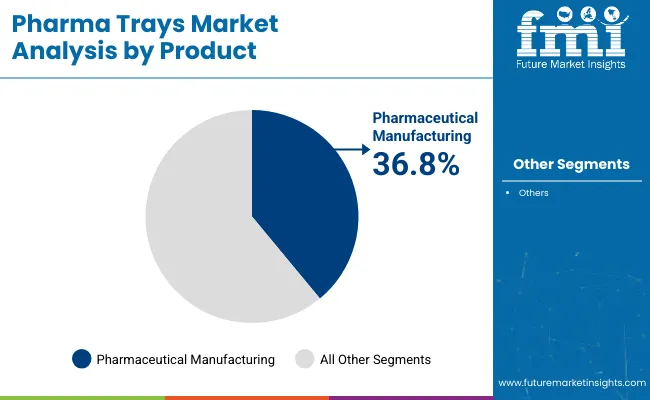
Pharmaceutical Manufacturing Utilize Trays for Automation and Batch Integrity

Pharma Trays Market Analysis By Product

Pharmaceutical manufacturing units are estimated to hold a 36.8% share of the pharma trays market by 2025. These facilities have relied on trays to facilitate the organized handling of components during production processes. Trays have been instrumental in maintaining batch integrity and ensuring compliance with stringent regulatory standards. Their use has enhanced efficiency and reduced the risk of cross-contamination.

The integration of trays into automated systems has streamlined operations in pharmaceutical manufacturing units. Trays have been designed to be compatible with robotic arms and conveyor systems. This compatibility has minimized manual handling and improved overall productivity. Additionally, trays have been customized to accommodate specific product dimensions and configurations.

The adoption of trays in manufacturing units has also supported traceability and quality control measures. Unique identifiers and barcodes have been incorporated into tray designs to facilitate tracking throughout the production cycle. This has been essential for meeting regulatory requirements and ensuring product safety. Furthermore, the use of trays has simplified the cleaning and validation processes within manufacturing environments.

As pharmaceutical manufacturing continues to evolve with advancements in technology and increased production demands, the reliance on trays is expected to grow. Their role in enhancing operational efficiency, ensuring compliance, and maintaining product quality has been well-established. Ongoing innovations in tray materials and designs will further support their utilization in manufacturing units. Therefore, their market share is anticipated to remain substantial in the coming years.

Challenges and Opportunities

Challenges

Material compatibility, sterilization limits, and environmental compliance remain key constraints.

The pharma trays industry is bloated with sustainable material selection sticking to sterility and recyclability standards. While many high-grade plastics are non-biodegradable, eco-friendly alternatives often fail to survive sterilizing processes like gamma irradiation or autoclaving. Moreover, variations in packaging compliance standards, including effective data submission to authorities, vary by country, further complicating product standardization, and increasing regulatory obstacles for exporters.

Opportunities

Cleanroom-ready designs, smart integration, and cold chain innovations fuel future expansion.

Opportunities exist for trays for automated pharma lines and robotics. This will help to mitigate the risk of contamination while increasing the ability to track compliance through integration of smart features such as RFID tagging, serialization support, and compartment-specific cushioning. Additionally, cold-chain pharma logistics and biologic drug packaging cause to develop the demand for moisture-resistant, temperature-stable tray formats used for vaccines and biosimilars. Hospital and pharmacy unit-dose delivery also creates opportunities for new tray formats.
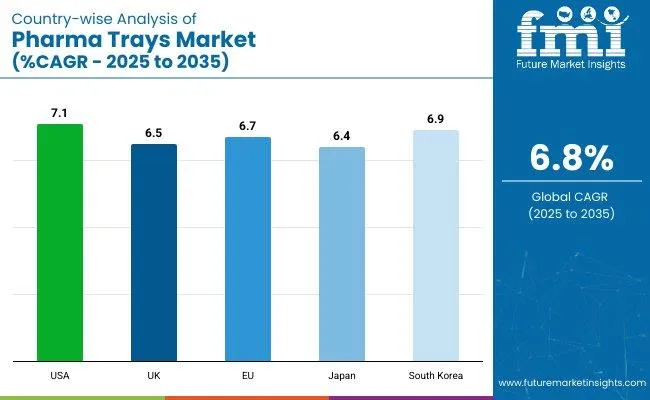
Country-Wise Outlook

Pharma Trays Market Country Wise Analysis

United States

Increasing pharmaceutical production and demand for precise-oriented packaging are contributing keys to the growth of the USA pharma trays market. Thermoformed trays are commonly used to handle medicines, transport vaccines, or organize surgical kits. Pharma trays must be held to high standards of cleanliness, traceability, and sterilization compatibility under stringent regulatory oversight by the FDA.

All of this means that manufacturers are increasingly using recyclable PETG and medical grade polypropylene to meet their sustainability objectives. Custom trays design services: tiered for biotech and helping CDMOs (Contract Development and Manufacturing Organizations) Implementation of automation in pharmaceutical packing lines is increasing the demand for dimensionally stable tray systems.

Country CAGR (2025 to 2035)
United States 7.1%

United Kingdom

In the UK, pharma trays are firmly established in temperature-controlled transport, clinical trials, and unit-dose drug distribution. Increased digitalization driven by the NHS and a greater movement toward central pharmacy services are some of the factors shaping demand for tamper-evident and RFID / radio frequency identification integrated trays.

Domestic suppliers are looking to lightweight, recyclable materials that meet MHRA (Medicines and Healthcare products Regulatory Agency) guidelines. Text Innovations in anti-static and low-particulate tray formats are driving growth in the biologics sector as well. Other major producers are increasing production capabilities close to the innovation centers near Oxford and Cambridge.

Country CAGR (2025 to 2035)
United Kingdom 6.5%

European Union

The EU pharma trays market is being driven by the growing number of drug exports, the increasing production of vaccines, and the strict enforcement of GMP standards in member states; the region is expected to retain its top position throughout the forecast period. Countries like France, Germany, and the Netherlands were already using smart packaging solutions such as tamper-proof cavities and automation-ready blister trays.

A clear and compartment vessels are preferred in clinical diagnostics as well as infusion therapy kits. Even materials are being guided by circular economy principles and PET, rPET and recyclable PS trays have taken hold. Development of temperature-stable, sterile barrier tray systems is among the packaging innovation supported by EU funding initiatives for pharmaceuticals.

Region CAGR (2025 to 2035)
European Union 6.7%

Japan

A mature medical system and emphasis on high-tech precision packaging for both domestic and export utilization contributes to Japan's pharma trays market. Stackable trays are used by both hospitals and compounding centers for sterile drug handling and single-use administration kits.

Producers are focusing on “high-barrier” materials, anti-contamination features and ergonomic designs for ease of handling. Japan’s PMDA regulatory standards dictate stringent documentation and consistency in packaging practices. As new eco-focused packaging goals mature, companies in Tokyo are adopting hybrid formats, such as plastic-paper trays.

Country CAGR (2025 to 2035)
Japan 6.4%

South Korea

The biopharma industry is booming in South Korea, leading to more widespread use of specialty pharma trays for vaccines and injectables, as well as oral solid dosage forms. These high-speed production lines can be found in Incheon and Seoul; they are driving demand for tray formats that are precision-molded and compatible with automation systems.

Policies supporting domestic pharma capacity are driving local innovation within cleanroom-certified and ESD-safe tray materials. Exporting manufacturers are designing different packaging that meets international packaging standards USP as well as EU MDR. Consumers are also adopting transparent blister trays for single-patient-use therapies in hospital settings and home-care services.

Country CAGR (2025 to 2035)
South Korea 6.9%

Competitive Outlook

Pharma trays market is currently witnessing a flourishing growth owing to the rising demand for disinfect, safe and compartmented packaging of pharmaceuticals, particularly in case of biologics, diagnostics and injectable therapies. With demands for tamper-proof and trackable packaging formats growing, pharma trays are evolving with anti-static materials, cleanroom compliance and thermoformed or injection-molded designs as regulatory frameworks tighten.

Film and container manufacturers are developing specialty, high-barrier polymers that help enhance product preservation, as well as trays integrated with RFID technology and cavity layouts that provide customizability for optimal product segregation and shipping integrity. The growth of biologics and temperature-sensitive drugs further drives innovation in sealed and insulated tray systems.

Key Players

  • Prent Corporation- Custom sterile trays with ultrasonic welding and ESD-safe designs.
  • Technipaq Inc.- Laminated tray systems for diagnostic kits and temperature-sensitive injectables.
  • Medicel Packaging- Compact cavity trays for ophthalmic and dental unit-dose systems.
  • Alpla Group- Bioplastic-based pharmaceutical trays integrated with sealed film barriers.
  • Paccor (Faerch Group)- Rigid PET trays for European pharma supply chains, focused on closed-loop recycling.

Key Segments

By Product Type:

  • Deep storage trays
  • Sterilization trays
  • Vial trays
  • Gel cap drying trays

By Material Type:

  • Metal
  • Plastic

By Region:

  • North America
  • Latin America
  • Western Europe
  • Eastern Europe
  • East Asia
  • South Asia Pacific
  • Middle East and Africa

Table of Content

  1. Executive Summary
    • Global Market Outlook
    • Demand-side Trends
    • Supply-side Trends
    • Technology Roadmap Analysis
    • Analysis and Recommendations
  2. Market Overview
    • Market Coverage / Taxonomy
    • Market Definition / Scope / Limitations
  3. Market Background
    • Market Dynamics
      • Drivers
      • Restraints
      • Opportunity
      • Trends
    • Scenario Forecast
      • Demand in Optimistic Scenario
      • Demand in Likely Scenario
      • Demand in Conservative Scenario
    • Opportunity Map Analysis
    • Product Life Cycle Analysis
    • Supply Chain Analysis
      • Supply Side Participants and their Roles
        • Producers
        • Mid-Level Participants (Traders/ Agents/ Brokers)
        • Wholesalers and Distributors
      • Value Added and Value Created at Node in the Supply Chain
      • List of Raw Material Suppliers
      • List of Existing and Potential Buyer’s
    • Investment Feasibility Matrix
    • Value Chain Analysis
      • Profit Margin Analysis
      • Wholesalers and Distributors
      • Retailers
    • PESTLE and Porter’s Analysis
    • Regulatory Landscape
      • By Key Regions
      • By Key Countries
    • Regional Parent Market Outlook
    • Production and Consumption Statistics
    • Import and Export Statistics
  4. Global Market Analysis 2020 to 2024 and Forecast, 2025 to 2035
    • Historical Market Size Value (USD Billion) & Volume (Units) Analysis, 2020 to 2024
    • Current and Future Market Size Value (USD Billion) & Volume (Units) Projections, 2025 to 2035
      • Y-o-Y Growth Trend Analysis
      • Absolute $ Opportunity Analysis
  5. Global Market Pricing Analysis 2020 to 2024 and Forecast 2025 to 2035
  6. Global Market Analysis 2020 to 2024 and Forecast 2025 to 2035, By Material Type
    • Introduction / Key Findings
    • Historical Market Size Value (USD Billion) & Volume (Units) Analysis By Material Type, 2020 to 2024
    • Current and Future Market Size Value (USD Billion) & Volume (Units) Analysis and Forecast By Material Type, 2025 to 2035
      • Thermoformed Plastic (PET, PVC, PS, PP)
      • Polycarbonate
      • High-Density Polyethylene (HDPE)
      • Paper-Based & Molded Fiber
      • Biodegradable/Bio-based Polymers
    • Y-o-Y Growth Trend Analysis By Material Type, 2020 to 2024
    • Absolute $ Opportunity Analysis By Material Type, 2025 to 2035
  7. Global Market Analysis 2020 to 2024 and Forecast 2025 to 2035, By Tray Type
    • Introduction / Key Findings
    • Historical Market Size Value (USD Billion) & Volume (Units) Analysis By Tray Type, 2020 to 2024
    • Current and Future Market Size Value (USD Billion) & Volume (Units) Analysis and Forecast By Tray Type, 2025 to 2035
      • Blister Trays
      • Compartmental/Divided Trays
      • Nestable/Stackable Trays
      • Insert Trays
      • Lidded Trays
      • Anti-Static Trays
    • Y-o-Y Growth Trend Analysis By Tray Type, 2020 to 2024
    • Absolute $ Opportunity Analysis By Tray Type, 2025 to 2035
  8. Global Market Analysis 2020 to 2024 and Forecast 2025 to 2035, By End-Use Setting
    • Introduction / Key Findings
    • Historical Market Size Value (USD Billion) & Volume (Units) Analysis By End-Use Setting, 2020 to 2024
    • Current and Future Market Size Value (USD Billion) & Volume (Units) Analysis and Forecast By End-Use Setting, 2025 to 2035
      • Pharmaceutical Manufacturing Value (USD Billion) & Volume (Units)s
      • Hospitals & Clinics
      • Diagnostic Laboratories
      • Contract Packaging Organizations (CPOs)
      • Research & Academic Institutions
    • Y-o-Y Growth Trend Analysis By End-Use Setting, 2020 to 2024
    • Absolute $ Opportunity Analysis By End-Use Setting, 2025 to 2035
  9. Global Market Analysis 2020 to 2024 and Forecast 2025 to 2035, By Region
    • Introduction
    • Historical Market Size Value (USD Billion) & Volume (Units) Analysis By Region, 2020 to 2024
    • Current Market Size Value (USD Billion) & Volume (Units) Analysis and Forecast By Region, 2025 to 2035
      • North America
      • Latin America
      • Europe
      • East Asia
      • South Asia
      • Oceania
      • MEA
    • Market Attractiveness Analysis By Region
  10. North America Market Analysis 2020 to 2024 and Forecast 2025 to 2035, By Country
    • Historical Market Size Value (USD Billion) & Volume (Units) Trend Analysis By Market Taxonomy, 2020 to 2024
    • Market Size Value (USD Billion) & Volume (Units) Forecast By Market Taxonomy, 2025 to 2035
      • By Country
        • USA
        • Canada
      • By Material Type
      • By Tray Type
      • By End-Use Setting
    • Market Attractiveness Analysis
      • By Country
      • By Material Type
      • By Tray Type
      • By End-Use Setting
    • Key Takeaways
  11. Latin America Market Analysis 2020 to 2024 and Forecast 2025 to 2035, By Country
    • Historical Market Size Value (USD Billion) & Volume (Units) Trend Analysis By Market Taxonomy, 2020 to 2024
    • Market Size Value (USD Billion) & Volume (Units) Forecast By Market Taxonomy, 2025 to 2035
      • By Country
        • Brazil
        • Mexico
        • Argentina
        • Chile
        • Peru
        • Rest of Latin America
      • By Material Type
      • By Tray Type
      • By End-Use Setting
    • Market Attractiveness Analysis
      • By Country
      • By Material Type
      • By Tray Type
      • By End-Use Setting
    • Key Takeaways
  12. Europe Market Analysis 2020 to 2024 and Forecast 2025 to 2035, By Country
    • Historical Market Size Value (USD Billion) & Volume (Units) Trend Analysis By Market Taxonomy, 2020 to 2024
    • Market Size Value (USD Billion) & Volume (Units) Forecast By Market Taxonomy, 2025 to 2035
      • By Country
        • Germany
        • Italy
        • France
        • U.K.
        • Spain
        • Russia
        • BENELUX
        • Rest of Europe
      • By Material Type
      • By Tray Type
      • By End-Use Setting
    • Market Attractiveness Analysis
      • By Country
      • By Material Type
      • By Tray Type
      • By End-Use Setting
    • Key Takeaways
  13. East Asia Market Analysis 2020 to 2024 and Forecast 2025 to 2035, By Country
    • Historical Market Size Value (USD Billion) & Volume (Units) Trend Analysis By Market Taxonomy, 2020 to 2024
    • Market Size Value (USD Billion) & Volume (Units) Forecast By Market Taxonomy, 2025 to 2035
      • By Country
        • China
        • Japan
        • South Korea
      • By Material Type
      • By Tray Type
      • By End-Use Setting
    • Market Attractiveness Analysis
      • By Country
      • By Material Type
      • By Tray Type
      • By End-Use Setting
    • Key Takeaways
  14. South Asia Market Analysis 2020 to 2024 and Forecast 2025 to 2035, By Country
    • Historical Market Size Value (USD Billion) & Volume (Units) Trend Analysis By Market Taxonomy, 2020 to 2024
    • Market Size Value (USD Billion) & Volume (Units) Forecast By Market Taxonomy, 2025 to 2035
      • By Country
        • India
        • Thailand
        • Malaysia
        • Indonesia
        • Rest of South Asia
      • By Material Type
      • By Tray Type
      • By End-Use Setting
    • Market Attractiveness Analysis
      • By Country
      • By Material Type
      • By Tray Type
      • By End-Use Setting
    • Key Takeaways
  15. Oceania Market Analysis 2020 to 2024 and Forecast 2025 to 2035, By Country
    • Historical Market Size Value (USD Billion) & Volume (Units) Trend Analysis By Market Taxonomy, 2020 to 2024
    • Market Size Value (USD Billion) & Volume (Units) Forecast By Market Taxonomy, 2025 to 2035
      • By Country
        • Australia
        • New Zealand
      • By Material Type
      • By Tray Type
      • By End-Use Setting
    • Market Attractiveness Analysis
      • By Country
      • By Material Type
      • By Tray Type
      • By End-Use Setting
    • Key Takeaways
  16. MEA Market Analysis 2020 to 2024 and Forecast 2025 to 2035, By Country
    • Historical Market Size Value (USD Billion) & Volume (Units) Trend Analysis By Market Taxonomy, 2020 to 2024
    • Market Size Value (USD Billion) & Volume (Units) Forecast By Market Taxonomy, 2025 to 2035
      • By Country
        • GCC
        • Rest of MEA
      • By Material Type
      • By Tray Type
      • By End-Use Setting
    • Market Attractiveness Analysis
      • By Country
      • By Material Type
      • By Tray Type
      • By End-Use Setting
    • Key Takeaways
  17. Key Countries Market Analysis
    • USA
      • Pricing Analysis
      • Market Share Analysis, 2024
        • By Material Type
        • By Tray Type
        • By End-Use Setting
    • Canada
      • Pricing Analysis
      • Market Share Analysis, 2024
        • By Material Type
        • By Tray Type
        • By End-Use Setting
    • Brazil
      • Pricing Analysis
      • Market Share Analysis, 2024
        • By Material Type
        • By Tray Type
        • By End-Use Setting
    • Mexico
      • Pricing Analysis
      • Market Share Analysis, 2024
        • By Material Type
        • By Tray Type
        • By End-Use Setting
    • Argentina
      • Pricing Analysis
      • Market Share Analysis, 2024
        • By Material Type
        • By Tray Type
        • By End-Use Setting
  18. Market Structure Analysis
    • Competition Dashboard
    • Competition Benchmarking
    • Market Share Analysis of Top Players
      • By Regional
      • By Material Type
      • By Tray Type
      • By End-Use Setting
  19. Competition Analysis
    • Competition Deep Dive
      • Pactiv LLC
        • Overview
        • Product Portfolio
        • Profitability by Market Segments (Product/Age /Sales Channel/Region)
        • Sales Footprint
        • Strategy Overview
          • Marketing Strategy
          • Product Strategy
          • Channel Strategy
      • Sonoco Products Company
        • Overview
        • Product Portfolio
        • Profitability by Market Segments (Product/Age /Sales Channel/Region)
        • Sales Footprint
        • Strategy Overview
          • Marketing Strategy
          • Product Strategy
          • Channel Strategy
      • Huhtamaki Oyj.
        • Overview
        • Product Portfolio
        • Profitability by Market Segments (Product/Age /Sales Channel/Region)
        • Sales Footprint
        • Strategy Overview
          • Marketing Strategy
          • Product Strategy
          • Channel Strategy
      • Tray-Pak Corporation
        • Overview
        • Product Portfolio
        • Profitability by Market Segments (Product/Age /Sales Channel/Region)
        • Sales Footprint
        • Strategy Overview
          • Marketing Strategy
          • Product Strategy
          • Channel Strategy
      • Molded Fiber Glass Tray Company
        • Overview
        • Product Portfolio
        • Profitability by Market Segments (Product/Age /Sales Channel/Region)
        • Sales Footprint
        • Strategy Overview
          • Marketing Strategy
          • Product Strategy
          • Channel Strategy
      • TOPAS Advanced Polymers
        • Overview
        • Product Portfolio
        • Profitability by Market Segments (Product/Age /Sales Channel/Region)
        • Sales Footprint
        • Strategy Overview
          • Marketing Strategy
          • Product Strategy
          • Channel Strategy
      • RPC Group Plc
        • Overview
        • Product Portfolio
        • Profitability by Market Segments (Product/Age /Sales Channel/Region)
        • Sales Footprint
        • Strategy Overview
          • Marketing Strategy
          • Product Strategy
          • Channel Strategy
      • Lacerta Group, Inc.
        • Overview
        • Product Portfolio
        • Profitability by Market Segments (Product/Age /Sales Channel/Region)
        • Sales Footprint
        • Strategy Overview
          • Marketing Strategy
          • Product Strategy
          • Channel Strategy
      • Marlin Steel Wire Products LLC
        • Overview
        • Product Portfolio
        • Profitability by Market Segments (Product/Age /Sales Channel/Region)
        • Sales Footprint
        • Strategy Overview
          • Marketing Strategy
          • Product Strategy
          • Channel Strategy
      • Argus Steel Products
        • Overview
        • Product Portfolio
        • Profitability by Market Segments (Product/Age /Sales Channel/Region)
        • Sales Footprint
        • Strategy Overview
          • Marketing Strategy
          • Product Strategy
          • Channel Strategy
  20. Assumptions & Acronyms Used
  21. Research Methodology

List of Tables

  • Table 1: Global Market Value (USD Billion) Forecast by Region, 2020-2035
  • Table 2: Global Market Volume (Units) Forecast by Region, 2020-2035
  • Table 3: Global Market Value (USD Billion) Forecast by Material Type, 2020-2035
  • Table 4: Global Market Volume (Units) Forecast by Material Type, 2020-2035
  • Table 5: Global Market Value (USD Billion) Forecast by Tray Type, 2020-2035
  • Table 6: Global Market Volume (Units) Forecast by Tray Type, 2020-2035
  • Table 7: Global Market Value (USD Billion) Forecast by End-Use Setting, 2020-2035
  • Table 8: Global Market Volume (Units) Forecast by End-Use Setting, 2020-2035
  • Table 9: North America Market Value (USD Billion) Forecast by Country, 2020-2035
  • Table 10: North America Market Volume (Units) Forecast by Country, 2020-2035
  • Table 11: North America Market Value (USD Billion) Forecast by Material Type, 2020-2035
  • Table 12: North America Market Volume (Units) Forecast by Material Type, 2020-2035
  • Table 13: North America Market Value (USD Billion) Forecast by Tray Type, 2020-2035
  • Table 14: North America Market Volume (Units) Forecast by Tray Type, 2020-2035
  • Table 15: North America Market Value (USD Billion) Forecast by End-Use Setting, 2020-2035
  • Table 16: North America Market Volume (Units) Forecast by End-Use Setting, 2020-2035
  • Table 17: Latin America Market Value (USD Billion) Forecast by Country, 2020-2035
  • Table 18: Latin America Market Volume (Units) Forecast by Country, 2020-2035
  • Table 19: Latin America Market Value (USD Billion) Forecast by Material Type, 2020-2035
  • Table 20: Latin America Market Volume (Units) Forecast by Material Type, 2020-2035
  • Table 21: Latin America Market Value (USD Billion) Forecast by Tray Type, 2020-2035
  • Table 22: Latin America Market Volume (Units) Forecast by Tray Type, 2020-2035
  • Table 23: Latin America Market Value (USD Billion) Forecast by End-Use Setting, 2020-2035
  • Table 24: Latin America Market Volume (Units) Forecast by End-Use Setting, 2020-2035
  • Table 25: Europe Market Value (USD Billion) Forecast by Country, 2020-2035
  • Table 26: Europe Market Volume (Units) Forecast by Country, 2020-2035
  • Table 27: Europe Market Value (USD Billion) Forecast by Material Type, 2020-2035
  • Table 28: Europe Market Volume (Units) Forecast by Material Type, 2020-2035
  • Table 29: Europe Market Value (USD Billion) Forecast by Tray Type, 2020-2035
  • Table 30: Europe Market Volume (Units) Forecast by Tray Type, 2020-2035
  • Table 31: Europe Market Value (USD Billion) Forecast by End-Use Setting, 2020-2035
  • Table 32: Europe Market Volume (Units) Forecast by End-Use Setting, 2020-2035
  • Table 33: East Asia Market Value (USD Billion) Forecast by Country, 2020-2035
  • Table 34: East Asia Market Volume (Units) Forecast by Country, 2020-2035
  • Table 35: East Asia Market Value (USD Billion) Forecast by Material Type, 2020-2035
  • Table 36: East Asia Market Volume (Units) Forecast by Material Type, 2020-2035
  • Table 37: East Asia Market Value (USD Billion) Forecast by Tray Type, 2020-2035
  • Table 38: East Asia Market Volume (Units) Forecast by Tray Type, 2020-2035
  • Table 39: East Asia Market Value (USD Billion) Forecast by End-Use Setting, 2020-2035
  • Table 40: East Asia Market Volume (Units) Forecast by End-Use Setting, 2020-2035
  • Table 41: South Asia Market Value (USD Billion) Forecast by Country, 2020-2035
  • Table 42: South Asia Market Volume (Units) Forecast by Country, 2020-2035
  • Table 43: South Asia Market Value (USD Billion) Forecast by Material Type, 2020-2035
  • Table 44: South Asia Market Volume (Units) Forecast by Material Type, 2020-2035
  • Table 45: South Asia Market Value (USD Billion) Forecast by Tray Type, 2020-2035
  • Table 46: South Asia Market Volume (Units) Forecast by Tray Type, 2020-2035
  • Table 47: South Asia Market Value (USD Billion) Forecast by End-Use Setting, 2020-2035
  • Table 48: South Asia Market Volume (Units) Forecast by End-Use Setting, 2020-2035
  • Table 49: Oceania Market Value (USD Billion) Forecast by Country, 2020-2035
  • Table 50: Oceania Market Volume (Units) Forecast by Country, 2020-2035
  • Table 51: Oceania Market Value (USD Billion) Forecast by Material Type, 2020-2035
  • Table 52: Oceania Market Volume (Units) Forecast by Material Type, 2020-2035
  • Table 53: Oceania Market Value (USD Billion) Forecast by Tray Type, 2020-2035
  • Table 54: Oceania Market Volume (Units) Forecast by Tray Type, 2020-2035
  • Table 55: Oceania Market Value (USD Billion) Forecast by End-Use Setting, 2020-2035
  • Table 56: Oceania Market Volume (Units) Forecast by End-Use Setting, 2020-2035
  • Table 57: MEA Market Value (USD Billion) Forecast by Country, 2020-2035
  • Table 58: MEA Market Volume (Units) Forecast by Country, 2020-2035
  • Table 59: MEA Market Value ( Billion) Forecast by Material Type, 2020-2035
  • Table 60: MEA Market Volume (Units) Forecast by Material Type, 2020-2035
  • Table 61: MEA Market Value (USD Billion) Forecast by Tray Type, 2020-2035
  • Table 62: MEA Market Volume (Units) Forecast by Tray Type, 2020-2035
  • Table 63: MEA Market Value (USD Billion) Forecast by End-Use Setting, 2020-2035
  • Table 64: MEA Market Volume (Units) Forecast by End-Use Setting, 2020-2035

List of Figures

  • Figure 1: Global Market Volume (Units) Forecast 2020-2035
  • Figure 2: Global Market Pricing Analysis
  • Figure 3: Global Market Value (USD Billion) Forecast 2020-2035
  • Figure 4: Global Market Value Share and BPS Analysis by Material Type, 2025 and 2035
  • Figure 5: Global Market Y-o-Y Growth Comparison by Material Type, 2025-2035
  • Figure 6: Global Market Attractiveness Analysis by Material Type
  • Figure 7: Global Market Value Share and BPS Analysis by Tray Type, 2025 and 2035
  • Figure 8: Global Market Y-o-Y Growth Comparison by Tray Type, 2025-2035
  • Figure 9: Global Market Attractiveness Analysis by Tray Type
  • Figure 10: Global Market Value Share and BPS Analysis by End-Use Setting, 2025 and 2035
  • Figure 11: Global Market Y-o-Y Growth Comparison by End-Use Setting, 2025-2035
  • Figure 12: Global Market Attractiveness Analysis by End-Use Setting
  • Figure 13: Global Market Value (USD Billion) Share and BPS Analysis by Region, 2025 and 2035
  • Figure 14: Global Market Y-o-Y Growth Comparison by Region, 2025-2035
  • Figure 15: Global Market Attractiveness Analysis by Region
  • Figure 16: North America Market Incremental $ Opportunity, 2025-2035
  • Figure 17: Latin America Market Incremental $ Opportunity, 2025-2035
  • Figure 18: Europe Market Incremental $ Opportunity, 2025-2035
  • Figure 19: East Asia Market Incremental $ Opportunity, 2025-2035
  • Figure 20: South Asia Market Incremental $ Opportunity, 2025-2035
  • Figure 21: Oceania Market Incremental $ Opportunity, 2025-2035
  • Figure 22: MEA Market Incremental $ Opportunity, 2025-2035
  • Figure 23: North America Market Value Share and BPS Analysis by Country, 2025 and 2035
  • Figure 24: North America Market Value Share and BPS Analysis by Material Type, 2025 and 2035
  • Figure 25: North America Market Y-o-Y Growth Comparison by Material Type, 2025-2035
  • Figure 26: North America Market Attractiveness Analysis by Material Type
  • Figure 27: North America Market Value Share and BPS Analysis by Tray Type, 2025 and 2035
  • Figure 28: North America Market Y-o-Y Growth Comparison by Tray Type, 2025-2035
  • Figure 29: North America Market Attractiveness Analysis by Tray Type
  • Figure 30: North America Market Value Share and BPS Analysis by End-Use Setting, 2025 and 2035
  • Figure 31: North America Market Y-o-Y Growth Comparison by End-Use Setting, 2025-2035
  • Figure 32: North America Market Attractiveness Analysis by End-Use Setting
  • Figure 33: Latin America Market Value Share and BPS Analysis by Country, 2025 and 2035
  • Figure 34: Latin America Market Value Share and BPS Analysis by Material Type, 2025 and 2035
  • Figure 35: Latin America Market Y-o-Y Growth Comparison by Material Type, 2025-2035
  • Figure 36: Latin America Market Attractiveness Analysis by Material Type
  • Figure 37: Latin America Market Value Share and BPS Analysis by Tray Type, 2025 and 2035
  • Figure 38: Latin America Market Y-o-Y Growth Comparison by Tray Type, 2025-2035
  • Figure 39: Latin America Market Attractiveness Analysis by Tray Type
  • Figure 40: Latin America Market Value Share and BPS Analysis by End-Use Setting, 2025 and 2035
  • Figure 41: Latin America Market Y-o-Y Growth Comparison by End-Use Setting, 2025-2035
  • Figure 42: Latin America Market Attractiveness Analysis by End-Use Setting
  • Figure 43: Europe Market Value Share and BPS Analysis by Country, 2025 and 2035
  • Figure 44: Europe Market Value Share and BPS Analysis by Material Type, 2025 and 2035
  • Figure 45: Europe Market Y-o-Y Growth Comparison by Material Type, 2025-2035
  • Figure 46: Europe Market Attractiveness Analysis by Material Type
  • Figure 47: Europe Market Value Share and BPS Analysis by Tray Type, 2025 and 2035
  • Figure 48: Europe Market Y-o-Y Growth Comparison by Tray Type, 2025-2035
  • Figure 49: Europe Market Attractiveness Analysis by Tray Type
  • Figure 50: Europe Market Value Share and BPS Analysis by End-Use Setting, 2025 and 2035
  • Figure 51: Europe Market Y-o-Y Growth Comparison by End-Use Setting, 2025-2035
  • Figure 52: Europe Market Attractiveness Analysis by End-Use Setting
  • Figure 53: East Asia Market Value Share and BPS Analysis by Country, 2025 and 2035
  • Figure 54: East Asia Market Value Share and BPS Analysis by Material Type, 2025 and 2035
  • Figure 55: East Asia Market Y-o-Y Growth Comparison by Material Type, 2025-2035
  • Figure 56: East Asia Market Attractiveness Analysis by Material Type
  • Figure 57: East Asia Market Value Share and BPS Analysis by Tray Type, 2025 and 2035
  • Figure 58: East Asia Market Y-o-Y Growth Comparison by Tray Type, 2025-2035
  • Figure 59: East Asia Market Attractiveness Analysis by Tray Type
  • Figure 60: East Asia Market Value Share and BPS Analysis by End-Use Setting, 2025 and 2035
  • Figure 61: East Asia Market Y-o-Y Growth Comparison by End-Use Setting, 2025-2035
  • Figure 62: East Asia Market Attractiveness Analysis by End-Use Setting
  • Figure 63: South Asia Market Value Share and BPS Analysis by Country, 2025 and 2035
  • Figure 64: South Asia Market Value Share and BPS Analysis by Material Type, 2025 and 2035
  • Figure 65: South Asia Market Y-o-Y Growth Comparison by Material Type, 2025-2035
  • Figure 66: South Asia Market Attractiveness Analysis by Material Type
  • Figure 67: South Asia Market Value Share and BPS Analysis by Tray Type, 2025 and 2035
  • Figure 68: South Asia Market Y-o-Y Growth Comparison by Tray Type, 2025-2035
  • Figure 69: South Asia Market Attractiveness Analysis by Tray Type
  • Figure 70: South Asia Market Value Share and BPS Analysis by End-Use Setting, 2025 and 2035
  • Figure 71: South Asia Market Y-o-Y Growth Comparison by End-Use Setting, 2025-2035
  • Figure 72: South Asia Market Attractiveness Analysis by End-Use Setting
  • Figure 73: Oceania Market Value Share and BPS Analysis by Country, 2025 and 2035
  • Figure 74: Oceania Market Value Share and BPS Analysis by Material Type, 2025 and 2035
  • Figure 75: Oceania Market Y-o-Y Growth Comparison by Material Type, 2025-2035
  • Figure 76: Oceania Market Attractiveness Analysis by Material Type
  • Figure 77: Oceania Market Value Share and BPS Analysis by Tray Type, 2025 and 2035
  • Figure 78: Oceania Market Y-o-Y Growth Comparison by Tray Type, 2025-2035
  • Figure 79: Oceania Market Attractiveness Analysis by Tray Type
  • Figure 80: Oceania Market Value Share and BPS Analysis by End-Use Setting, 2025 and 2035
  • Figure 81: Oceania Market Y-o-Y Growth Comparison by End-Use Setting, 2025-2035
  • Figure 82: Oceania Market Attractiveness Analysis by End-Use Setting
  • Figure 83: MEA Market Value Share and BPS Analysis by Country, 2025 and 2035
  • Figure 84: MEA Market Value Share and BPS Analysis by Material Type, 2025 and 2035
  • Figure 85: MEA Market Y-o-Y Growth Comparison by Material Type, 2025-2035
  • Figure 86: MEA Market Attractiveness Analysis by Material Type
  • Figure 87: MEA Market Value Share and BPS Analysis by Tray Type, 2025 and 2035
  • Figure 88: MEA Market Y-o-Y Growth Comparison by Tray Type, 2025-2035
  • Figure 89: MEA Market Attractiveness Analysis by Tray Type
  • Figure 90: MEA Market Value Share and BPS Analysis by End-Use Setting, 2025 and 2035
  • Figure 91: MEA Market Y-o-Y Growth Comparison by End-Use Setting, 2025-2035
  • Figure 92: MEA Market Attractiveness Analysis by End-Use Setting
  • Figure 93: Global Market - Tier Structure Analysis
  • Figure 94: Global Market - Company Share Analysis

Frequently Asked Questions

What was the overall size of the pharma trays market in 2025?

The overall market size for the pharma trays market was USD 7.4 billion in 2025.

How big is the pharma trays market expected to be in 2035?

The pharma trays market is expected to reach USD 14.3 billion in 2035.

What will drive the demand for the pharma trays market during the forecast period?

The demand for pharma trays is rising due to increasing pharmaceutical production, growing emphasis on sterile packaging, and the need for safe handling and transport of medical devices and drugs. The adoption of sterilization trays and cost-effective plastic materials is further accelerating market growth.

List the top 5 countries contributing to the pharma trays market.

The top 5 countries driving the development of the pharma trays market are the USA, Germany, China, Japan, and India.

Which segment in the type and material category is expected to lead in the pharma trays market?

Sterilization trays and plastic materials are expected to command a significant share over the assessment period.

Explore Similar Insights

Future Market Insights

Pharma Trays Market