Petroleum Liquid Feedstock Market Size and Share Forecast Outlook 2025 to 2035

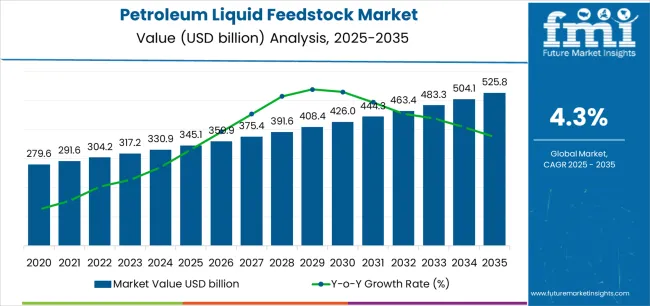
The petroleum liquid feedstock market stands at the threshold of a decade-long expansion trajectory that promises to reshape refining operations and petrochemical production technology. The market's journey from USD 345.1 billion in 2025 to USD 525.8 billion by 2035 represents substantial growth, demonstrating the accelerating adoption of advanced refining processes and optimized feedstock utilization across petroleum refineries, petrochemical complexes, and integrated energy facilities.

The first half of the decade (2025-2030) will witness the market climbing from USD 345.1 billion to approximately USD 420 billion, adding USD 74.9 billion in value, which constitutes 41% of the total forecast growth period. This phase will be characterized by the rapid expansion of petrochemical integration projects, driven by increasing downstream demand for chemicals and plastics, and the growing need for advanced cracking technologies and feedstock optimization solutions worldwide. Enhanced conversion capabilities and process efficiency systems will become standard expectations rather than premium options.

The latter half (2030-2035) will witness continued growth from USD 420 billion to USD 525.8 billion, representing an addition of USD 105.8 billion or 59% of the decade's expansion. This period will be defined by mass market penetration of integrated refinery-petrochemical complexes, adoption of advanced conversion technologies, and seamless compatibility with renewable feedstock integration initiatives. The market trajectory signals fundamental shifts in how energy companies approach feedstock management and value chain optimization, with participants positioned to benefit from growing demand across multiple product types and application segments.
Quick Stats for Petroleum Liquid Feedstock Market

  • Petroleum Liquid Feedstock Market Value (2025): USD 345.1 billion
  • Petroleum Liquid Feedstock Market Forecast Value (2035): USD 525.8 billion
  • Petroleum Liquid Feedstock Market Forecast CAGR: 4.30%
  • Leading Product Type in Petroleum Liquid Feedstock Market: Heavy Naphtha
  • Key Growth Regions in Petroleum Liquid Feedstock Market: Asia Pacific, Middle East, and North America
  • Top Key Players in Petroleum Liquid Feedstock Market: ExxonMobil Corporation, Saudi Aramco, Royal Dutch Shell plc, TotalEnergies SE, Reliance Industries Limited
  • Where Revenue Comes From - Now vs Next (Industry-Level View)

Petroleum Liquid Feedstock Market Market Value Analysis

Period Primary Revenue Buckets Share Notes
Today Petroleum refining feedstock 42% Traditional crude distillation, hydroprocessing
Petrochemical naphtha cracking 28% Ethylene, propylene production
Fuel blending components 15% Gasoline, diesel optimization
Aromatics production feedstock 10% BTX extraction, xylene isomerization
Hydrocracking applications 5% Middle distillate production
Future (3-5 yrs) Integrated petrochemical complexes 35-40% Refinery-chemical integration, crude-to-chemicals
Advanced cracking technologies 25-30% Steam cracking, catalytic cracking optimization
Specialty chemical feedstocks 12-18% High-value derivatives, performance chemicals
Low-carbon fuel components 10-15% Renewable integration, hybrid feedstocks
Aromatics & BTX production 8-12% Para-xylene demand, benzene applications
Circular economy feedstocks 3-8% Plastic pyrolysis oil, waste-derived streams

Market Key Takeaways

Metric Value
Market Value (2025) USD 345.1 billion
Market Forecast (2035) USD 525.8 billion
Growth Rate 4.30% CAGR
Leading Product Type Heavy Naphtha
Primary Application Petroleum Refining

The market demonstrates strong fundamentals with heavy naphtha capturing a dominant share through versatile refining applications and optimal conversion characteristics. Petroleum refining applications drive primary demand, supported by increasing global energy consumption and transportation fuel requirements. Geographic expansion remains concentrated in Asia Pacific and Middle East with expanding refining capacity, while developed markets show steady demand driven by petrochemical integration and value optimization initiatives.

Imperatives for Stakeholders in Petroleum Liquid Feedstock Market

Optimize for Integration and Flexibility

  • Offer comprehensive refining solutions: feedstock optimization + process integration + technology licensing + catalyst packages + technical support
  • Preconfigured processing pathways: conversion optimization, product slate flexibility, energy efficiency protocols, and performance monitoring for refining operations

Technology Leadership and Innovation

  • Advanced conversion technologies, catalytic process optimization, and digital refining integration (process control systems, predictive maintenance, real-time optimization)
  • Integration with renewable feedstock processing and circular economy material streams

Sustainability and Decarbonization Focus

  • Carbon intensity reduction programs, energy efficiency optimization, circular feedstock integration, and emissions tracking systems
  • Renewable integration pathways and low-carbon hydrogen utilization for hydroprocessing applications

Value Chain Optimization Models

  • Transparent feedstock pricing mechanisms + flexible supply contracts (volume flexibility, quality specifications, logistics optimization)
  • Long-term strategic partnerships with technology providers and downstream chemical producers

Segmental Analysis

Primary Classification

The market segments by product type into heavy naphtha, light naphtha, gas oil, natural gas liquids, and other petroleum fractions, representing the evolution from straight-run distillation products to sophisticated feedstock blends for comprehensive refining and petrochemical optimization.

Secondary Classification

Application segmentation divides the market into petroleum refining, fuel blending, hydrocracking, aromatics production, and lubricant production sectors, reflecting distinct requirements for conversion processes, product quality specifications, and economic value optimization across diverse end-use applications.

Tertiary Classification

Geographic segmentation covers major producing and consuming regions including Asia Pacific (China, India, Japan, South Korea), North America (United States, Canada), Europe (Germany, United Kingdom, France), Middle East (Saudi Arabia, UAE, Kuwait), and emerging markets in Latin America and Africa.

The segmentation structure reveals industry progression from traditional refining operations toward integrated petrochemical complexes with enhanced conversion efficiency and product value optimization, while application diversity spans from transportation fuel production to high-value chemical intermediate manufacturing requiring precise feedstock quality and processing technology solutions.
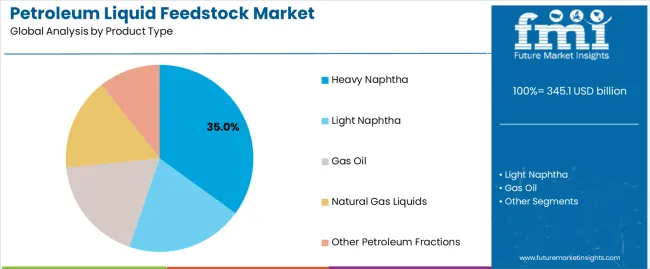
By Product Type, Heavy Naphtha Segment Accounts for Dominant Market Share

Petroleum Liquid Feedstock Market Analysis By Product Type

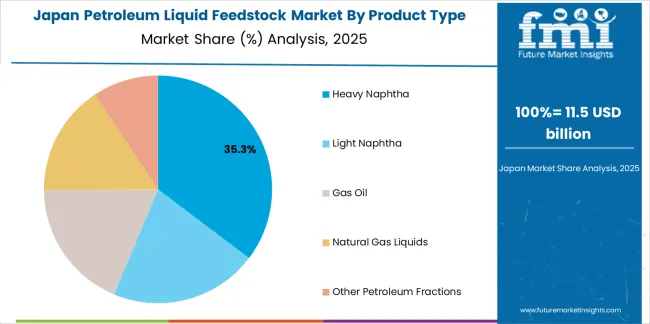
Market Position: Heavy naphtha commands the leading position in the petroleum liquid feedstock market with approximately 35% market share through versatile refining applications, including catalytic reforming for aromatics production, petrochemical cracking feedstock, and gasoline blending components that enable refineries to maximize value extraction from crude oil across diverse processing configurations.

Value Drivers: The segment benefits from refinery preference for flexible feedstock streams that provide multiple processing options, optimal reforming yields for high-octane gasoline components, and suitable properties for ethylene cracker feedstock without requiring extensive pre-treatment. Advanced processing capabilities enable aromatics extraction, hydrogen production through reforming, and integration with both fuel and chemical production pathways, where product flexibility and economic optimization represent critical operational requirements.

Competitive Advantages: Heavy Naphtha differentiates through proven processing versatility, established technology platforms for conversion, and compatibility with existing refinery infrastructure that enhance facility economics while maintaining optimal yields suitable for diverse market conditions and product slate requirements.

Key market characteristics:

  • Versatile processing designs with optimized reforming characteristics and cracking performance capabilities
  • Enhanced conversion effectiveness, enabling 80-85% aromatics yields in reforming and suitable ethylene production in steam cracking
  • Refinery compatibility, including existing unit integration, catalyst technology optimization, and process flexibility for market-driven product slate adjustments

Light Naphtha Shows Petrochemical Growth Leadership

Light Naphtha maintains approximately 25% market position due to preferred characteristics for petrochemical steam cracking operations, where lower molecular weight and optimal hydrogen-to-carbon ratio provide superior ethylene and propylene yields. Market growth is driven by petrochemical capacity expansion, particularly in Asia Pacific and Middle East regions implementing world-scale ethylene crackers requiring light hydrocarbon feedstocks.

Market Intelligence Brief:

  • Petrochemical crackers representing 70% of light naphtha consumption globally
  • Middle East producers leveraging advantaged ethane access blending with light naphtha for optimal cracker economics
  • Asian integrated complexes preferring light naphtha for flexibility between fuel and chemical applications
  • Premium pricing versus heavy naphtha reflecting superior olefin yields and processing economics

Gas Oil Demonstrates Refining Versatility

Gas Oil captures approximately 20% market share through critical applications in hydrocracking for diesel and jet fuel production, fluid catalytic cracking feedstock for gasoline manufacturing, and specialty applications in lubricant base stock production. The segment shows steady growth aligned with middle distillate demand in transportation and aviation sectors.

Value Drivers:

  • Hydrocracking applications converting heavy gas oil to high-value diesel and jet fuel products
  • FCC feedstock role maximizing gasoline production in gasoline-focused refineries
  • Quality specifications driving premium pricing for low-sulfur, high-cetane gas oil streams

Natural Gas Liquids Expand Petrochemical Integration

Natural Gas Liquids account for approximately 15% market share, including ethane, propane, and butane streams serving petrochemical cracking operations, fuel blending applications, and LPG markets. The segment demonstrates strong growth driven by shale gas production in North America and associated gas monetization in Middle East regions.

Growth Characteristics:

  • Ethane emerging as preferred steam cracker feedstock for maximum ethylene production
  • Propane and butane serving dual role as petrochemical feedstocks and LPG fuel markets
  • Infrastructure development enabling NGL transportation and fractionation capacity expansion

Other Product Types Serve Specialized Applications

Other petroleum liquid feedstocks including condensates, raffinate streams, and specialty refinery cuts capture remaining market share through niche applications requiring specific processing characteristics or serving as blending components for optimizing refinery operations and product quality specifications.
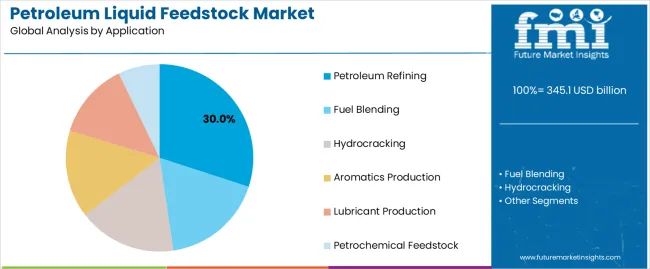
By Application, Petroleum Refining Drives Market Volume

Petroleum Liquid Feedstock Market Analysis By Application

Market Context: Petroleum Rrefining applications dominate the market with steady growth reflecting continued global demand for transportation fuels, heating oil, and industrial energy products that require petroleum liquid feedstocks as primary processing inputs across refinery conversion units.

Appeal Factors: Refining operators prioritize feedstock quality, processing flexibility, and economic optimization that enable maximum value extraction from crude oil while meeting product specifications and environmental regulations. The segment benefits from substantial refinery investment in upgrading and integration projects that emphasize advanced conversion technologies for heavy crude processing and product quality improvement.

Growth Drivers: Transportation fuel demand in developing economies, aviation sector recovery, and marine fuel quality requirements drive continued petroleum refining activity. Refinery modernization programs incorporating hydrocracking and residue upgrading units create sustained demand for appropriate feedstock streams.

Application dynamics include:

  • Strong growth in Asia Pacific refining capacity serving regional demand growth
  • Increasing complexity in refinery configurations requiring diverse feedstock slates
  • Rising integration with petrochemical production for value optimization

Fuel Blending Applications Maintain Steady Demand

Fuel Blending captures approximately 20% application share through critical role in gasoline and diesel specification compliance, where naphtha streams, reformate, and other components blend to meet octane, volatility, and emissions requirements across diverse regulatory environments.

Hydrocracking Shows Technology-Driven Growth

Hydrocracking applications account for approximately 15% market share, serving heavy oil upgrading operations that convert vacuum gas oil and other heavy feedstocks into high-value diesel, jet fuel, and lubricant base stocks through advanced catalytic processes requiring hydrogen integration.

Aromatics Production Demonstrates High-Value Applications

Aromatics Production captures approximately 12% application share through extraction of benzene, toluene, and xylenes from reformate and pyrolysis gasoline streams, serving downstream markets for polyester fibers, plastics, solvents, and chemical intermediates with premium pricing for high-purity aromatics.

Lubricant Production Maintains Specialty Position

Lubricant Production applications account for approximately 8% market share through specialized processing of heavy naphtha and gas oil streams into high-quality base stocks for automotive, industrial, and marine lubricant formulations requiring specific viscosity and performance characteristics.

By Region, Asia Pacific Leads Market Growth

Market Context: Asia Pacific dominates the petroleum liquid feedstock market with fastest growth rate driven by expanding refining capacity, rapid petrochemical development, and increasing energy demand across China, India, and Southeast Asian nations requiring comprehensive feedstock supply and processing infrastructure.

Business Model Advantages: The region provides largest consumption volumes for both refining and petrochemical applications, driving sustained feedstock demand while supporting integrated complex development that maximizes crude oil value through chemical production integration and advanced conversion technologies.

Operational Benefits: Asia Pacific markets benefit from proximity to Middle East crude suppliers, established petrochemical downstream markets, and government support for refining and chemical industry development that create integrated value chains and competitive manufacturing economics for petroleum liquid feedstock utilization.

Drivers, Restraints, and Key Trends of the Petroleum Liquid Feedstock Market

Category Factor Impact Why It Matters
Driver Petrochemical capacity expansion (especially Asia Pacific & Middle East) ★★★★★ New world-scale crackers and aromatics complexes create sustained feedstock demand; integrated projects drive long-term offtake agreements
Driver Refinery-petrochemical integration trends (crude-to-chemicals concepts) ★★★★★ Maximizes crude oil value by increasing chemical yields from 10-15% to 40-50%; fundamentally reshapes feedstock allocation and pricing dynamics
Driver Transportation fuel demand growth (developing economies, aviation recovery) ★★★★☆ Sustained mobility growth in Asia, Africa requires refining capacity additions; quality specifications drive demand for optimal feedstock blends
Restraint Energy transition & electric vehicle adoption (long-term demand pressure) ★★★★☆ EV penetration reduces gasoline demand growth; refining industry must pivot toward petrochemical integration and sustainable aviation fuel
Restraint Crude oil price volatility & margin pressure ★★★★☆ Feedstock cost fluctuations impact refining economics; margin compression during crude price spikes reduces processing profitability
Restraint Environmental regulations & carbon pricing ★★★☆☆ Emissions restrictions increase processing costs; carbon pricing mechanisms impact refinery competitiveness and investment economics
Trend Circular economy feedstocks (plastic pyrolysis oil, bio-based streams) ★★★★★ Waste plastic conversion to chemical feedstocks enables circular plastics; refiners and chemical producers developing processing capabilities
Trend Digital optimization & advanced process control ★★★★☆ AI-driven refinery optimization maximizes yields and energy efficiency; real-time feedstock selection and blending optimization improve margins
Trend Hydrogen economy integration (hydroprocessing, clean fuels) ★★★★☆ Low-carbon hydrogen enables deep desulfurization and heavy oil upgrading; green hydrogen integration reduces carbon intensity of refining operations

Analysis of the Petroleum Liquid Feedstock Market by Key Country

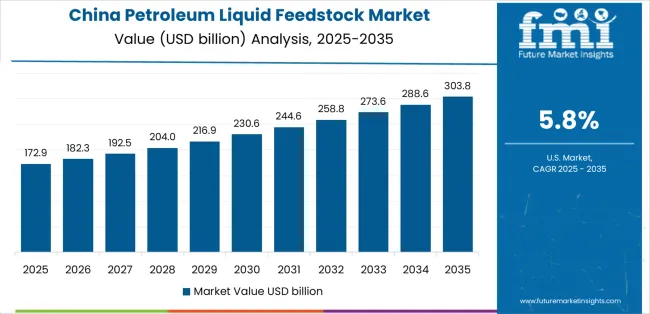
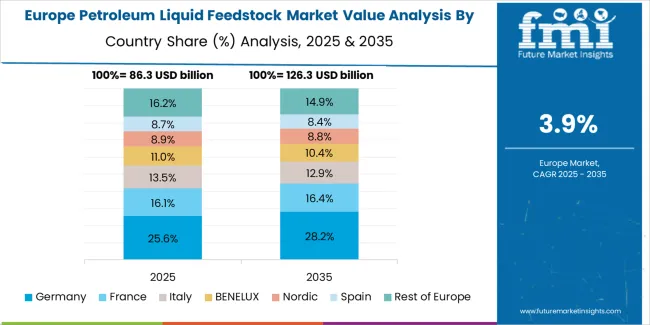
The petroleum liquid feedstock market demonstrates varied regional growth dynamics, with Growth Leaders including China (5.8% growth rate) and India (5.4% growth rate) driving expansion through rapid refinery capacity additions, petrochemical sector integration, and strong domestic demand for industrial and transport fuels. Steady Performers include the United States (4.1% growth rate) and Germany (4.9% growth rate), where mature refining industries benefit from modernization programs, integration of cleaner processing technologies, and stable demand from established downstream industries. Emerging Markets feature the United Kingdom (3.7% growth rate) and Japan (3.2% growth rate), where slower demand growth is balanced by investments in refinery optimization, energy efficiency, and adoption of lower-carbon liquid feedstock strategies.

Regional synthesis indicates that Asia-Pacific dominates global expansion, led by China and India, where petrochemical demand, urbanization, and industrial growth are fueling higher feedstock consumption. North America demonstrates stable performance, supported by advanced refining technologies, shale integration, and compliance with evolving environmental regulations. Europe shows moderate growth, emphasizing sustainability frameworks, quality integration, and steady consumption in industrial sectors. Together, these dynamics illustrate a market where emerging Asia anchors growth, while mature Western regions contribute through technology leadership, regulatory compliance, and refinery modernization.
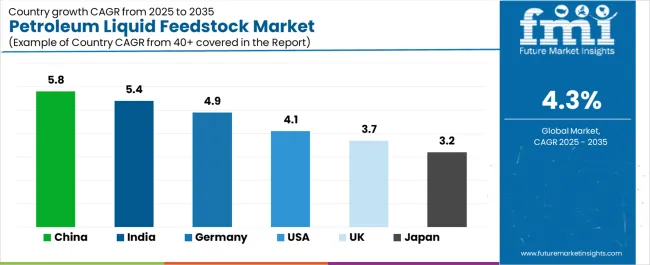
Petroleum Liquid Feedstock Market Cagr Analysis By Country

Region/Country 2025–2035 Growth How to Win What to Watch Out
India 5.4% Invest in downstream integration & refinery upgrades Infrastructure bottlenecks; import dependency
China 5.8% Expand petrochemical integration & scale efficiencies Policy shifts; oversupply risks
United States 4.1% Leverage shale integration & advanced refining Environmental regulation; CAPEX intensity
Germany 4.9% Drive efficiency & low-carbon feedstock adoption High energy costs; sustainability pressures
UK 3.7% Focus on flexible, cleaner feedstock supply Brexit trade impacts; aging refinery base
Japan 3.2% Prioritize high-quality specialty feedstocks Slow demand growth; aging industrial assets

India Drives Rising Demand for Petroleum Feedstocks

India demonstrates strong growth in the petroleum liquid feedstock market, recording a 5.4% CAGR through 2035. Expansion is anchored by large-scale refinery modernization programs and integration of downstream petrochemical capacity in hubs like Jamnagar, Vadodara, and Visakhapatnam. The government’s focus on energy security and import substitution fuels investments in both refining and petrochemical feedstock production. India’s growing vehicle fleet and industrialization increase demand for naphtha, reformates, and other liquid feedstocks. Indian refiners are focusing on cost efficiency and capacity expansion while international suppliers are exploring strategic partnerships with state-owned enterprises to secure long-term demand.

Strategic Market Indicators:
  • Refinery modernization programs supporting high-capacity liquid feedstock production.
  • Government-backed investment in petrochemical clusters driving feedstock demand.
  • Local refiners capturing greater market share with competitive costs and integrated logistics.
  • Export development targeting South Asia and Africa for surplus petroleum feedstock.

China Anchors Global Market Expansion

Petroleum Liquid Feedstock Market Country Value Analysis

China records the highest growth rate at 5.8% CAGR through 2035, maintaining its position as the largest petroleum liquid feedstock consumer. Growth is fueled by rapid petrochemical sector expansion, massive refinery integration projects, and energy security policies. Regions such as Shandong, Zhejiang, and Guangdong host large independent refiners (“teapot refiners”) and state-owned giants, all of which are expanding liquid feedstock capacity. China’s policies emphasize self-reliance in fuel and petrochemical supply, driving large investments in refining complexes. International players must localize operations and protect intellectual property to succeed.

Strategic Market Indicators:
  • National refiners leading adoption with high-volume feedstock throughput.
  • State-backed energy initiatives supporting refinery capacity expansion.
  • Local producers securing ~60% of domestic share through scale efficiencies.
  • Export expansion into Asia-Pacific through surplus capacity.

Germany Sustains Steady European Growth

Petroleum Liquid Feedstock Market Europe Country Market Share Analysis, 2025 & 2035

Germany grows at a 4.9% CAGR through 2035, leveraging its advanced chemical industry and strong demand for naphtha and petrochemical feedstocks. Growth is centered in Bavaria, Hamburg, and North Rhine-Westphalia, where chemical clusters and integrated refineries anchor demand. Germany emphasizes low-carbon transition, with refiners incorporating efficiency improvements and co-processing of renewable feedstocks. International suppliers must align with Germany’s sustainability-focused regulations while ensuring premium quality standards.

Strategic Market Indicators:

  • EU sustainability mandates driving green feedstock adoption.
  • Strong petrochemical demand for high-purity naphtha.
  • Local refineries supplying ~40% of domestic feedstock needs.
  • Imports remain critical due to energy cost and supply challenges.

United States Maintains Stable Expansion

The USA petroleum liquid feedstock market expands at a 4.1% CAGR through 2035, supported by shale oil integration, advanced refining systems, and petrochemical growth in the Gulf Coast region. Major hubs include Texas, Louisiana, and Illinois, where large integrated refineries supply both domestic and export markets. Demand growth is tempered by energy transition policies and stricter environmental regulations, but advanced refining capabilities support consistent throughput. To succeed, suppliers must provide compliance-driven, efficient feedstocks and adapt to regulatory cost pressures.

Strategic Market Indicators:

  • Gulf Coast refineries dominating with large-scale petrochemical integration.
  • Environmental compliance increasing operational costs.
  • Domestic refiners holding ~70% share with strong export orientation.
  • Export demand supported by Latin America and Asia-Pacific markets.

United Kingdom Shows Moderate Progress

The UK grows at a 3.7% CAGR through 2035, reflecting slow but steady refinery modernization efforts. Demand is centered in Grangemouth and Humber regions, with focus on meeting domestic fuel needs and supplying petrochemical inputs. Post-Brexit trade complexities and aging refinery infrastructure remain challenges. International players must emphasize flexible, lower-carbon feedstock solutions to capture opportunities.

Strategic Market Indicators:
  • Aging refinery base undergoing gradual modernization.
  • Brexit impacting trade flows and import dependencies.
  • Domestic refiners capturing ~55% of market demand.
  • Imports from EU and Middle East critical for supply balancing.

Japan Focuses on Efficiency and Specialization

Petroleum Liquid Feedstock Market Japan Market Share Analysis By Product Type

Japan records a 3.2% CAGR through 2035, reflecting slower growth compared to emerging Asian markets. Demand is driven by specialty petrochemical feedstocks and high-efficiency refining, with hubs in Yokohama, Osaka, and Nagoya. With an aging population and plateauing domestic fuel demand, growth relies on export-driven petrochemical production. Japanese refiners focus on precision, reliability, and integration of cleaner technologies, prioritizing efficiency over volume.

Strategic Market Indicators:
  • Specialty feedstock demand sustaining refinery utilization.
  • Strong emphasis on energy efficiency and emissions reduction.
  • Local refiners controlling ~75% of feedstock supply.
  • Export development into East Asia and Southeast Asia markets.

Competitive Landscape

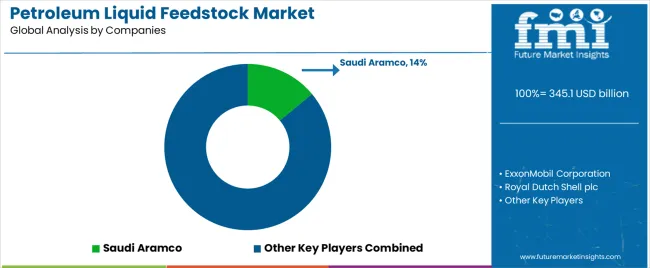
Petroleum Liquid Feedstock Market Analysis By Company

  • Structure: ~30-40 major integrated players globally; top 10-15 hold ~65-75% by refining capacity
  • Leadership is maintained through: integrated value chains, technology capabilities, and feedstock flexibility (crude sourcing + processing complexity + market access)
  • What's commoditizing: standard naphtha streams and conventional refining operations
  • Margin Opportunities: petrochemical integration, specialty products, and circular feedstock processing
Stakeholder What they actually control Typical strengths Typical blind spots
Integrated oil majors Upstream supply, global refining, downstream markets Supply security, technology portfolio, market access Agility; energy transition speed
National oil companies Domestic resources, strategic assets, market control Resource access, government support, cost position Technology gaps; international competitiveness
Independent refiners Processing flexibility, market responsiveness, niche focus Operational excellence, optimization focus, adaptability Supply security; capital constraints
Petrochemical integrators Refinery-chemical linkage, value optimization, product diversity Margin capture, feedstock flexibility, market resilience Complexity management; capital intensity
Technology licensors Process IP, catalyst systems, engineering expertise Innovation leadership, licensing revenue, global reach Market cyclicality; technology commoditization

Key Players in Petroleum Liquid Feedstock Market

  • ExxonMobil Corporation
  • Saudi Aramco
  • Royal Dutch Shell plc
  • TotalEnergies SE
  • Reliance Industries Limited
  • China Petroleum & Chemical Corporation (Sinopec)
  • PetroChina Company Limited
  • BP plc
  • Chevron Corporation
  • Equinor ASA
  • Indian Oil Corporation Limited
  • S-Oil Corporation
  • Formosa Petrochemical Corporation
  • JXTG Nippon Oil & Energy Corporation
  • Repsol S.A.

Scope of the Report

Item Value
Quantitative Units USD 345.1 billion
Product Type Heavy Naphtha, Light Naphtha, Gas Oil, Natural Gas Liquids, Other Petroleum Fractions
Application Petroleum Refining, Fuel Blending, Hydrocracking, Aromatics Production, Lubricant Production
Regions Covered Asia Pacific, North America, Europe, Middle East, Latin America, Africa
Countries Covered China, India, United States, Germany, United Kingdom, Japan, South Korea, France, Canada, Australia, Saudi Arabia, UAE, Kuwait, Brazil, Mexico, and 25+ additional countries
Key Companies Profiled ExxonMobil Corporation, Saudi Aramco, Royal Dutch Shell plc, TotalEnergies SE, Reliance Industries Limited, Sinopec, PetroChina, BP plc, Chevron Corporation, Equinor ASA
Additional Attributes Revenue analysis by product type and application categories, regional consumption patterns across Asia Pacific, Middle East, and North America, competitive landscape with integrated oil majors and independent refiners, refinery operator preferences for feedstock flexibility and conversion efficiency, integration with petrochemical production and value chain optimization, innovations in processing technology and circular feedstock utilization, development of sustainable refining practices with carbon intensity reduction and renewable integration capabilities

Market Segmentation

Product Type

  • Heavy Naphtha

    • Full-Range Naphtha
    • Heavy Reformer Feedstock
    • Cracker Feedstock Quality
  • Light Naphtha
    • Light Straight-Run Naphtha
    • Isomerate
    • Pentane-Hexane Fraction
  • Gas Oil
    • Vacuum Gas Oil
    • Atmospheric Gas Oil
    • Light Cycle Oil
    • Coker Gas Oil
  • Natural Gas Liquids
    • Ethane
    • Propane
    • Butane
    • Natural Gasoline (Pentanes Plus)
  • Other Petroleum Fractions
    • Condensates
    • Raffinate Streams
    • Pyrolysis Gasoline
    • Specialty Cuts

Application

  • Petroleum Refining
    • Catalytic Reforming
    • Isomerization
    • Alkylation
    • Hydrotreating
    • Visbreaking
  • Fuel Blending
    • Gasoline Blending
    • Diesel Blending
    • Jet Fuel Production
    • Marine Fuel Formulation
  • Hydrocracking
    • Middle Distillate Production
    • Lubricant Base Stock
    • Specialty Product Manufacturing
  • Aromatics Production
    • Benzene Extraction
    • Toluene Recovery
    • Xylene Production
    • BTX Complex Operations
  • Lubricant Production
    • Base Stock Manufacturing
    • Specialty Lubricants
    • Industrial Oils
  • Petrochemical Feedstock
    • Steam Cracking
    • Olefin Production
    • Polymer Manufacturing

Region

  • Asia Pacific
    • China
    • India
    • Japan
    • South Korea
    • Singapore
    • Thailand
    • Vietnam
    • Indonesia
    • Australia
  • North America
    • United States
    • Canada
    • Mexico
  • Europe
    • Germany
    • United Kingdom
    • France
    • Italy
    • Spain
    • Netherlands
    • Belgium
    • Poland
    • Russia
  • Middle East
    • Saudi Arabia
    • United Arab Emirates
    • Kuwait
    • Qatar
    • Oman
    • Iraq
    • Iran
  • Latin America
    • Brazil
    • Argentina
    • Venezuela
    • Colombia
    • Chile
  • Africa
    • Nigeria
    • Egypt
    • South Africa
    • Algeria
    • Angola

Frequently Asked Questions

How big is the petroleum liquid feedstock market in 2025?

The global petroleum liquid feedstock market is estimated to be valued at USD 345.1 billion in 2025.

What will be the size of petroleum liquid feedstock market in 2035?

The market size for the petroleum liquid feedstock market is projected to reach USD 525.8 billion by 2035.

How much will be the petroleum liquid feedstock market growth between 2025 and 2035?

The petroleum liquid feedstock market is expected to grow at a 4.3% CAGR between 2025 and 2035.

What are the key product types in the petroleum liquid feedstock market?

The key product types in petroleum liquid feedstock market are heavy naphtha, light naphtha, gas oil, natural gas liquids and other petroleum fractions.

Which application segment to contribute significant share in the petroleum liquid feedstock market in 2025?

In terms of application, petroleum refining segment to command 30.0% share in the petroleum liquid feedstock market in 2025.

Table of Content

  1. Executive Summary
    • Global Market Outlook
    • Demand to side Trends
    • Supply to side Trends
    • Technology Roadmap Analysis
    • Analysis and Recommendations
  2. Market Overview
    • Market Coverage / Taxonomy
    • Market Definition / Scope / Limitations
  3. Market Background
    • Market Dynamics
      • Drivers
      • Restraints
      • Opportunity
      • Trends
    • Scenario Forecast
      • Demand in Optimistic Scenario
      • Demand in Likely Scenario
      • Demand in Conservative Scenario
    • Opportunity Map Analysis
    • Product Life Cycle Analysis
    • Supply Chain Analysis
    • Investment Feasibility Matrix
    • Value Chain Analysis
    • PESTLE and Porter’s Analysis
    • Regulatory Landscape
    • Regional Parent Market Outlook
    • Production and Consumption Statistics
    • Import and Export Statistics
  4. Global Market Analysis 2020 to 2024 and Forecast, 2025 to 2035
    • Historical Market Size Value (USD Million) Analysis, 2020 to 2024
    • Current and Future Market Size Value (USD Million) Projections, 2025 to 2035
      • Y to o to Y Growth Trend Analysis
      • Absolute $ Opportunity Analysis
  5. Global Market Pricing Analysis 2020 to 2024 and Forecast 2025 to 2035
  6. Global Market Analysis 2020 to 2024 and Forecast 2025 to 2035, By Product Type
    • Introduction / Key Findings
    • Historical Market Size Value (USD Million) Analysis By Product Type , 2020 to 2024
    • Current and Future Market Size Value (USD Million) Analysis and Forecast By Product Type , 2025 to 2035
      • Heavy Naphtha
      • Light Naphtha
      • Gas Oil
      • Natural Gas Liquids
      • Other Petroleum Fractions
    • Y to o to Y Growth Trend Analysis By Product Type , 2020 to 2024
    • Absolute $ Opportunity Analysis By Product Type , 2025 to 2035
  7. Global Market Analysis 2020 to 2024 and Forecast 2025 to 2035, By Application
    • Introduction / Key Findings
    • Historical Market Size Value (USD Million) Analysis By Application, 2020 to 2024
    • Current and Future Market Size Value (USD Million) Analysis and Forecast By Application, 2025 to 2035
      • Petroleum Refining
      • Fuel Blending
      • Hydrocracking
      • Aromatics Production
      • Lubricant Production
      • Petrochemical Feedstock
    • Y to o to Y Growth Trend Analysis By Application, 2020 to 2024
    • Absolute $ Opportunity Analysis By Application, 2025 to 2035
  8. Global Market Analysis 2020 to 2024 and Forecast 2025 to 2035, By Region
    • Introduction
    • Historical Market Size Value (USD Million) Analysis By Region, 2020 to 2024
    • Current Market Size Value (USD Million) Analysis and Forecast By Region, 2025 to 2035
      • North America
      • Latin America
      • Western Europe
      • Eastern Europe
      • East Asia
      • South Asia and Pacific
      • Middle East & Africa
    • Market Attractiveness Analysis By Region
  9. North America Market Analysis 2020 to 2024 and Forecast 2025 to 2035, By Country
    • Historical Market Size Value (USD Million) Trend Analysis By Market Taxonomy, 2020 to 2024
    • Market Size Value (USD Million) Forecast By Market Taxonomy, 2025 to 2035
      • By Country
        • USA
        • Canada
        • Mexico
      • By Product Type
      • By Application
    • Market Attractiveness Analysis
      • By Country
      • By Product Type
      • By Application
    • Key Takeaways
  10. Latin America Market Analysis 2020 to 2024 and Forecast 2025 to 2035, By Country
    • Historical Market Size Value (USD Million) Trend Analysis By Market Taxonomy, 2020 to 2024
    • Market Size Value (USD Million) Forecast By Market Taxonomy, 2025 to 2035
      • By Country
        • Brazil
        • Chile
        • Rest of Latin America
      • By Product Type
      • By Application
    • Market Attractiveness Analysis
      • By Country
      • By Product Type
      • By Application
    • Key Takeaways
  11. Western Europe Market Analysis 2020 to 2024 and Forecast 2025 to 2035, By Country
    • Historical Market Size Value (USD Million) Trend Analysis By Market Taxonomy, 2020 to 2024
    • Market Size Value (USD Million) Forecast By Market Taxonomy, 2025 to 2035
      • By Country
        • Germany
        • UK
        • Italy
        • Spain
        • France
        • Nordic
        • BENELUX
        • Rest of Western Europe
      • By Product Type
      • By Application
    • Market Attractiveness Analysis
      • By Country
      • By Product Type
      • By Application
    • Key Takeaways
  12. Eastern Europe Market Analysis 2020 to 2024 and Forecast 2025 to 2035, By Country
    • Historical Market Size Value (USD Million) Trend Analysis By Market Taxonomy, 2020 to 2024
    • Market Size Value (USD Million) Forecast By Market Taxonomy, 2025 to 2035
      • By Country
        • Russia
        • Poland
        • Hungary
        • Balkan & Baltic
        • Rest of Eastern Europe
      • By Product Type
      • By Application
    • Market Attractiveness Analysis
      • By Country
      • By Product Type
      • By Application
    • Key Takeaways
  13. East Asia Market Analysis 2020 to 2024 and Forecast 2025 to 2035, By Country
    • Historical Market Size Value (USD Million) Trend Analysis By Market Taxonomy, 2020 to 2024
    • Market Size Value (USD Million) Forecast By Market Taxonomy, 2025 to 2035
      • By Country
        • China
        • Japan
        • South Korea
      • By Product Type
      • By Application
    • Market Attractiveness Analysis
      • By Country
      • By Product Type
      • By Application
    • Key Takeaways
  14. South Asia and Pacific Market Analysis 2020 to 2024 and Forecast 2025 to 2035, By Country
    • Historical Market Size Value (USD Million) Trend Analysis By Market Taxonomy, 2020 to 2024
    • Market Size Value (USD Million) Forecast By Market Taxonomy, 2025 to 2035
      • By Country
        • India
        • ASEAN
        • Australia & New Zealand
        • Rest of South Asia and Pacific
      • By Product Type
      • By Application
    • Market Attractiveness Analysis
      • By Country
      • By Product Type
      • By Application
    • Key Takeaways
  15. Middle East & Africa Market Analysis 2020 to 2024 and Forecast 2025 to 2035, By Country
    • Historical Market Size Value (USD Million) Trend Analysis By Market Taxonomy, 2020 to 2024
    • Market Size Value (USD Million) Forecast By Market Taxonomy, 2025 to 2035
      • By Country
        • Kingdom of Saudi Arabia
        • Other GCC Countries
        • Turkiye
        • South Africa
        • Other African Union
        • Rest of Middle East & Africa
      • By Product Type
      • By Application
    • Market Attractiveness Analysis
      • By Country
      • By Product Type
      • By Application
    • Key Takeaways
  16. Key Countries Market Analysis
    • USA
      • Pricing Analysis
      • Market Share Analysis, 2024
        • By Product Type
        • By Application
    • Canada
      • Pricing Analysis
      • Market Share Analysis, 2024
        • By Product Type
        • By Application
    • Mexico
      • Pricing Analysis
      • Market Share Analysis, 2024
        • By Product Type
        • By Application
    • Brazil
      • Pricing Analysis
      • Market Share Analysis, 2024
        • By Product Type
        • By Application
    • Chile
      • Pricing Analysis
      • Market Share Analysis, 2024
        • By Product Type
        • By Application
    • Germany
      • Pricing Analysis
      • Market Share Analysis, 2024
        • By Product Type
        • By Application
    • UK
      • Pricing Analysis
      • Market Share Analysis, 2024
        • By Product Type
        • By Application
    • Italy
      • Pricing Analysis
      • Market Share Analysis, 2024
        • By Product Type
        • By Application
    • Spain
      • Pricing Analysis
      • Market Share Analysis, 2024
        • By Product Type
        • By Application
    • France
      • Pricing Analysis
      • Market Share Analysis, 2024
        • By Product Type
        • By Application
    • India
      • Pricing Analysis
      • Market Share Analysis, 2024
        • By Product Type
        • By Application
    • ASEAN
      • Pricing Analysis
      • Market Share Analysis, 2024
        • By Product Type
        • By Application
    • Australia & New Zealand
      • Pricing Analysis
      • Market Share Analysis, 2024
        • By Product Type
        • By Application
    • China
      • Pricing Analysis
      • Market Share Analysis, 2024
        • By Product Type
        • By Application
    • Japan
      • Pricing Analysis
      • Market Share Analysis, 2024
        • By Product Type
        • By Application
    • South Korea
      • Pricing Analysis
      • Market Share Analysis, 2024
        • By Product Type
        • By Application
    • Russia
      • Pricing Analysis
      • Market Share Analysis, 2024
        • By Product Type
        • By Application
    • Poland
      • Pricing Analysis
      • Market Share Analysis, 2024
        • By Product Type
        • By Application
    • Hungary
      • Pricing Analysis
      • Market Share Analysis, 2024
        • By Product Type
        • By Application
    • Kingdom of Saudi Arabia
      • Pricing Analysis
      • Market Share Analysis, 2024
        • By Product Type
        • By Application
    • Turkiye
      • Pricing Analysis
      • Market Share Analysis, 2024
        • By Product Type
        • By Application
    • South Africa
      • Pricing Analysis
      • Market Share Analysis, 2024
        • By Product Type
        • By Application
  17. Market Structure Analysis
    • Competition Dashboard
    • Competition Benchmarking
    • Market Share Analysis of Top Players
      • By Regional
      • By Product Type
      • By Application
  18. Competition Analysis
    • Competition Deep Dive
      • Saudi Aramco
        • Overview
        • Product Portfolio
        • Profitability by Market Segments (Product/Age /Sales Channel/Region)
        • Sales Footprint
        • Strategy Overview
          • Marketing Strategy
          • Product Strategy
          • Channel Strategy
      • ExxonMobil Corporation
      • Royal Dutch Shell plc
      • TotalEnergies SE
      • Reliance Industries Limited
      • China Petroleum & Chemical Corporation (Sinopec)
      • PetroChina Company Limited
      • BP plc
      • Chevron Corporation
      • Equinor ASA
      • Indian Oil Corporation Limited
      • S-Oil Corporation
      • Formosa Petrochemical Corporation
      • JXTG Nippon Oil & Energy Corporation
      • Repsol S.A.
  19. Assumptions & Acronyms Used
  20. Research Methodology

List of Tables

  • Table 1: Global Market Value (USD Million) Forecast by Region, 2020 to 2035
  • Table 2: Global Market Value (USD Million) Forecast by Product Type , 2020 to 2035
  • Table 3: Global Market Value (USD Million) Forecast by Application, 2020 to 2035
  • Table 4: North America Market Value (USD Million) Forecast by Country, 2020 to 2035
  • Table 5: North America Market Value (USD Million) Forecast by Product Type , 2020 to 2035
  • Table 6: North America Market Value (USD Million) Forecast by Application, 2020 to 2035
  • Table 7: Latin America Market Value (USD Million) Forecast by Country, 2020 to 2035
  • Table 8: Latin America Market Value (USD Million) Forecast by Product Type , 2020 to 2035
  • Table 9: Latin America Market Value (USD Million) Forecast by Application, 2020 to 2035
  • Table 10: Western Europe Market Value (USD Million) Forecast by Country, 2020 to 2035
  • Table 11: Western Europe Market Value (USD Million) Forecast by Product Type , 2020 to 2035
  • Table 12: Western Europe Market Value (USD Million) Forecast by Application, 2020 to 2035
  • Table 13: Eastern Europe Market Value (USD Million) Forecast by Country, 2020 to 2035
  • Table 14: Eastern Europe Market Value (USD Million) Forecast by Product Type , 2020 to 2035
  • Table 15: Eastern Europe Market Value (USD Million) Forecast by Application, 2020 to 2035
  • Table 16: East Asia Market Value (USD Million) Forecast by Country, 2020 to 2035
  • Table 17: East Asia Market Value (USD Million) Forecast by Product Type , 2020 to 2035
  • Table 18: East Asia Market Value (USD Million) Forecast by Application, 2020 to 2035
  • Table 19: South Asia and Pacific Market Value (USD Million) Forecast by Country, 2020 to 2035
  • Table 20: South Asia and Pacific Market Value (USD Million) Forecast by Product Type , 2020 to 2035
  • Table 21: South Asia and Pacific Market Value (USD Million) Forecast by Application, 2020 to 2035
  • Table 22: Middle East & Africa Market Value (USD Million) Forecast by Country, 2020 to 2035
  • Table 23: Middle East & Africa Market Value (USD Million) Forecast by Product Type , 2020 to 2035
  • Table 24: Middle East & Africa Market Value (USD Million) Forecast by Application, 2020 to 2035

List of Figures

  • Figure 1: Global Market Pricing Analysis
  • Figure 2: Global Market Value (USD Million) Forecast 2020-2035
  • Figure 3: Global Market Value Share and BPS Analysis by Product Type , 2025 and 2035
  • Figure 4: Global Market Y to o to Y Growth Comparison by Product Type , 2025-2035
  • Figure 5: Global Market Attractiveness Analysis by Product Type
  • Figure 6: Global Market Value Share and BPS Analysis by Application, 2025 and 2035
  • Figure 7: Global Market Y to o to Y Growth Comparison by Application, 2025-2035
  • Figure 8: Global Market Attractiveness Analysis by Application
  • Figure 9: Global Market Value (USD Million) Share and BPS Analysis by Region, 2025 and 2035
  • Figure 10: Global Market Y to o to Y Growth Comparison by Region, 2025-2035
  • Figure 11: Global Market Attractiveness Analysis by Region
  • Figure 12: North America Market Incremental Dollar Opportunity, 2025-2035
  • Figure 13: Latin America Market Incremental Dollar Opportunity, 2025-2035
  • Figure 14: Western Europe Market Incremental Dollar Opportunity, 2025-2035
  • Figure 15: Eastern Europe Market Incremental Dollar Opportunity, 2025-2035
  • Figure 16: East Asia Market Incremental Dollar Opportunity, 2025-2035
  • Figure 17: South Asia and Pacific Market Incremental Dollar Opportunity, 2025-2035
  • Figure 18: Middle East & Africa Market Incremental Dollar Opportunity, 2025-2035
  • Figure 19: North America Market Value Share and BPS Analysis by Country, 2025 and 2035
  • Figure 20: North America Market Value Share and BPS Analysis by Product Type , 2025 and 2035
  • Figure 21: North America Market Y to o to Y Growth Comparison by Product Type , 2025-2035
  • Figure 22: North America Market Attractiveness Analysis by Product Type
  • Figure 23: North America Market Value Share and BPS Analysis by Application, 2025 and 2035
  • Figure 24: North America Market Y to o to Y Growth Comparison by Application, 2025-2035
  • Figure 25: North America Market Attractiveness Analysis by Application
  • Figure 26: Latin America Market Value Share and BPS Analysis by Country, 2025 and 2035
  • Figure 27: Latin America Market Value Share and BPS Analysis by Product Type , 2025 and 2035
  • Figure 28: Latin America Market Y to o to Y Growth Comparison by Product Type , 2025-2035
  • Figure 29: Latin America Market Attractiveness Analysis by Product Type
  • Figure 30: Latin America Market Value Share and BPS Analysis by Application, 2025 and 2035
  • Figure 31: Latin America Market Y to o to Y Growth Comparison by Application, 2025-2035
  • Figure 32: Latin America Market Attractiveness Analysis by Application
  • Figure 33: Western Europe Market Value Share and BPS Analysis by Country, 2025 and 2035
  • Figure 34: Western Europe Market Value Share and BPS Analysis by Product Type , 2025 and 2035
  • Figure 35: Western Europe Market Y to o to Y Growth Comparison by Product Type , 2025-2035
  • Figure 36: Western Europe Market Attractiveness Analysis by Product Type
  • Figure 37: Western Europe Market Value Share and BPS Analysis by Application, 2025 and 2035
  • Figure 38: Western Europe Market Y to o to Y Growth Comparison by Application, 2025-2035
  • Figure 39: Western Europe Market Attractiveness Analysis by Application
  • Figure 40: Eastern Europe Market Value Share and BPS Analysis by Country, 2025 and 2035
  • Figure 41: Eastern Europe Market Value Share and BPS Analysis by Product Type , 2025 and 2035
  • Figure 42: Eastern Europe Market Y to o to Y Growth Comparison by Product Type , 2025-2035
  • Figure 43: Eastern Europe Market Attractiveness Analysis by Product Type
  • Figure 44: Eastern Europe Market Value Share and BPS Analysis by Application, 2025 and 2035
  • Figure 45: Eastern Europe Market Y to o to Y Growth Comparison by Application, 2025-2035
  • Figure 46: Eastern Europe Market Attractiveness Analysis by Application
  • Figure 47: East Asia Market Value Share and BPS Analysis by Country, 2025 and 2035
  • Figure 48: East Asia Market Value Share and BPS Analysis by Product Type , 2025 and 2035
  • Figure 49: East Asia Market Y to o to Y Growth Comparison by Product Type , 2025-2035
  • Figure 50: East Asia Market Attractiveness Analysis by Product Type
  • Figure 51: East Asia Market Value Share and BPS Analysis by Application, 2025 and 2035
  • Figure 52: East Asia Market Y to o to Y Growth Comparison by Application, 2025-2035
  • Figure 53: East Asia Market Attractiveness Analysis by Application
  • Figure 54: South Asia and Pacific Market Value Share and BPS Analysis by Country, 2025 and 2035
  • Figure 55: South Asia and Pacific Market Value Share and BPS Analysis by Product Type , 2025 and 2035
  • Figure 56: South Asia and Pacific Market Y to o to Y Growth Comparison by Product Type , 2025-2035
  • Figure 57: South Asia and Pacific Market Attractiveness Analysis by Product Type
  • Figure 58: South Asia and Pacific Market Value Share and BPS Analysis by Application, 2025 and 2035
  • Figure 59: South Asia and Pacific Market Y to o to Y Growth Comparison by Application, 2025-2035
  • Figure 60: South Asia and Pacific Market Attractiveness Analysis by Application
  • Figure 61: Middle East & Africa Market Value Share and BPS Analysis by Country, 2025 and 2035
  • Figure 62: Middle East & Africa Market Value Share and BPS Analysis by Product Type , 2025 and 2035
  • Figure 63: Middle East & Africa Market Y to o to Y Growth Comparison by Product Type , 2025-2035
  • Figure 64: Middle East & Africa Market Attractiveness Analysis by Product Type
  • Figure 65: Middle East & Africa Market Value Share and BPS Analysis by Application, 2025 and 2035
  • Figure 66: Middle East & Africa Market Y to o to Y Growth Comparison by Application, 2025-2035
  • Figure 67: Middle East & Africa Market Attractiveness Analysis by Application
  • Figure 68: Global Market - Tier Structure Analysis
  • Figure 69: Global Market - Company Share Analysis
Dashboard
Dashboard
Dashboard
Dashboard
Dashboard
Dashboard

Full Research Suite comprises of:

Market outlook & trends analysis

Market outlook & trends analysis

Interviews & case studies

Interviews & case studies

Strategic recommendations

Strategic recommendations

Vendor profiles & capabilities analysis

Vendor profiles & capabilities analysis

5-year forecasts

5-year forecasts

8 regions and 60+ country-level data splits

8 regions and 60+ country-level data splits

Market segment data splits

Market segment data splits

12 months of continuous data updates

12 months of continuous data updates

DELIVERED AS:

PDF EXCEL ONLINE

Full Research Suite


$5000

$7500

$10000

Buy Report Now
Similar Industry Reports

Similar Industry Reports

Petroleum And Fuel Dyes and Markers Market

Petroleum And Fuel Dyes and Markers Market Size and Share Forecast Outlook 2025 to 2035

Petroleum Refinery Merchant Hydrogen Generation Market

Petroleum Refinery Merchant Hydrogen Generation Market Size and Share Forecast Outlook 2025 to 2035

Petroleum Refinery Hydrogen Market

Petroleum Refinery Hydrogen Market Size and Share Forecast Outlook 2025 to 2035

Petroleum Refining Hydrogen Generation Market

Petroleum Refining Hydrogen Generation Market Size and Share Forecast Outlook 2025 to 2035

Petroleum Jelly Market

Petroleum Jelly Market Growth - Trends & Forecast 2025 to 2035

Petroleum Fuel Dyes and Markers Market

Petroleum Fuel Dyes and Markers Market 2025 to 2035

Yellow Petroleum Jelly Market

Yellow Petroleum Jelly Market Size and Share Forecast Outlook 2025 to 2035

Captive Petroleum Refinery Hydrogen Generation Market

Captive Petroleum Refinery Hydrogen Generation Market Size and Share Forecast Outlook 2025 to 2035

Liquefied Petroleum Gas Storage Market

Liquefied Petroleum Gas Storage Market Size and Share Forecast Outlook 2025 to 2035

Liquid Filtration Market

Liquid Filtration Market Size and Share Forecast Outlook 2025 to 2035

Liquid Packaging Board Market

Liquid Packaging Board Market Size and Share Forecast Outlook 2025 to 2035

Liquid Filled Capsule Market

Liquid Filled Capsule Market Size and Share Forecast Outlook 2025 to 2035

Liquid Density Meters Market

Liquid Density Meters Market Size and Share Forecast Outlook 2025 to 2035

Liquid Cold Plates Market

Liquid Cold Plates Market Size and Share Forecast Outlook 2025 to 2035

Liquid Crystal Polymers Market

Liquid Crystal Polymers Market Size and Share Forecast Outlook 2025 to 2035

Liquid Embolic Agent Market

Liquid Embolic Agent Market Size and Share Forecast Outlook 2025 to 2035

Liquid Hydrogen Market

Liquid Hydrogen Market Size and Share Forecast Outlook 2025 to 2035

Liquid Cooled Home Standby Gensets Market

Liquid Cooled Home Standby Gensets Market Size and Share Forecast Outlook 2025 to 2035

Liquid Nitrogen Purge Systems Market

Liquid Nitrogen Purge Systems Market Size and Share Forecast Outlook 2025 to 2035

Liquid Chromatography Systems Market

Liquid Chromatography Systems Market Size and Share Forecast Outlook 2025 to 2035

Future Market Insights

Petroleum Liquid Feedstock Market

Chat With MaRIA

Chat With

MaRIA

Hi There, I am MaRIA, Your Market Research Intelligence Assistant. How may I help you?