
- Market Size (2026)
- USD 261.7 Mn
- Forecast (2036)
- USD 510.0 Mn
- CAGR (2026 to 2036)
- 6.9%
How big is the Pet Postbiotics Supplement Market in 2026?
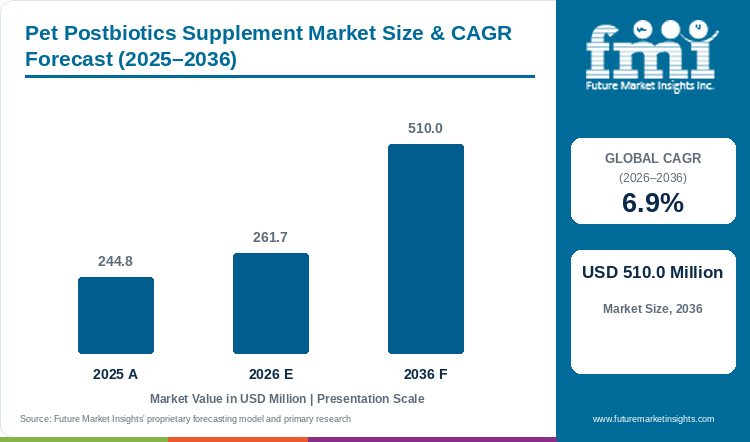
The Pet Postbiotics Supplement Market is projected to reach USD 510.0 million by 2036, growing at a 6.9% CAGR from 2026 to 2036. FMI estimates the market at USD 261.7 million in 2026. The market was valued at USD 244.8 million in 2025. Pet ownership is stable or rising in the main economies, and owners spend more per animal on health products. Germany had 33.4 million dogs, cats, small mammals and ornamental birds in homes in 2025. Chinese urban dog and cat spending rose 7.5% in 2024. Postbiotics are a young category inside the wider pet biotics group. Trade press describes their use spreading beyond digestive health. Growth therefore depends on clinical proof and on how well brands explain the benefit to owners and vets.
Supplement adoption sets the ceiling for postbiotics more than pet numbers do. APPA reports that 53% of US dog owners and 34% of US cat owners give vitamins or supplements. Gut health is a stated concern for 17% of dog owners and 16% of cat owners. That Innova survey covered five countries, including the UK, Germany and the United States. Probiotics already serve this need, since 40% of owners who give supplements choose them. Postbiotics featured in fewer than 5% of 2025 pet food launches with digestive claims. Volume therefore depends on converting probiotic buyers more than on recruiting new users.
Key Market Trends & Insights
- Postbiotic claims are moving beyond gut health into oral care. Dinovite launched dental chews built on a postbiotic in January 2026. Other Half Pet launched a dental powder with a fermentation-derived postbiotic in 2025. Gut remains the core use, but these claims widen the buyer base.
- Veterinary brands are building gut programmes around the microbiome. Virbac introduced Floragest soft chews to French veterinarians on 2 September 2026. Each chew pairs two prebiotics with two postbiotics, yeast cell-wall extracts and an inactivated Lactobacillus helveticus strain. The product is positioned as an alternative to live probiotics, which the maker calls fragile.
- Evidence is still thin and mostly supplier-reported. The 28-day study behind the Floragest launch covered 57 dogs and 57 cats without a control group. The supplier funded the study. The dental chew claims rest on ingredient-level and laboratory studies. Brands that publish controlled trials in dogs and cats will separate from those relying on general gut claims.
Regional Highlights
- In Europe, pet populations are large but retail spending on accessories is soft. FEDIAF counted about 139 million European households with a pet, or 49% of all households. German accessory sales declined in 2025, so suppliers there compete for a fixed wallet.
- In Asia Pacific, markets diverge. Japan's cat count fell in the 2025 survey. China's urban dog and cat spending rose 7.5% in 2024. India's pet population grew from 28.4 million in 2020 to 39.2 million in 2025.
Pet Postbiotics Supplement Market Size and Forecast
Table 1: Pet Postbiotics Supplement Market Size and Forecast
| Market size and forecast | Value |
|---|---|
| Market size in 2025 | USD 244.8 million |
| Estimated market size in 2026 | USD 261.7 million |
| Projected market size by 2036 | USD 510.0 million |
| CAGR from 2026 to 2036 | 6.9% |
Source: Future Market Insights analysis of the pet postbiotics supplement market, 2026.
Analyst Perspective
“Pet postbiotic supplements sell on gut comfort, and owners buy them after a vet or a retailer explains the benefit. Suppliers with published trial results and veterinary channel access can hold prices, while generic gut products compete with cheaper probiotics. The main risk is proof: claims that are not backed by trials in dogs and cats limit repeat purchase.”
- Nandini Roy Choudhury, Principal Analyst at Future Market Insights
How is the Pet Postbiotics Supplement Market segmented?
- By pet type: Dogs, Cats, Horses and Other Pets.
- By form: Powder, Chews and Tablets, Capsules, Liquid and Paste.
- By application: Digestive Health, Immunity and Skin, Oral Health, Other Applications.
- By sales channel: Store-based Retail, Online Retail.
- By region: North America, Latin America, Europe, East Asia, South Asia, Oceania, Middle East and Africa.
Why do Dogs lead by Pet Type in the Pet Postbiotics Supplement Market in 2026?
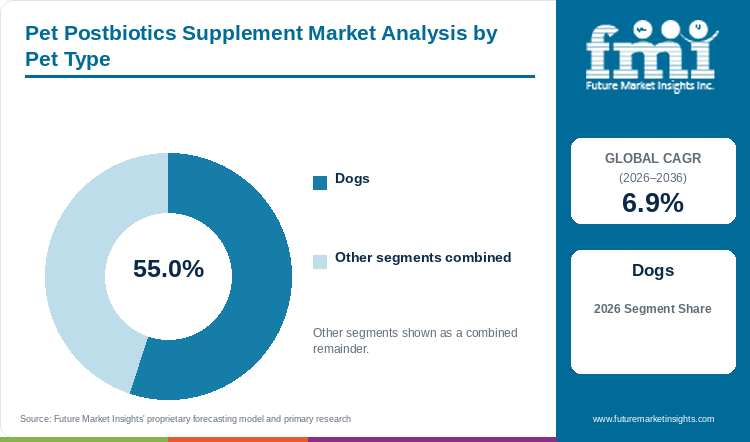
Dogs hold 55.0% of the Pet Postbiotics Supplement Market by pet type in 2026.
Dog owners spend more per animal than cat owners in Japan. Both dental launches target dogs only. Cats and other pets hold the remaining 45.0%. Cat spending in China rose 10.7% in 2024 against 4.6% for dogs. Germany has 15.7 million cats against 10.0 million dogs. Japan has 8.85 million cats against 6.82 million dogs. Cat demand therefore supports a second segment. Of the postbiotic products profiled here, only Floragest has a cat version.
Table 2: Pet Type, 2026 Share
| Leading Share | 2026 market share |
|---|---|
| Dogs | 55.0% |
| All Other Segments Combined Share | 45.0% |
Source: Future Market Insights analysis of the pet postbiotics supplement market, 2026.
Why does Powder lead by Form in the Pet Postbiotics Supplement Market in 2026?
Powder holds 48.0% of the Pet Postbiotics Supplement Market by form in 2026.
Powder goes on food, so one daily scoop can be matched to dog weight. Dinovite sells its dental powder in three sizes by dog weight. Other Half Pet also chose a bacon-flavored powder for its postbiotic dental product. Chews, tablets, capsules and liquids hold the remaining 52.0%. Chews gain where a postbiotic is paired with another claim, as in the dental chews. Floragest is a soft chew given once a day for 30 days. The supplier reports that 94% of dogs and 91% of cats accepted it.
Table 3: Form, 2026 Share
| Leading Share | 2026 market share |
|---|---|
| Powder | 48.0% |
| All Other Segments Combined Share | 52.0% |
Source: Future Market Insights analysis of the pet postbiotics supplement market, 2026.
Why does Digestive Health lead by Application in the Pet Postbiotics Supplement Market in 2026?
Digestive health holds 46.0% of the Pet Postbiotics Supplement Market by application in 2026.
Floragest launch material cites UK primary-care studies. It ranks digestive disorders third among consultation reasons in dogs and fourth in cats. That gives gut products a clear clinical use. Immunity, skin, oral health and other uses hold the remaining 54.0% combined. Oral care is a recent addition, with postbiotic dental products already on sale. Each of these claims is smaller than gut care today and no single one matches its share.
Table 4: Application, 2026 Share
| Leading Share | 2026 market share |
|---|---|
| Digestive Health | 46.0% |
| All Other Segments Combined Share | 54.0% |
Source: Future Market Insights analysis of the pet postbiotics supplement market, 2026.
Why does Store-based Retail lead by Sales Channel in the Pet Postbiotics Supplement Market in 2026?
Store-based retail, including veterinary clinics, pet specialty stores and supermarkets, holds 52.0% of the Pet Postbiotics Supplement Market by sales channel in 2026.
Postbiotics need explanation, so the veterinary channel matters. Virbac promotes Floragest to veterinarians through its sales representatives. Online retail holds the remaining 48.0%. One dental powder offers subscription ordering every 30, 60, 90 or 120 days. Trade coverage of the German 2025 market points to weakness in physical retail.
Table 5: Sales Channel, 2026 Share
| Leading Share | 2026 market share |
|---|---|
| Store-based Retail | 52.0% |
| All Other Segments Combined Share | 48.0% |
Source: Future Market Insights analysis of the pet postbiotics supplement market, 2026.
What are the key drivers, restraints and opportunities?
Driver
Pet owners spend more per animal on health. Spending per pet is high and rising in large markets. Chinese urban dog and cat owners spent 300.2 billion yuan in 2024, up 7.5%. Japanese dog owners also spend heavily each year, so health and wellness products capture part of this extra spend.
Gut health programmes in the veterinary channel. Floragest launch material reports that 90% of veterinarians use biotics as a routine therapy. Postbiotic supplements can sit alongside existing gut programmes.
Restraint
Limited clinical evidence for postbiotics. Most evidence for postbiotic supplements in pets is supplier-reported. Probiotics have a longer record. Purina calls FortiFlora the number one veterinarian-recommended probiotic brand, so owners may choose the better-known option.
Weak spending on accessories and physical retail. German pet accessory sales fell 4.6% in 2025 and physical retail is under pressure. Japan's shrinking cat population also limits unit growth there. Suppliers cannot count on volume growth in mature markets.
Opportunity
New claims beyond the gut. Oral care claims widen the use of postbiotics. A dental product reaches owners whose dogs have no gut problem.
Growing owner bases in China and India. China's urban dog and cat spending rose 7.5% in 2024. India's pet population is forecast to reach 51.8 million in 2030, up from 39.2 million in 2025. Early supplement categories in both markets reward brands that build veterinary relationships first.
Pet Postbiotics Supplement Market by Country (2026 to 2036)
Table 6: Pet Postbiotics Supplement Market Country Growth Forecast
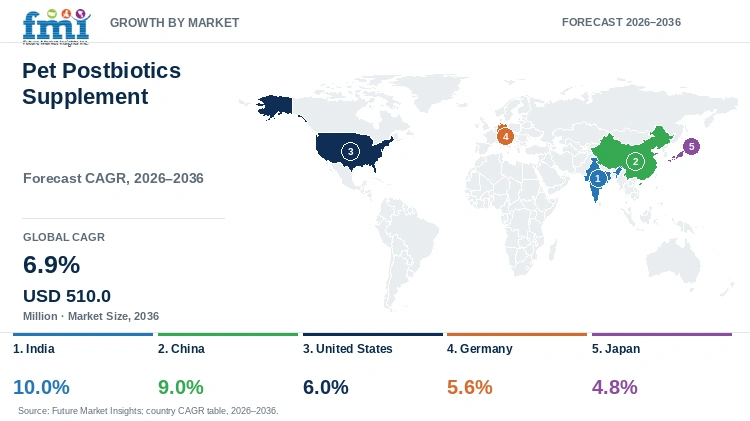
| Country | CAGR, 2026 to 2036 |
|---|---|
| India | 10.0% |
| China | 9.0% |
| United States | 6.0% |
| Germany | 5.6% |
| Japan | 4.8% |
Source: Future Market Insights analysis of the pet postbiotics supplement market, 2026.
India
India is the fastest-growing profiled market from a small base. Its retail pet food sales reached USD 769.7 million in 2025. That is 0.5% of global sales and the 29th largest market. Postbiotics are a niche inside the wider pet supplement market. A 10.0% CAGR for 2026 to 2036 reflects a low starting point and fast category formation, not broad supplement growth.
Low ownership penetration, not high spending per pet, explains the lead. Only 8.2% of Indian households owned a dog in 2025, and 0.6% owned a cat. The pet population is forecast to rise 5.7% a year to 51.8 million in 2030. China's pet population is forecast to stay near 430 million over the same period. Category growth in India therefore comes from new owners, whereas China and Japan depend more on spending per pet.
Cats and online sales add two further sources of growth. The cat population rose 13.6% a year from 2.4 million in 2020 to 4.5 million in 2025. E-commerce holds 31.6% of pet food sales and has grown 31.7% a year since 2020. Online listings therefore give a new supplement category national reach faster than clinics, which hold 13.5%. Pet shops and superstores still hold 42.6%, so a launch needs shop distribution as well as online listings. India also imports more pet food than it exports, with a 2025 deficit of CAD 82.6 million.
China
China's urban dog and cat market reached 300.2 billion yuan in 2024, with cat spending rising faster than dog spending. Per-pet spending is rising as owners trade into health products. A 9.0% CAGR for 2026 to 2036 allows for price competition in a young supplement category.
Cat growth and digestive demand explain the second place. Urban dogs and cats numbered 126 million in 2025, of which 72.89 million were cats. Cat consumption rose 5.2% to 152.0 billion yuan, against 3.2% for dogs. Owners rank digestive health as the top functional concern, at 68.9% for dogs and 69.2% for cats. Gastroenteritis accounted for 6.9% of dog hospital visits and 7.8% of cat visits.
Spending per pet matters more than pet numbers. Urban pet numbers grew 1.8% in 2025, while consumption grew 4.1% to 312.6 billion yuan. Spending per dog rose 1.5% to 3,006 yuan and per cat 3.2% to 2,085 yuan. Dog households fell from 16.7% to 14.2% between 2021 and 2025, and cat households rose from 14.8% to 15.1%. Retail e-commerce now supplies about two thirds of pet food sales. Postbiotic suppliers must therefore gain share from a wallet that grew only 4.1% in 2025. Cat owners rank digestive health first at 69.2%, and both dental launches target dogs only. Gut products therefore have the clearer path to the faster-growing cat segment.
United States
The United States is a mature market for pet supplements. APPA's 2025 report finds that 53% of US dog owners and 34% of US cat owners give vitamins or supplements. A 6.0% CAGR for 2026 to 2036 reflects that maturity, so postbiotics must win share from established products.
Adoption is already high, so growth depends on new claims, not new users. Joint health, multivitamin and skin and coat products lead among dogs, so gut care sits outside the top three. Among cats, multivitamins lead, followed by pre- and probiotic and digestion products. Pre- and probiotic diets were bought by 13% of dog owners and 12% of cat owners. Those shares are 18% and 9% lower than in 2023.
Industry growth sets the benchmark. Spending reached USD 158 billion in 2025, up 3.7%. APPA projects 4.4% growth for 2026, of which about 2 points is inflation. Owners are shifting budgets from discretionary items toward essential care. A 6.0% postbiotic CAGR therefore requires share gains from established gut products, since real industry growth is near 2.4%. The United States adds owners from a large base, with 71 million dog households and 53 million cat households. With 22% of owners spending less in 2025, a postbiotic needs a stated clinical claim to keep its place.
Germany
Pets live in 43% of German households, and the pet market reached nearly EUR 7 billion in 2025. Cats live in 24% of households and dogs in one in five. A 5.6% CAGR for 2026 to 2036 reflects a large, stable owner base with cautious spending.
Flat spending, not weak ownership, limits growth in Germany. Pet food sales reached EUR 4.3 billion in 2025, up only 0.3%, while stationary retail sales fell 0.7%. Cat food leads the food segments at EUR 2.3 billion, up 1.3%. Dog food overall earned about EUR 1.8 billion, down 0.3%. Staple dog food declined, with wet dog food down 1.9% and dry dog food down 2.7%. Treats grew instead, with dog snacks up 2.1% to EUR 768 million and cat snacks up 3.0%. Chew-based postbiotic claims sit in the treat format, which is the growing part of dog food.
Channel structure separates Germany from the faster markets. Grocery retail, including drugstores and discounters, delivered 66% of pet food sales in 2025. Online sales passed EUR 1.5 billion, up 0.6% on 2024, and 61% of owners spend both in stores and online. A supplement that needs explanation therefore has to reach owners in both channels. Germany ranks first among pet food importers, at CAD 4.5 billion in 2025 and up 14.8% a year since 2020.
Japan
Japan's cat count is falling, from 9.155 million to 8.85 million in the 2025 survey. Owners spent an average of 192,356 yen per dog and 119,972 yen per cat in the 2025 survey. That spending supports value growth. A 4.8% CAGR for 2026 to 2036 is the lowest of the profiled countries and reflects flat pet numbers.
Falling pet numbers cap volume. Japan's pet population fell from 15.951 million in 2024 to 15.667 million in 2025, a decline of 1.8%. Cats fell 3.4% to 8.847 million, while dogs rose to 6.82 million. Ownership is shifting toward singles aged 20 to 39, parents of young children and households earning 9 million yen or more. Retail pet food sales declined 0.5% a year from 2019 to 2023. Japan ranked ninth among global pet food markets, at USD 4.2 billion in 2023.
Value growth has to come from mix. Agriculture and Agri-Food Canada forecasts pet food sales rising 4.6% a year to USD 5.3 billion by 2028. A 4.8% postbiotic CAGR therefore tracks the wider category, so the segment gains little share. Offline retail held 70.9% of Japanese pet food sales in 2023. E-commerce held 23.1% after the fastest growth of any channel. Shelf space and store staff therefore decide most trial purchases, unlike in China, where about two thirds of sales are online.
Who are the notable companies in the Pet Postbiotics Supplement Market?
Notable companies in the Pet Postbiotics Supplement Market include Virbac, Dinovite and Other Half Pet.
Pet postbiotic suppliers differ by their inactivated ingredient, the evidence published for it and the channel to owners. The ISAPP definition requires inanimate microorganisms or their components that confer a health benefit on the host. Live probiotics and purified metabolites alone fall outside it.
Virbac introduced Floragest to French veterinarians on 2 September 2026. The soft chew pairs two prebiotics, baobab pulp and acacia gum, with two postbiotics. The postbiotics are yeast cell-wall extracts and inactivated Lactobacillus helveticus HA-122. The chew is given once daily for 30 days and comes in four sizes, one for cats and three for dogs. The company promotes it through its sales representatives. Its published study ran 28 days in 57 dogs and 57 cats without a control group, and Virbac funded it.
Dinovite launched Triple Action Dental Chews on 7 January 2026, its first entry in dog dental care. The chews contain a postbiotic that the company describes as clinically studied. Its claims rest on ingredient-level and laboratory studies, including an average 85% reduction in odor-causing compounds. The company also sells a scoopable dental powder with a canine oral health postbiotic, in three sizes by dog weight.
Other Half Pet lists Doggie Dental, a bacon-flavored daily powder built on a precision-fermented Canine Oral Health Postbiotic. The listing, dated 9 May 2025, describes it as an alternative to conventional chews and sticks. Retail buyers should ask for the study behind the oral health claim before listing.
Purina Pro Plan Veterinary Supplements launched the FortiFlora Diarrhea Response Kit on 10 August 2026. The kit pairs kaolin and pectin stick packs with FortiFlora sachets that contain live Enterococcus lactis SF68, a probiotic. It is a gut-health comparison for clinics, not a postbiotic product, and falls outside the scope of this report.
Key Developments in the Pet Postbiotics Supplement Market
- On 2 September 2026 Virbac introduced Floragest soft chews, with two prebiotics and two postbiotics, to French veterinarians. The launch places a postbiotic gut supplement in the veterinary channel.
- On 7 January 2026 Dinovite launched Triple Action Dental Chews built on a postbiotic. The launch extends postbiotic claims from gut care to oral care in a chew format.
Key Players in the Pet Postbiotics Supplement Market
- Virbac
- Dinovite
- Other Half Pet
Pet Postbiotics Supplement Market Report Scope
Table 7: Pet Postbiotics Supplement Market Report Scope
| Coverage field | Report scope |
|---|---|
| Market definition | Dietary supplements for dogs, cats and other pets that contain a postbiotic. A postbiotic is a preparation of inanimate microorganisms and/or their components that confers a health benefit on the host. Forms include powders, chews, tablets, capsules and liquids. Complete pet foods and live-probiotic-only products are excluded. |
| Pet Type | Dogs; Cats; Horses and Other Pets |
| Form | Powder; Chews and Tablets; Capsules; Liquid and Paste |
| Application | Digestive Health; Immunity and Skin; Oral Health; Other Applications |
| Sales Channel | Store-based Retail; Online Retail |
| Regions and profiled countries | North America, Latin America, Europe, East Asia, South Asia, Oceania, Middle East and Africa. Profiled countries: United States, Germany, Japan, China, India |
| Companies covered | Virbac SA; Dinovite; Other Half Pet |
| Quantitative Units | USD million |
Pet Postbiotics Supplement Market by Segments
Pet Postbiotics Supplement Market segmented by Pet Type:
- Dogs
- Cats
- Horses and Other Pets
Pet Postbiotics Supplement Market segmented by Form:
- Powder
- Chews and Tablets
- Capsules
- Liquid and Paste
Pet Postbiotics Supplement Market segmented by Application:
- Digestive Health
- Immunity and Skin
- Oral Health
- Other Applications
Pet Postbiotics Supplement Market segmented by Sales Channel:
- Store-based Retail
- Online Retail
Pet Postbiotics Supplement Market by Region
- North America
- Latin America
- Europe
- East Asia
- South Asia
- Oceania
- Middle East
- Africa
- India
- China
- United States
- Germany
- Japan
Research Sources and Bibliography
- [1] IVH and ZZF. (2026, April 27). Der deutsche Heimtiermarkt 2025. https://www.zzf.de/fileadmin/ZZF/Pressemeldungen/2026/2026_04_27_Marktdaten_der_Heimtierbranche/IVH_ZZF_PM_Der_Deutsche_Heimtiermarkt_2025.pdf
- [2] The Star. (2025, April 18). China pet market recovery signals rebound. https://www.thestar.com.my/business/business-news/2025/04/18/china-pet-market-recovery-signals-rebound
- [3] Global Pet Industry. Postbiotics move beyond gut and digestive health. https://globalpetindustry.com/news/postbiotics-move-beyond-gut-and-digestive-health/
- [4] Dinovite. (2026, January 7). Dinovite expands into canine oral care with triple action dental chews. https://dinovite.com/blogs/learn/dinovite-expands-into-canine-oral-care-with-dental-chews
- [5] Pet Food Industry. (2025, May 9). Other Half Pet Doggie Dental (product database entry). https://www.petfoodindustry.com/pet-food-product-database/product/15745480/other-half-pet-other-half-pet-doggie-dental
- [6] Nestle Purina PetCare. (2026, August 10). Purina Pro Plan Veterinary Supplements launches FortiFlora Diarrhea Response Kit. https://newscenter.purina.com/2026-08-10-Purina-Pro-Plan-Veterinary-Supplements-Launches-FortiFlora-Diarrhea-Response-Kit
- [7] European Pet Food Industry Federation (FEDIAF). (2025). FEDIAF Publishes 2025 Facts and Figures. https://europeanpetfood.org/_/news/fediaf-publishes-2025-facts-and-figures/
- [8] Pet Food Industry. Japan's dog population improves, cats' plateaus (Japan Pet Food Association survey). https://www.petfoodindustry.com/pet-food-market/market-trends-and-reports/news/15817644/japans-dog-population-improves-cats-plateaus
- [9] BCCCI. Summary of the 2025 China Pet Industry White Paper (dog and cat segment growth). https://bccci.net/?p=57952
- [10] Lebensmittelpraxis. Branchenzahlen fuer 2025: Heimtierbranche erreicht knapp 7 Milliarden Euro, doch der stationaere Handel schwaechelt. https://lebensmittelpraxis.de/handel-aktuell/48480-heimtiermarkt-heimtierbranche-erreicht-knapp-7-milliarden-euro-doch-der-stationaere-handel-schwaechelt.html
- [11] American Pet Products Association. (2025, June 24). The American Pet Products Association (APPA) Releases 2025 Dog & Cat Report, Revealing a New Era of Pet Ownership. https://americanpetproducts.org/news/the-american-pet-products-association-appa-releases-2025-dog-cat-report
- [12] American Pet Products Association. (2026, March 26). U.S. Pet Industry Reaches $158 Billion in 2025, Poised for Continued Growth in 2026. https://americanpetproducts.org/news/u.s.-pet-industry-reaches-158-billion-in-2025-poised-for-continued-growth-in-2026
- [13] Global Pet Industry. (2025, September 12). Gut health gains ground as a priority for pet food buyers. https://globalpetindustry.com/article/gut-health-gains-ground-as-a-priority-for-pet-food-buyers/
- [14] China Great Wall International Exhibition Co. (2026). 2026 China Pet Industry White Paper (Consumer Report). https://en.cipscom.com/IndustryNews/25434.htm
- [15] Agriculture and Agri-Food Canada. (2026, May 13). Sector Trend Analysis: Pet food trends in India. https://agriculture.canada.ca/en/international-trade/reports-and-guides/sector-trend-analysis-pet-food-trends-india
- [16] Agriculture and Agri-Food Canada. (2026, May 13). Sector Trend Analysis: Pet food in China. https://agriculture.canada.ca/en/international-trade/reports-and-guides/sector-trend-analysis-pet-food-china
- [17] Agriculture and Agri-Food Canada. (2025, July 2). Sector Trend Analysis: Pet food in Japan. https://agriculture.canada.ca/en/international-trade/reports-and-guides/sector-trend-analysis-pet-food-japan
- [18] International Scientific Association for Probiotics and Prebiotics. (2021). Expert consensus document: the ISAPP consensus statement on the definition and scope of postbiotics. https://isappscience.org/resource/expert-consensus-document-the-international-scientific-association-for-probiotics-and-prebiotics-isapp-consensus-statement-on-the-definition-and-scope-of-postbiotics/
- [19] International Scientific Association for Probiotics and Prebiotics. Clarifying the role of metabolites in the postbiotic definition. https://isappscience.org/clarifying-the-role-of-metabolites-in-the-postbiotic-definition/
- [20] Virbac. (2026, September 2). Floragest: une association de pre et postbiotiques pour renforcer et restaurer le microbiome (Virbac Pro France). https://pro-fr.virbac.com/home/actualites/2026/lct-floragest.html
- [21] Nicolas CS et al. (2026, March 9). Beneficial effects of a prebiotic-postbiotic supplement on digestive health and fecal microbiota in dogs and cats. Frontiers in Veterinary Science 13:1797178. https://www.frontiersin.org/journals/veterinary-science/articles/10.3389/fvets.2026.1797178/pdf
- [22] Dinovite. (2026). Dinovite Targeted Oral Care Dental Powder for Dogs (product page). https://dinovite.com/products/dinovite-dental-powder
Table of Content
- Key Takeaways
- Market Size and CAGR
- Top Growth Driver
- Fastest Growing Segment
- Leading Region
- Key Companies
- Emerging Opportunities
- Executive Summary
- Global Market Outlook
- Demand-side Trends
- Supply-side Trends
- Technology Roadmap Analysis
- Analysis and Recommendations
- Analyst Perspective (What is happening? Why now? What should investors know?)
- Key Questions Answered
- How large is the market?
- What is the CAGR?
- What are key trends?
- Which region dominates?
- Who are the leaders?
Read More...
- Market Overview
- Market Coverage / Taxonomy
- Market Definition / Scope / Limitations
- Research Methodology
- Chapter Orientation
- Analytical Lens and Working Hypotheses
- Market Structure, Signals, and Trend Drivers
- Benchmarking and Cross-market Comparability
- Market Sizing, Forecasting, and Opportunity Mapping
- Research Design and Evidence Framework
- Desk Research Programme (Secondary Evidence)
- Expert Input and Fieldwork (Primary Evidence)
- Tooling, Models, and Reference Databases
- Data Engineering and Model Build
- Quality Assurance and Audit Trail
- Market Background
- Market Dynamics (Drivers, Restraints, Opportunity, Trends)
- Scenario Forecast (Optimistic, Likely, Conservative)
- Impact Analysis
- AI Impact
- Sustainability Impact
- Regulatory Impact
- Technology Impact
- Consumer / Buyer Analysis
- Purchase Drivers
- Adoption Barriers
- Buyer Journey
- Opportunity Map Analysis
- Product Life Cycle Analysis
- Supply Chain Analysis
- Investment Feasibility Matrix
- Value Chain Analysis
- PESTLE and Porter's Analysis
- Regulatory Landscape
- Regional Parent Market Outlook
- Production and Consumption Statistics
- Import and Export Statistics
- Global Market Analysis and Forecast, 2021 to 2036
- Historical Market Size Value (USD Million) Analysis, 2021 to 2025
- Current and Future Market Size Value (USD Million) Projections, 2026 to 2036
- Y-o-Y Growth Trend Analysis
- Absolute $ Opportunity Analysis
- Global Market Pricing Analysis, 2021 to 2036
- Global Market Analysis and Forecast, By Pet Type, 2021 to 2036
- Introduction / Key Findings
- Historical Market Size Value (USD Million) Analysis By Pet Type, 2021 to 2025
- Current and Future Market Size Value (USD Million) Analysis and Forecast By Pet Type, 2026 to 2036
- Dogs
- Cats
- Horses and Other Pets
- Y-o-Y Growth Trend Analysis By Pet Type, 2021 to 2025
- Absolute $ Opportunity Analysis By Pet Type, 2026 to 2036
- Global Market Analysis and Forecast, By Form, 2021 to 2036
- Introduction / Key Findings
- Historical Market Size Value (USD Million) Analysis By Form, 2021 to 2025
- Current and Future Market Size Value (USD Million) Analysis and Forecast By Form, 2026 to 2036
- Powder
- Chews and Tablets
- Capsules
- Liquid and Paste
- Y-o-Y Growth Trend Analysis By Form, 2021 to 2025
- Absolute $ Opportunity Analysis By Form, 2026 to 2036
- Global Market Analysis and Forecast, By Application, 2021 to 2036
- Introduction / Key Findings
- Historical Market Size Value (USD Million) Analysis By Application, 2021 to 2025
- Current and Future Market Size Value (USD Million) Analysis and Forecast By Application, 2026 to 2036
- Digestive Health
- Immunity and Skin
- Oral Health
- Other Applications
- Y-o-Y Growth Trend Analysis By Application, 2021 to 2025
- Absolute $ Opportunity Analysis By Application, 2026 to 2036
- Global Market Analysis and Forecast, By Sales Channel, 2021 to 2036
- Introduction / Key Findings
- Historical Market Size Value (USD Million) Analysis By Sales Channel, 2021 to 2025
- Current and Future Market Size Value (USD Million) Analysis and Forecast By Sales Channel, 2026 to 2036
- Store-based Retail
- Online Retail
- Y-o-Y Growth Trend Analysis By Sales Channel, 2021 to 2025
- Absolute $ Opportunity Analysis By Sales Channel, 2026 to 2036
- Global Market Analysis and Forecast, By Region, 2021 to 2036
- Introduction
- Historical Market Size Value (USD Million) Analysis By Region, 2021 to 2025
- Current Market Size Value (USD Million) Analysis and Forecast By Region, 2026 to 2036
- North America
- Latin America
- Europe
- East Asia
- South Asia
- Oceania
- Middle East
- Africa
- Market Attractiveness Analysis By Region
- North America Market Analysis and Forecast, By Country, 2021 to 2036
- Historical Market Size Value (USD Million) Trend Analysis By Market Taxonomy, 2021 to 2025
- Market Size Value (USD Million) Forecast By Market Taxonomy, 2026 to 2036
- By Country
- By Pet Type
- By Form
- By Application
- By Sales Channel
- Market Attractiveness Analysis
- By Country
- By Pet Type
- By Form
- By Application
- By Sales Channel
- Key Takeaways
- Latin America Market Analysis and Forecast, By Country
- Historical Market Size Value (USD Million) Trend Analysis By Market Taxonomy, 2021 to 2025
- Market Size Value (USD Million) Forecast By Market Taxonomy, 2026 to 2036
- By Country
- By Pet Type
- By Form
- By Application
- By Sales Channel
- Market Attractiveness Analysis
- By Country
- By Pet Type
- By Form
- By Application
- By Sales Channel
- Key Takeaways
- Europe Market Analysis and Forecast, By Country
- Historical Market Size Value (USD Million) Trend Analysis By Market Taxonomy, 2021 to 2025
- Market Size Value (USD Million) Forecast By Market Taxonomy, 2026 to 2036
- By Country
- By Pet Type
- By Form
- By Application
- By Sales Channel
- Market Attractiveness Analysis
- By Country
- By Pet Type
- By Form
- By Application
- By Sales Channel
- Key Takeaways
- East Asia Market Analysis and Forecast, By Country
- Historical Market Size Value (USD Million) Trend Analysis By Market Taxonomy, 2021 to 2025
- Market Size Value (USD Million) Forecast By Market Taxonomy, 2026 to 2036
- By Country
- By Pet Type
- By Form
- By Application
- By Sales Channel
- Market Attractiveness Analysis
- By Country
- By Pet Type
- By Form
- By Application
- By Sales Channel
- Key Takeaways
- South Asia Market Analysis and Forecast, By Country
- Historical Market Size Value (USD Million) Trend Analysis By Market Taxonomy, 2021 to 2025
- Market Size Value (USD Million) Forecast By Market Taxonomy, 2026 to 2036
- By Country
- By Pet Type
- By Form
- By Application
- By Sales Channel
- Market Attractiveness Analysis
- By Country
- By Pet Type
- By Form
- By Application
- By Sales Channel
- Key Takeaways
- Oceania Market Analysis and Forecast, By Country
- Historical Market Size Value (USD Million) Trend Analysis By Market Taxonomy, 2021 to 2025
- Market Size Value (USD Million) Forecast By Market Taxonomy, 2026 to 2036
- By Country
- By Pet Type
- By Form
- By Application
- By Sales Channel
- Market Attractiveness Analysis
- By Country
- By Pet Type
- By Form
- By Application
- By Sales Channel
- Key Takeaways
- Middle East Market Analysis and Forecast, By Country
- Historical Market Size Value (USD Million) Trend Analysis By Market Taxonomy, 2021 to 2025
- Market Size Value (USD Million) Forecast By Market Taxonomy, 2026 to 2036
- By Country
- By Pet Type
- By Form
- By Application
- By Sales Channel
- Market Attractiveness Analysis
- By Country
- By Pet Type
- By Form
- By Application
- By Sales Channel
- Key Takeaways
- Africa Market Analysis and Forecast, By Country
- Historical Market Size Value (USD Million) Trend Analysis By Market Taxonomy, 2021 to 2025
- Market Size Value (USD Million) Forecast By Market Taxonomy, 2026 to 2036
- By Country
- India
- China
- United States
- Germany
- Japan
- By Pet Type
- By Form
- By Application
- By Sales Channel
- By Country
- Market Attractiveness Analysis
- By Country
- By Pet Type
- By Form
- By Application
- By Sales Channel
- Key Takeaways
- Key Countries Market Analysis
- United States
- Pricing Analysis
- Market Share Analysis, 2025
- By Pet Type
- By Form
- By Application
- By Sales Channel
- Germany
- Pricing Analysis
- Market Share Analysis, 2025
- By Pet Type
- By Form
- By Application
- By Sales Channel
- India
- Pricing Analysis
- Market Share Analysis, 2025
- By Pet Type
- By Form
- By Application
- By Sales Channel
- China
- Pricing Analysis
- Market Share Analysis, 2025
- By Pet Type
- By Form
- By Application
- By Sales Channel
- Japan
- Pricing Analysis
- Market Share Analysis, 2025
- By Pet Type
- By Form
- By Application
- By Sales Channel
- United States
- Market Structure Analysis
- Competition Dashboard
- Competition Benchmarking
- Market Share Analysis of Top Players
- By Regional
- By Pet Type
- By Form
- By Application
- By Sales Channel
- Emerging Startups
- Innovation Benchmarking
- Competition Analysis
- Competition Deep Dive
- Virbac SA
- Overview
- Product Portfolio
- Profitability by Market Segments
- Sales Footprint
- Strategy Overview
- Marketing Strategy
- Product Strategy
- Channel Strategy
- Dinovite
- Other Half Pet
- Virbac
- Virbac SA
- Case Studies
- Success Stories
- Recent Developments
- Competition Deep Dive
- Assumptions & Acronyms Used
List of Tables
- Table 1: Global Market Value (USD Million) Forecast by Region, 2021 to 2036
- Table 2: Global Market Value (USD Million) Forecast by Pet Type, 2021 to 2036
- Table 3: Global Market Value (USD Million) Forecast by Form, 2021 to 2036
- Table 4: Global Market Value (USD Million) Forecast by Application, 2021 to 2036
- Table 5: Global Market Value (USD Million) Forecast by Sales Channel, 2021 to 2036
- Table 6: North America Market Value (USD Million) Forecast by Country, 2021 to 2036
- Table 7: North America Market Value (USD Million) Forecast by Pet Type, 2021 to 2036
- Table 8: North America Market Value (USD Million) Forecast by Form, 2021 to 2036
- Table 9: North America Market Value (USD Million) Forecast by Application, 2021 to 2036
- Table 10: North America Market Value (USD Million) Forecast by Sales Channel, 2021 to 2036
- Table 11: Latin America Market Value (USD Million) Forecast by Country, 2021 to 2036
- Table 12: Latin America Market Value (USD Million) Forecast by Pet Type, 2021 to 2036
- Table 13: Latin America Market Value (USD Million) Forecast by Form, 2021 to 2036
- Table 14: Latin America Market Value (USD Million) Forecast by Application, 2021 to 2036
- Table 15: Latin America Market Value (USD Million) Forecast by Sales Channel, 2021 to 2036
- Table 16: Europe Market Value (USD Million) Forecast by Country, 2021 to 2036
- Table 17: Europe Market Value (USD Million) Forecast by Pet Type, 2021 to 2036
- Table 18: Europe Market Value (USD Million) Forecast by Form, 2021 to 2036
- Table 19: Europe Market Value (USD Million) Forecast by Application, 2021 to 2036
- Table 20: Europe Market Value (USD Million) Forecast by Sales Channel, 2021 to 2036
- Table 21: East Asia Market Value (USD Million) Forecast by Country, 2021 to 2036
- Table 22: East Asia Market Value (USD Million) Forecast by Pet Type, 2021 to 2036
- Table 23: East Asia Market Value (USD Million) Forecast by Form, 2021 to 2036
- Table 24: East Asia Market Value (USD Million) Forecast by Application, 2021 to 2036
- Table 25: East Asia Market Value (USD Million) Forecast by Sales Channel, 2021 to 2036
- Table 26: South Asia Market Value (USD Million) Forecast by Country, 2021 to 2036
- Table 27: South Asia Market Value (USD Million) Forecast by Pet Type, 2021 to 2036
- Table 28: South Asia Market Value (USD Million) Forecast by Form, 2021 to 2036
- Table 29: South Asia Market Value (USD Million) Forecast by Application, 2021 to 2036
- Table 30: South Asia Market Value (USD Million) Forecast by Sales Channel, 2021 to 2036
- Table 31: Oceania Market Value (USD Million) Forecast by Country, 2021 to 2036
- Table 32: Oceania Market Value (USD Million) Forecast by Pet Type, 2021 to 2036
- Table 33: Oceania Market Value (USD Million) Forecast by Form, 2021 to 2036
- Table 34: Oceania Market Value (USD Million) Forecast by Application, 2021 to 2036
- Table 35: Oceania Market Value (USD Million) Forecast by Sales Channel, 2021 to 2036
- Table 36: Middle East Market Value (USD Million) Forecast by Country, 2021 to 2036
- Table 37: Middle East Market Value (USD Million) Forecast by Pet Type, 2021 to 2036
- Table 38: Middle East Market Value (USD Million) Forecast by Form, 2021 to 2036
- Table 39: Middle East Market Value (USD Million) Forecast by Application, 2021 to 2036
- Table 40: Middle East Market Value (USD Million) Forecast by Sales Channel, 2021 to 2036
- Table 41: Africa Market Value (USD Million) Forecast by Country, 2021 to 2036
- Table 42: Africa Market Value (USD Million) Forecast by Pet Type, 2021 to 2036
- Table 43: Africa Market Value (USD Million) Forecast by Form, 2021 to 2036
- Table 44: Africa Market Value (USD Million) Forecast by Application, 2021 to 2036
- Table 45: Africa Market Value (USD Million) Forecast by Sales Channel, 2021 to 2036
List of Figures
- Figure 1: Global Market Pricing Analysis
- Figure 2: Global Market Value (USD Million) Forecast 2021-2036
- Figure 3: Global Market Value Share and BPS Analysis by Pet Type, 2026 and 2036
- Figure 4: Global Market Y-o-Y Growth Comparison by Pet Type, 2026-2036
- Figure 5: Global Market Attractiveness Analysis by Pet Type
- Figure 6: Global Market Value Share and BPS Analysis by Form, 2026 and 2036
- Figure 7: Global Market Y-o-Y Growth Comparison by Form, 2026-2036
- Figure 8: Global Market Attractiveness Analysis by Form
- Figure 9: Global Market Value Share and BPS Analysis by Application, 2026 and 2036
- Figure 10: Global Market Y-o-Y Growth Comparison by Application, 2026-2036
- Figure 11: Global Market Attractiveness Analysis by Application
- Figure 12: Global Market Value Share and BPS Analysis by Sales Channel, 2026 and 2036
- Figure 13: Global Market Y-o-Y Growth Comparison by Sales Channel, 2026-2036
- Figure 14: Global Market Attractiveness Analysis by Sales Channel
- Figure 15: Global Market Value (USD Million) Share and BPS Analysis by Region, 2026 and 2036
- Figure 16: Global Market Y-o-Y Growth Comparison by Region, 2026-2036
- Figure 17: Global Market Attractiveness Analysis by Region
- Figure 18: North America Market Incremental Dollar Opportunity, 2026-2036
- Figure 19: Latin America Market Incremental Dollar Opportunity, 2026-2036
- Figure 20: Europe Market Incremental Dollar Opportunity, 2026-2036
- Figure 21: East Asia Market Incremental Dollar Opportunity, 2026-2036
- Figure 22: South Asia Market Incremental Dollar Opportunity, 2026-2036
- Figure 23: Oceania Market Incremental Dollar Opportunity, 2026-2036
- Figure 24: Middle East Market Incremental Dollar Opportunity, 2026-2036
- Figure 25: Africa Market Incremental Dollar Opportunity, 2026-2036
- Figure 26: North America Market Value Share and BPS Analysis by Country, 2026 and 2036
- Figure 27: North America Market Value Share and BPS Analysis by Pet Type, 2026 and 2036
- Figure 28: North America Market Y-o-Y Growth Comparison by Pet Type, 2026-2036
- Figure 29: North America Market Attractiveness Analysis by Pet Type
- Figure 30: North America Market Value Share and BPS Analysis by Form, 2026 and 2036
- Figure 31: North America Market Y-o-Y Growth Comparison by Form, 2026-2036
- Figure 32: North America Market Attractiveness Analysis by Form
- Figure 33: North America Market Value Share and BPS Analysis by Application, 2026 and 2036
- Figure 34: North America Market Y-o-Y Growth Comparison by Application, 2026-2036
- Figure 35: North America Market Attractiveness Analysis by Application
- Figure 36: North America Market Value Share and BPS Analysis by Sales Channel, 2026 and 2036
- Figure 37: North America Market Y-o-Y Growth Comparison by Sales Channel, 2026-2036
- Figure 38: North America Market Attractiveness Analysis by Sales Channel
- Figure 39: Latin America Market Value Share and BPS Analysis by Country, 2026 and 2036
- Figure 40: Latin America Market Value Share and BPS Analysis by Pet Type, 2026 and 2036
- Figure 41: Latin America Market Y-o-Y Growth Comparison by Pet Type, 2026-2036
- Figure 42: Latin America Market Attractiveness Analysis by Pet Type
- Figure 43: Latin America Market Value Share and BPS Analysis by Form, 2026 and 2036
- Figure 44: Latin America Market Y-o-Y Growth Comparison by Form, 2026-2036
- Figure 45: Latin America Market Attractiveness Analysis by Form
- Figure 46: Latin America Market Value Share and BPS Analysis by Application, 2026 and 2036
- Figure 47: Latin America Market Y-o-Y Growth Comparison by Application, 2026-2036
- Figure 48: Latin America Market Attractiveness Analysis by Application
- Figure 49: Latin America Market Value Share and BPS Analysis by Sales Channel, 2026 and 2036
- Figure 50: Latin America Market Y-o-Y Growth Comparison by Sales Channel, 2026-2036
- Figure 51: Latin America Market Attractiveness Analysis by Sales Channel
- Figure 52: Europe Market Value Share and BPS Analysis by Country, 2026 and 2036
- Figure 53: Europe Market Value Share and BPS Analysis by Pet Type, 2026 and 2036
- Figure 54: Europe Market Y-o-Y Growth Comparison by Pet Type, 2026-2036
- Figure 55: Europe Market Attractiveness Analysis by Pet Type
- Figure 56: Europe Market Value Share and BPS Analysis by Form, 2026 and 2036
- Figure 57: Europe Market Y-o-Y Growth Comparison by Form, 2026-2036
- Figure 58: Europe Market Attractiveness Analysis by Form
- Figure 59: Europe Market Value Share and BPS Analysis by Application, 2026 and 2036
- Figure 60: Europe Market Y-o-Y Growth Comparison by Application, 2026-2036
- Figure 61: Europe Market Attractiveness Analysis by Application
- Figure 62: Europe Market Value Share and BPS Analysis by Sales Channel, 2026 and 2036
- Figure 63: Europe Market Y-o-Y Growth Comparison by Sales Channel, 2026-2036
- Figure 64: Europe Market Attractiveness Analysis by Sales Channel
- Figure 65: East Asia Market Value Share and BPS Analysis by Country, 2026 and 2036
- Figure 66: East Asia Market Value Share and BPS Analysis by Pet Type, 2026 and 2036
- Figure 67: East Asia Market Y-o-Y Growth Comparison by Pet Type, 2026-2036
- Figure 68: East Asia Market Attractiveness Analysis by Pet Type
- Figure 69: East Asia Market Value Share and BPS Analysis by Form, 2026 and 2036
- Figure 70: East Asia Market Y-o-Y Growth Comparison by Form, 2026-2036
- Figure 71: East Asia Market Attractiveness Analysis by Form
- Figure 72: East Asia Market Value Share and BPS Analysis by Application, 2026 and 2036
- Figure 73: East Asia Market Y-o-Y Growth Comparison by Application, 2026-2036
- Figure 74: East Asia Market Attractiveness Analysis by Application
- Figure 75: East Asia Market Value Share and BPS Analysis by Sales Channel, 2026 and 2036
- Figure 76: East Asia Market Y-o-Y Growth Comparison by Sales Channel, 2026-2036
- Figure 77: East Asia Market Attractiveness Analysis by Sales Channel
- Figure 78: South Asia Market Value Share and BPS Analysis by Country, 2026 and 2036
- Figure 79: South Asia Market Value Share and BPS Analysis by Pet Type, 2026 and 2036
- Figure 80: South Asia Market Y-o-Y Growth Comparison by Pet Type, 2026-2036
- Figure 81: South Asia Market Attractiveness Analysis by Pet Type
- Figure 82: South Asia Market Value Share and BPS Analysis by Form, 2026 and 2036
- Figure 83: South Asia Market Y-o-Y Growth Comparison by Form, 2026-2036
- Figure 84: South Asia Market Attractiveness Analysis by Form
- Figure 85: South Asia Market Value Share and BPS Analysis by Application, 2026 and 2036
- Figure 86: South Asia Market Y-o-Y Growth Comparison by Application, 2026-2036
- Figure 87: South Asia Market Attractiveness Analysis by Application
- Figure 88: South Asia Market Value Share and BPS Analysis by Sales Channel, 2026 and 2036
- Figure 89: South Asia Market Y-o-Y Growth Comparison by Sales Channel, 2026-2036
- Figure 90: South Asia Market Attractiveness Analysis by Sales Channel
- Figure 91: Oceania Market Value Share and BPS Analysis by Country, 2026 and 2036
- Figure 92: Oceania Market Value Share and BPS Analysis by Pet Type, 2026 and 2036
- Figure 93: Oceania Market Y-o-Y Growth Comparison by Pet Type, 2026-2036
- Figure 94: Oceania Market Attractiveness Analysis by Pet Type
- Figure 95: Oceania Market Value Share and BPS Analysis by Form, 2026 and 2036
- Figure 96: Oceania Market Y-o-Y Growth Comparison by Form, 2026-2036
- Figure 97: Oceania Market Attractiveness Analysis by Form
- Figure 98: Oceania Market Value Share and BPS Analysis by Application, 2026 and 2036
- Figure 99: Oceania Market Y-o-Y Growth Comparison by Application, 2026-2036
- Figure 100: Oceania Market Attractiveness Analysis by Application
- Figure 101: Oceania Market Value Share and BPS Analysis by Sales Channel, 2026 and 2036
- Figure 102: Oceania Market Y-o-Y Growth Comparison by Sales Channel, 2026-2036
- Figure 103: Oceania Market Attractiveness Analysis by Sales Channel
- Figure 104: Middle East Market Value Share and BPS Analysis by Country, 2026 and 2036
- Figure 105: Middle East Market Value Share and BPS Analysis by Pet Type, 2026 and 2036
- Figure 106: Middle East Market Y-o-Y Growth Comparison by Pet Type, 2026-2036
- Figure 107: Middle East Market Attractiveness Analysis by Pet Type
- Figure 108: Middle East Market Value Share and BPS Analysis by Form, 2026 and 2036
- Figure 109: Middle East Market Y-o-Y Growth Comparison by Form, 2026-2036
- Figure 110: Middle East Market Attractiveness Analysis by Form
- Figure 111: Middle East Market Value Share and BPS Analysis by Application, 2026 and 2036
- Figure 112: Middle East Market Y-o-Y Growth Comparison by Application, 2026-2036
- Figure 113: Middle East Market Attractiveness Analysis by Application
- Figure 114: Middle East Market Value Share and BPS Analysis by Sales Channel, 2026 and 2036
- Figure 115: Middle East Market Y-o-Y Growth Comparison by Sales Channel, 2026-2036
- Figure 116: Middle East Market Attractiveness Analysis by Sales Channel
- Figure 117: Africa Market Value Share and BPS Analysis by Country, 2026 and 2036
- Figure 118: Africa Market Value Share and BPS Analysis by Pet Type, 2026 and 2036
- Figure 119: Africa Market Y-o-Y Growth Comparison by Pet Type, 2026-2036
- Figure 120: Africa Market Attractiveness Analysis by Pet Type
- Figure 121: Africa Market Value Share and BPS Analysis by Form, 2026 and 2036
- Figure 122: Africa Market Y-o-Y Growth Comparison by Form, 2026-2036
- Figure 123: Africa Market Attractiveness Analysis by Form
- Figure 124: Africa Market Value Share and BPS Analysis by Application, 2026 and 2036
- Figure 125: Africa Market Y-o-Y Growth Comparison by Application, 2026-2036
- Figure 126: Africa Market Attractiveness Analysis by Application
- Figure 127: Africa Market Value Share and BPS Analysis by Sales Channel, 2026 and 2036
- Figure 128: Africa Market Y-o-Y Growth Comparison by Sales Channel, 2026-2036
- Figure 129: Africa Market Attractiveness Analysis by Sales Channel
- Figure 130: Global Market - Tier Structure Analysis
- Figure 131: Global Market - Company Share Analysis
Frequently Asked Questions
How big is the pet postbiotics supplement market in 2026?
FMI estimates the market at USD 261.7 million in 2026, up from USD 244.8 million in 2025. It is forecast to reach USD 510.0 million by 2036 at a 6.9% CAGR.
Which pet type leads the market in 2026?
Dogs lead by pet type with 55.0% in 2026. Cats and other pets hold the remaining 45.0%.
Which form leads the market?
Powder leads by form with 48.0% in 2026, helped by dosing on food by dog weight [22].
Which country is forecast to grow fastest through 2036?
India has the highest forecast CAGR among the profiled countries at 10.0% during 2026 to 2036, followed by China at 9.0%. These are FMI forecasts and are not rates reported by the cited public bodies.
What is a postbiotic in a pet supplement?
A postbiotic is a preparation of inanimate microorganisms and/or their components that confers a health benefit on the host [18]. Pet products use them for gut and oral claims [4][20].
What limits growth in the category?
Clinical evidence is still limited and mostly supplier-reported [4][21], and spending on pet accessories is soft in Germany [1].
Preview the report firsthand - request a free sample
Get SampleGet the brochure for pricing and purchase details.
Get PDF
