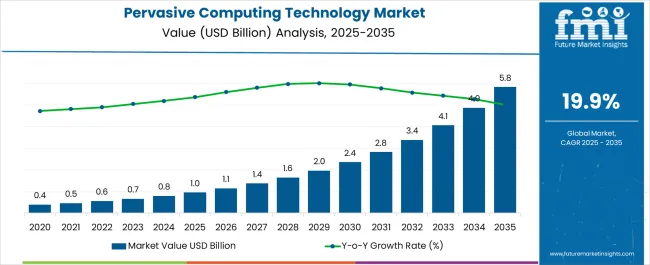
[298 Pages Report] Global pervasive computing technology market demand is anticipated to be valued at USD 551.0 Million in 2022, forecast a CAGR of 19.9% to be valued at USD 3,390.2 Million from 2022 to 2032. Growth is attributed to the increasing usage of IoT-based applications. From 2016 to 2021 a CAGR of 18.5% was registered for the Pervasive Computing Technology market.
Data Points | Key Statistics |
---|---|
Growth Rate (2016 to 2021) | 18.5% CAGR |
Projected Growth Rate (2022 to 2032) | 19.9% CAGR |
Expected Market Value (2022) | USD 551 Million |
Anticipated Forecast Value (2032) | USD 3,390 Million |
Pervasive computing is a trending technology, which involves imparting of embedding computational capability to any device such as wearable computing gadgets, smartphones, lighting, etc. to facilitate effective communication.
The underlying technologies such as artificial intelligence, wireless communications, location and positioning, internet capabilities, mobile protocols, advanced middleware, networking, embedded systems and voice recognition support pervasive computing. Currently, Ubiquitous Computing is also known as IoT (Internet-of-things) which means connecting devices or everyday objects to the internet.
Rapid Development in Technology to Drive the Growth of the Market in the Forecast Period
Growing consumer industries, for instance, logistics, healthcare, and automotive are anticipated to propel the Pervasive Computing technology (Ubiquitous Computing) Market over forthcoming years. Further, the need of being connected is spurring day by day, so to facilitate the same the demand for Ubiquitous Computing is growing.
Machine-to-machine communications, reduced data communications cost, production costs and even a decrease in the size of the transistors, these factors are piloting the growth of the Pervasive Computing technology (Ubiquitous Computing) Market.
The global pervasive computing technology is primarily driven by factors including the increasing usage of smart electronic devices. Moreover, rapid technological advancements are also expected to positively impact market growth during the forecast period. In addition, increasing uses of cloud computing are also expected to create better opportunities for the growth of the market across different parts of the world.
Although the pervasive computing technology market has numerous end-uses, there are numerous obstacles that likely pose a challenge to market growth.
The pervasive computing market faces several technological challenges such as flaws in human-machine interfaces, users’ intent, energy management issues, cyber forage, and context awareness along with user privacy concerns. From the viewpoint of big data, the challenge for pervasive computing is to integrate data from many disparate sources.
Technological Advancements in Connected Devices to Fuel Industry Expansion
North America is holding the largest market share of the pervasive computing technology market due to the increasing number of smartphone users and developed infrastructure. North America accounts for a 40.1% share of the global pervasive computing technology market.
North America is considered to be a mature economy in terms of technology adoption owing to the presence of major players such as IBM Corporation in the respective region are anticipated to drive the growth of the Pervasive Computing technology market during the forecast period.
Growing preference towards wireless technologies, along with rapid adoption of advanced technology-based solutions and services is expected to create a conducive environment for pervasive computing technology during the forecast period.
High Adoption of Communication Technologies in The Region to Boost the Growth of the Market
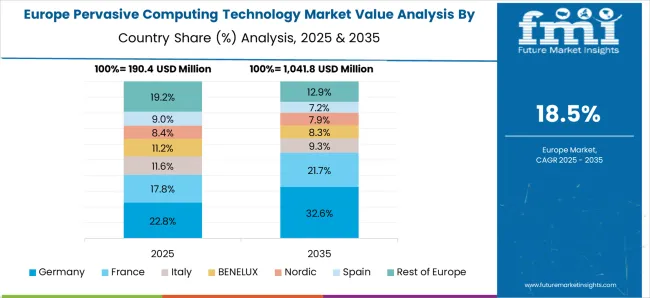
In the Europe region, the market for pervasive computing technology is witnessing a high growth rate due to the increasing consumer preference for smart devices. The rise in disposable income, as well as the increased adoption and desire for new technical gadgets, are some of the primary drivers of pervasive computing technology market growth. The Europe pervasive computing technology market accounts for 14.7% share of the total global market.
The region has witnessed huge investments in wireless technologies and the rapid adoption of trending technologies, such as cloud, IoT, mobility, and UC, which drives the critical need for reliable connectivity and communication. Also, increasing adoption of advanced communication equipment across all industries in the region to enhance the pervasive computing technology. Moreover, rapid advancements being made in technology coupled with increasing investments in Research and Development are anticipated to further drive the market.
Increasing Digitalization in The Region Boost the Market Growth in Coming Years
The Asia Pacific is expected to offer a significant opportunity to the market for pervasive computing technology market during the forecast period, the technological advancements in the region. Factors such as the rapid urbanization and a continuous upgradation of technological infrastructures in the region would create lucrative growth prospects across the Asia Pacific region.
The market is growing due to the advancements in the consumer electronics industry. In Asia Pacific, emerging economies such as China and India are expected to drive the demand for pervasive computing owing to increasing smartphone penetration, expansion in automotive industry and growing number of internet subscribers.
The new entrants in the pervasive computing technology market are continually indulging in several collaborations and highly investing in research and development activities to provide more convenient solutions to industry verticals. Some of the major start-ups that are leading the development of the market are Vizin India Private Limited, Powercast,
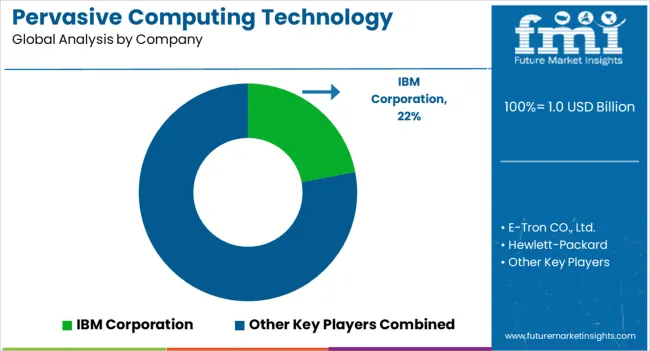
Some of the key participants present in the global pervasive computing technology market include Blazon Marketing Inc., E-Tron CO., Ltd., Hewlett-Packard, Neo Mtel Co., Ltd., Palo Alto Research center Incorporated (PARC), AT&T Inc., Maruhachi Warehouse Co., Ltd., IBM Corporation, Fujitsu Laboratories of America, Inc., and Tata Consultancy Services Limited. among others.
Attributed to the presence of such a high number of participants, the market is highly competitive. While global players such as Blazon Marketing Inc., E-Tron CO., Ltd., Hewlett-Packard, Neo Mtel Co., Ltd., Palo Alto Research center Incorporated (PARC), AT&T Inc., Maruhachi Warehouse Co., Ltd., IBM Corporation account for considerable market size, several regional-level players are also operating across key growth regions, particularly in the Asia Pacific.
Report Attribute | Details |
---|---|
Growth Rate | CAGR of 19.9% from 2022 to 2032 |
Expected Market Value (2022) | USD 551 Million |
Anticipated Forecast Value (2032) | USD 3390.2 Million |
Base Year for Estimation | 2021 |
Historical Data | 2016-2021 |
Forecast Period | 2022-2032 |
Quantitative Units | Revenue in USD Billion, Volume in Kilotons and CAGR from 2022-2032 |
Report Coverage | Revenue Forecast, Volume Forecast, Company Ranking, Competitive Landscape, Growth Factors, Trends and Pricing Analysis |
Segments Covered | Products, Mobile Computing, Context Adaptation & Adaptation Application Architecture, Intelligent Environment, Applications, Region |
Regions Covered | North America; Latin America; Europe; Asia Pacific; Middle East and Africa |
Key Countries Profiled | USA, Canada, Mexico, Brazil, Germany, Italy, France, UK, Spain, China, Japan, South Korea, Malesia, Singapore, Australia, GCC Countries, Southern Africa, Israel |
Key Companies Profiled | Blazon Marketing Inc.; E-Tron CO., Ltd; Hewlett-Packard; Neo Mtel Co., Ltd.; Palo Alto Research center Incorporated (PARC), AT&T Inc.; Maruhachi Warehouse Co., Ltd.; IBM Corporation; Fujitsu Laboratories of America, Inc.; Tata Consultancy Services Limited. |
Customization | Available Upon Request |
Table 1: Global Pervasive Computing Technology Value (US$ Mn) Forecast by Region, 2016-2032
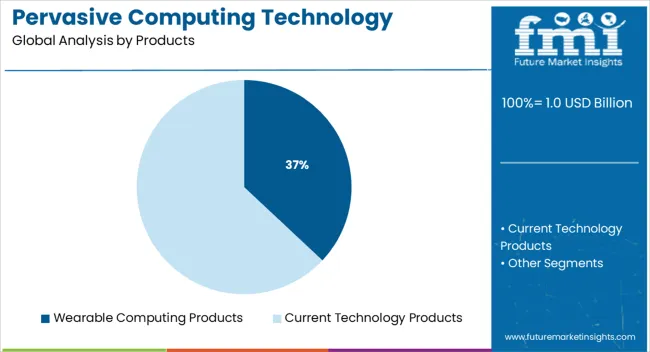
Table 2: Global Pervasive Computing Technology Value (US$ Mn) Forecast by Products, 2016-2032
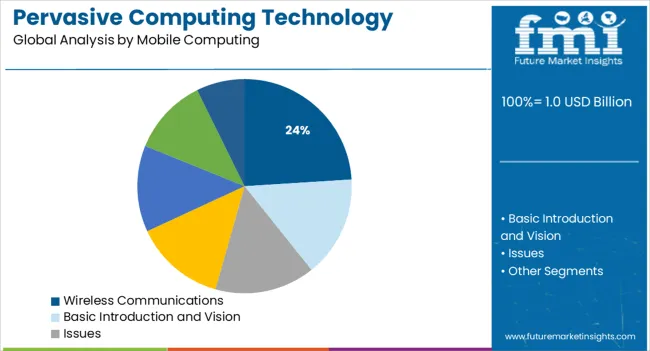
Table 3: Global Pervasive Computing Technology Value (US$ Mn) Forecast by Mobile Computing, 2016-2032
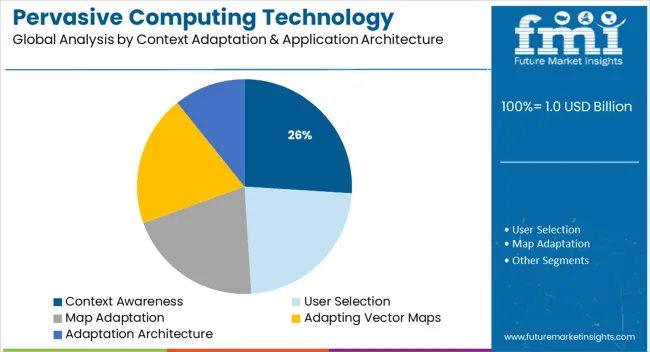
Table 4: Global Pervasive Computing Technology Value (US$ Mn) Forecast by Context Adaptation & Adaptation Application Architecture , 2016-2032
Table 5: Global Pervasive Computing Technology Value (US$ Mn) Forecast by Intelligent Environment, 2016-2032
Table 6: Global Pervasive Computing Technology Value (US$ Mn) Forecast by Application, 2016-2032
Table 7: North America Pervasive Computing Technology Value (US$ Mn) Forecast by Country, 2016-2032
Table 8: North America Pervasive Computing Technology Value (US$ Mn) Forecast by Products, 2016-2032
Table 9: North America Pervasive Computing Technology Value (US$ Mn) Forecast by Mobile Computing, 2016-2032
Table 10: North America Pervasive Computing Technology Value (US$ Mn) Forecast by Context Adaptation & Adaptation Application Architecture , 2016-2032
Table 11: North America Pervasive Computing Technology Value (US$ Mn) Forecast by Intelligent Environment, 2016-2032
Table 12: North America Pervasive Computing Technology Value (US$ Mn) Forecast by Application, 2016-2032
Table 13: Latin America Pervasive Computing Technology Value (US$ Mn) Forecast by Country, 2016-2032
Table 14: Latin America Pervasive Computing Technology Value (US$ Mn) Forecast by Products, 2016-2032
Table 15: Latin America Pervasive Computing Technology Value (US$ Mn) Forecast by Mobile Computing, 2016-2032
Table 16: Latin America Pervasive Computing Technology Value (US$ Mn) Forecast by Context Adaptation & Adaptation Application Architecture , 2016-2032
Table 17: Latin America Pervasive Computing Technology Value (US$ Mn) Forecast by Intelligent Environment, 2016-2032
Table 18: Latin America Pervasive Computing Technology Value (US$ Mn) Forecast by Application, 2016-2032
Table 19: Europe Pervasive Computing Technology Value (US$ Mn) Forecast by Country, 2016-2032
Table 20: Europe Pervasive Computing Technology Value (US$ Mn) Forecast by Products, 2016-2032
Table 21: Europe Pervasive Computing Technology Value (US$ Mn) Forecast by Mobile Computing, 2016-2032
Table 22: Europe Pervasive Computing Technology Value (US$ Mn) Forecast by Context Adaptation & Adaptation Application Architecture , 2016-2032
Table 23: Europe Pervasive Computing Technology Value (US$ Mn) Forecast by Intelligent Environment, 2016-2032
Table 24: Europe Pervasive Computing Technology Value (US$ Mn) Forecast by Application, 2016-2032
Table 25: South Asia Pervasive Computing Technology Value (US$ Mn) Forecast by Country, 2016-2032
Table 26: South Asia Pervasive Computing Technology Value (US$ Mn) Forecast by Products, 2016-2032
Table 27: South Asia Pervasive Computing Technology Value (US$ Mn) Forecast by Mobile Computing, 2016-2032
Table 28: South Asia Pervasive Computing Technology Value (US$ Mn) Forecast by Context Adaptation & Adaptation Application Architecture , 2016-2032
Table 29: South Asia Pervasive Computing Technology Value (US$ Mn) Forecast by Intelligent Environment, 2016-2032
Table 30: South Asia Pervasive Computing Technology Value (US$ Mn) Forecast by Application, 2016-2032
Table 31: East Asia Pervasive Computing Technology Value (US$ Mn) Forecast by Country, 2016-2032
Table 32: East Asia Pervasive Computing Technology Value (US$ Mn) Forecast by Products, 2016-2032
Table 33: East Asia Pervasive Computing Technology Value (US$ Mn) Forecast by Mobile Computing, 2016-2032
Table 34: East Asia Pervasive Computing Technology Value (US$ Mn) Forecast by Context Adaptation & Adaptation Application Architecture , 2016-2032
Table 35: East Asia Pervasive Computing Technology Value (US$ Mn) Forecast by Intelligent Environment, 2016-2032
Table 36: East Asia Pervasive Computing Technology Value (US$ Mn) Forecast by Application, 2016-2032
Table 37: Oceania Pervasive Computing Technology Value (US$ Mn) Forecast by Country, 2016-2032
Table 38: Oceania Pervasive Computing Technology Value (US$ Mn) Forecast by Products, 2016-2032
Table 39: Oceania Pervasive Computing Technology Value (US$ Mn) Forecast by Mobile Computing, 2016-2032
Table 40: Oceania Pervasive Computing Technology Value (US$ Mn) Forecast by Context Adaptation & Adaptation Application Architecture , 2016-2032
Table 41: Oceania Pervasive Computing Technology Value (US$ Mn) Forecast by Intelligent Environment, 2016-2032
Table 42: Oceania Pervasive Computing Technology Value (US$ Mn) Forecast by Application, 2016-2032
Table 43: MEA Pervasive Computing Technology Value (US$ Mn) Forecast by Country, 2016-2032
Table 44: MEA Pervasive Computing Technology Value (US$ Mn) Forecast by Products, 2016-2032
Table 45: MEA Pervasive Computing Technology Value (US$ Mn) Forecast by Mobile Computing, 2016-2032
Table 46: MEA Pervasive Computing Technology Value (US$ Mn) Forecast by Context Adaptation & Adaptation Application Architecture , 2016-2032
Table 47: MEA Pervasive Computing Technology Value (US$ Mn) Forecast by Intelligent Environment, 2016-2032
Table 48: MEA Pervasive Computing Technology Value (US$ Mn) Forecast by Application, 2016-2032
Figure 1: Global Pervasive Computing Technology Value (US$ Mn) by Products, 2022-2032
Figure 2: Global Pervasive Computing Technology Value (US$ Mn) by Mobile Computing, 2022-2032
Figure 3: Global Pervasive Computing Technology Value (US$ Mn) by Context Adaptation & Adaptation Application Architecture, 2022-2032
Figure 4: Global Pervasive Computing Technology Value (US$ Mn) by Intelligent Environment, 2022-2032
Figure 5: Global Pervasive Computing Technology Value (US$ Mn) by Application, 2022-2032
Figure 6: Global Pervasive Computing Technology Value (US$ Mn) by Region, 2022-2032
Figure 7: Global Pervasive Computing Technology Value (US$ Mn) Analysis by Region, 2016-2032
Figure 8: Global Pervasive Computing Technology Value Share (%) and BPS Analysis by Region, 2022-2032
Figure 9: Global Pervasive Computing Technology Y-o-Y Growth (%) Projections by Region, 2022-2032
Figure 10: Global Pervasive Computing Technology Value (US$ Mn) Analysis by Products, 2016-2032
Figure 11: Global Pervasive Computing Technology Value Share (%) and BPS Analysis by Products, 2022-2032
Figure 12: Global Pervasive Computing Technology Y-o-Y Growth (%) Projections by Products, 2022-2032
Figure 13: Global Pervasive Computing Technology Value (US$ Mn) Analysis by Mobile Computing, 2016-2032
Figure 14: Global Pervasive Computing Technology Value Share (%) and BPS Analysis by Mobile Computing, 2022-2032
Figure 15: Global Pervasive Computing Technology Y-o-Y Growth (%) Projections by Mobile Computing, 2022-2032
Figure 16: Global Pervasive Computing Technology Value (US$ Mn) Analysis by Context Adaptation & Adaptation Application Architecture , 2016-2032
Figure 17: Global Pervasive Computing Technology Value Share (%) and BPS Analysis by Context Adaptation & Adaptation Application Architecture , 2022-2032
Figure 18: Global Pervasive Computing Technology Y-o-Y Growth (%) Projections by Context Adaptation & Adaptation Application Architecture , 2022-2032
Figure 19: Global Pervasive Computing Technology Value (US$ Mn) Analysis by Intelligent Environment, 2016-2032
Figure 20: Global Pervasive Computing Technology Value Share (%) and BPS Analysis by Intelligent Environment, 2022-2032
Figure 21: Global Pervasive Computing Technology Y-o-Y Growth (%) Projections by Intelligent Environment, 2022-2032
Figure 22: Global Pervasive Computing Technology Value (US$ Mn) Analysis by Application, 2016-2032
Figure 23: Global Pervasive Computing Technology Value Share (%) and BPS Analysis by Application, 2022-2032
Figure 24: Global Pervasive Computing Technology Y-o-Y Growth (%) Projections by Application, 2022-2032
Figure 25: Global Pervasive Computing Technology Attractiveness by Products, 2022-2032
Figure 26: Global Pervasive Computing Technology Attractiveness by Mobile Computing, 2022-2032
Figure 27: Global Pervasive Computing Technology Attractiveness by Context Adaptation & Adaptation Application Architecture , 2022-2032
Figure 28: Global Pervasive Computing Technology Attractiveness by Intelligent Environment, 2022-2032
Figure 29: Global Pervasive Computing Technology Attractiveness by Application, 2022-2032
Figure 30: Global Pervasive Computing Technology Attractiveness by Region, 2022-2032
Figure 31: North America Pervasive Computing Technology Value (US$ Mn) by Products, 2022-2032
Figure 32: North America Pervasive Computing Technology Value (US$ Mn) by Mobile Computing, 2022-2032
Figure 33: North America Pervasive Computing Technology Value (US$ Mn) by Context Adaptation & Adaptation Application Architecture , 2022-2032
Figure 34: North America Pervasive Computing Technology Value (US$ Mn) by Intelligent Environment, 2022-2032
Figure 35: North America Pervasive Computing Technology Value (US$ Mn) by Application, 2022-2032
Figure 36: North America Pervasive Computing Technology Value (US$ Mn) by Country, 2022-2032
Figure 37: North America Pervasive Computing Technology Value (US$ Mn) Analysis by Country, 2016-2032
Figure 38: North America Pervasive Computing Technology Value Share (%) and BPS Analysis by Country, 2022-2032
Figure 39: North America Pervasive Computing Technology Y-o-Y Growth (%) Projections by Country, 2022-2032
Figure 40: North America Pervasive Computing Technology Value (US$ Mn) Analysis by Products, 2016-2032
Figure 41: North America Pervasive Computing Technology Value Share (%) and BPS Analysis by Products, 2022-2032
Figure 42: North America Pervasive Computing Technology Y-o-Y Growth (%) Projections by Products, 2022-2032
Figure 43: North America Pervasive Computing Technology Value (US$ Mn) Analysis by Mobile Computing, 2016-2032
Figure 44: North America Pervasive Computing Technology Value Share (%) and BPS Analysis by Mobile Computing, 2022-2032
Figure 45: North America Pervasive Computing Technology Y-o-Y Growth (%) Projections by Mobile Computing, 2022-2032
Figure 46: North America Pervasive Computing Technology Value (US$ Mn) Analysis by Context Adaptation & Adaptation Application Architecture , 2016-2032
Figure 47: North America Pervasive Computing Technology Value Share (%) and BPS Analysis by Context Adaptation & Adaptation Application Architecture , 2022-2032
Figure 48: North America Pervasive Computing Technology Y-o-Y Growth (%) Projections by Context Adaptation & Adaptation Application Architecture , 2022-2032
Figure 49: North America Pervasive Computing Technology Value (US$ Mn) Analysis by Intelligent Environment, 2016-2032
Figure 50: North America Pervasive Computing Technology Value Share (%) and BPS Analysis by Intelligent Environment, 2022-2032
Figure 51: North America Pervasive Computing Technology Y-o-Y Growth (%) Projections by Intelligent Environment, 2022-2032
Figure 52: North America Pervasive Computing Technology Value (US$ Mn) Analysis by Application, 2016-2032
Figure 53: North America Pervasive Computing Technology Value Share (%) and BPS Analysis by Application, 2022-2032
Figure 54: North America Pervasive Computing Technology Y-o-Y Growth (%) Projections by Application, 2022-2032
Figure 55: North America Pervasive Computing Technology Attractiveness by Products, 2022-2032
Figure 56: North America Pervasive Computing Technology Attractiveness by Mobile Computing, 2022-2032
Figure 57: North America Pervasive Computing Technology Attractiveness by Context Adaptation & Adaptation Application Architecture , 2022-2032
Figure 58: North America Pervasive Computing Technology Attractiveness by Intelligent Environment, 2022-2032
Figure 59: North America Pervasive Computing Technology Attractiveness by Application, 2022-2032
Figure 60: North America Pervasive Computing Technology Attractiveness by Country, 2022-2032
Figure 61: Latin America Pervasive Computing Technology Value (US$ Mn) by Products, 2022-2032
Figure 62: Latin America Pervasive Computing Technology Value (US$ Mn) by Mobile Computing, 2022-2032
Figure 63: Latin America Pervasive Computing Technology Value (US$ Mn) by Context Adaptation & Adaptation Application Architecture , 2022-2032
Figure 64: Latin America Pervasive Computing Technology Value (US$ Mn) by Intelligent Environment, 2022-2032
Figure 65: Latin America Pervasive Computing Technology Value (US$ Mn) by Application, 2022-2032
Figure 66: Latin America Pervasive Computing Technology Value (US$ Mn) by Country, 2022-2032
Figure 67: Latin America Pervasive Computing Technology Value (US$ Mn) Analysis by Country, 2016-2032
Figure 68: Latin America Pervasive Computing Technology Value Share (%) and BPS Analysis by Country, 2022-2032
Figure 69: Latin America Pervasive Computing Technology Y-o-Y Growth (%) Projections by Country, 2022-2032
Figure 70: Latin America Pervasive Computing Technology Value (US$ Mn) Analysis by Products, 2016-2032
Figure 71: Latin America Pervasive Computing Technology Value Share (%) and BPS Analysis by Products, 2022-2032
Figure 72: Latin America Pervasive Computing Technology Y-o-Y Growth (%) Projections by Products, 2022-2032
Figure 73: Latin America Pervasive Computing Technology Value (US$ Mn) Analysis by Mobile Computing, 2016-2032
Figure 74: Latin America Pervasive Computing Technology Value Share (%) and BPS Analysis by Mobile Computing, 2022-2032
Figure 75: Latin America Pervasive Computing Technology Y-o-Y Growth (%) Projections by Mobile Computing, 2022-2032
Figure 76: Latin America Pervasive Computing Technology Value (US$ Mn) Analysis by Context Adaptation & Adaptation Application Architecture , 2016-2032
Figure 77: Latin America Pervasive Computing Technology Value Share (%) and BPS Analysis by Context Adaptation & Adaptation Application Architecture , 2022-2032
Figure 78: Latin America Pervasive Computing Technology Y-o-Y Growth (%) Projections by Context Adaptation & Adaptation Application Architecture , 2022-2032
Figure 79: Latin America Pervasive Computing Technology Value (US$ Mn) Analysis by Intelligent Environment, 2016-2032
Figure 80: Latin America Pervasive Computing Technology Value Share (%) and BPS Analysis by Intelligent Environment, 2022-2032
Figure 81: Latin America Pervasive Computing Technology Y-o-Y Growth (%) Projections by Intelligent Environment, 2022-2032
Figure 82: Latin America Pervasive Computing Technology Value (US$ Mn) Analysis by Application, 2016-2032
Figure 83: Latin America Pervasive Computing Technology Value Share (%) and BPS Analysis by Application, 2022-2032
Figure 84: Latin America Pervasive Computing Technology Y-o-Y Growth (%) Projections by Application, 2022-2032
Figure 85: Latin America Pervasive Computing Technology Attractiveness by Products, 2022-2032
Figure 86: Latin America Pervasive Computing Technology Attractiveness by Mobile Computing, 2022-2032
Figure 87: Latin America Pervasive Computing Technology Attractiveness by Context Adaptation & Adaptation Application Architecture , 2022-2032
Figure 88: Latin America Pervasive Computing Technology Attractiveness by Intelligent Environment, 2022-2032
Figure 89: Latin America Pervasive Computing Technology Attractiveness by Application, 2022-2032
Figure 90: Latin America Pervasive Computing Technology Attractiveness by Country, 2022-2032
Figure 91: Europe Pervasive Computing Technology Value (US$ Mn) by Products, 2022-2032
Figure 92: Europe Pervasive Computing Technology Value (US$ Mn) by Mobile Computing, 2022-2032
Figure 93: Europe Pervasive Computing Technology Value (US$ Mn) by Context Adaptation & Adaptation Application Architecture , 2022-2032
Figure 94: Europe Pervasive Computing Technology Value (US$ Mn) by Intelligent Environment, 2022-2032
Figure 95: Europe Pervasive Computing Technology Value (US$ Mn) by Application, 2022-2032
Figure 96: Europe Pervasive Computing Technology Value (US$ Mn) by Country, 2022-2032
Figure 97: Europe Pervasive Computing Technology Value (US$ Mn) Analysis by Country, 2016-2032
Figure 98: Europe Pervasive Computing Technology Value Share (%) and BPS Analysis by Country, 2022-2032
Figure 99: Europe Pervasive Computing Technology Y-o-Y Growth (%) Projections by Country, 2022-2032
Figure 100: Europe Pervasive Computing Technology Value (US$ Mn) Analysis by Products, 2016-2032
Figure 101: Europe Pervasive Computing Technology Value Share (%) and BPS Analysis by Products, 2022-2032
Figure 102: Europe Pervasive Computing Technology Y-o-Y Growth (%) Projections by Products, 2022-2032
Figure 103: Europe Pervasive Computing Technology Value (US$ Mn) Analysis by Mobile Computing, 2016-2032
Figure 104: Europe Pervasive Computing Technology Value Share (%) and BPS Analysis by Mobile Computing, 2022-2032
Figure 105: Europe Pervasive Computing Technology Y-o-Y Growth (%) Projections by Mobile Computing, 2022-2032
Figure 106: Europe Pervasive Computing Technology Value (US$ Mn) Analysis by Context Adaptation & Adaptation Application Architecture , 2016-2032
Figure 107: Europe Pervasive Computing Technology Value Share (%) and BPS Analysis by Context Adaptation & Adaptation Application Architecture , 2022-2032
Figure 108: Europe Pervasive Computing Technology Y-o-Y Growth (%) Projections by Context Adaptation & Adaptation Application Architecture , 2022-2032
Figure 109: Europe Pervasive Computing Technology Value (US$ Mn) Analysis by Intelligent Environment, 2016-2032
Figure 110: Europe Pervasive Computing Technology Value Share (%) and BPS Analysis by Intelligent Environment, 2022-2032
Figure 111: Europe Pervasive Computing Technology Y-o-Y Growth (%) Projections by Intelligent Environment, 2022-2032
Figure 112: Europe Pervasive Computing Technology Value (US$ Mn) Analysis by Application, 2016-2032
Figure 113: Europe Pervasive Computing Technology Value Share (%) and BPS Analysis by Application, 2022-2032
Figure 114: Europe Pervasive Computing Technology Y-o-Y Growth (%) Projections by Application, 2022-2032
Figure 115: Europe Pervasive Computing Technology Attractiveness by Products, 2022-2032
Figure 116: Europe Pervasive Computing Technology Attractiveness by Mobile Computing, 2022-2032
Figure 117: Europe Pervasive Computing Technology Attractiveness by Context Adaptation & Adaptation Application Architecture , 2022-2032
Figure 118: Europe Pervasive Computing Technology Attractiveness by Intelligent Environment, 2022-2032
Figure 119: Europe Pervasive Computing Technology Attractiveness by Application, 2022-2032
Figure 120: Europe Pervasive Computing Technology Attractiveness by Country, 2022-2032
Figure 121: South Asia Pervasive Computing Technology Value (US$ Mn) by Products, 2022-2032
Figure 122: South Asia Pervasive Computing Technology Value (US$ Mn) by Mobile Computing, 2022-2032
Figure 123: South Asia Pervasive Computing Technology Value (US$ Mn) by Context Adaptation & Adaptation Application Architecture , 2022-2032
Figure 124: South Asia Pervasive Computing Technology Value (US$ Mn) by Intelligent Environment, 2022-2032
Figure 125: South Asia Pervasive Computing Technology Value (US$ Mn) by Application, 2022-2032
Figure 126: South Asia Pervasive Computing Technology Value (US$ Mn) by Country, 2022-2032
Figure 127: South Asia Pervasive Computing Technology Value (US$ Mn) Analysis by Country, 2016-2032
Figure 128: South Asia Pervasive Computing Technology Value Share (%) and BPS Analysis by Country, 2022-2032
Figure 129: South Asia Pervasive Computing Technology Y-o-Y Growth (%) Projections by Country, 2022-2032
Figure 130: South Asia Pervasive Computing Technology Value (US$ Mn) Analysis by Products, 2016-2032
Figure 131: South Asia Pervasive Computing Technology Value Share (%) and BPS Analysis by Products, 2022-2032
Figure 132: South Asia Pervasive Computing Technology Y-o-Y Growth (%) Projections by Products, 2022-2032
Figure 133: South Asia Pervasive Computing Technology Value (US$ Mn) Analysis by Mobile Computing, 2016-2032
Figure 134: South Asia Pervasive Computing Technology Value Share (%) and BPS Analysis by Mobile Computing, 2022-2032
Figure 135: South Asia Pervasive Computing Technology Y-o-Y Growth (%) Projections by Mobile Computing, 2022-2032
Figure 136: South Asia Pervasive Computing Technology Value (US$ Mn) Analysis by Context Adaptation & Adaptation Application Architecture , 2016-2032
Figure 137: South Asia Pervasive Computing Technology Value Share (%) and BPS Analysis by Context Adaptation & Adaptation Application Architecture , 2022-2032
Figure 138: South Asia Pervasive Computing Technology Y-o-Y Growth (%) Projections by Context Adaptation & Adaptation Application Architecture , 2022-2032
Figure 139: South Asia Pervasive Computing Technology Value (US$ Mn) Analysis by Intelligent Environment, 2016-2032
Figure 140: South Asia Pervasive Computing Technology Value Share (%) and BPS Analysis by Intelligent Environment, 2022-2032
Figure 141: South Asia Pervasive Computing Technology Y-o-Y Growth (%) Projections by Intelligent Environment, 2022-2032
Figure 142: South Asia Pervasive Computing Technology Value (US$ Mn) Analysis by Application, 2016-2032
Figure 143: South Asia Pervasive Computing Technology Value Share (%) and BPS Analysis by Application, 2022-2032
Figure 144: South Asia Pervasive Computing Technology Y-o-Y Growth (%) Projections by Application, 2022-2032
Figure 145: South Asia Pervasive Computing Technology Attractiveness by Products, 2022-2032
Figure 146: South Asia Pervasive Computing Technology Attractiveness by Mobile Computing, 2022-2032
Figure 147: South Asia Pervasive Computing Technology Attractiveness by Context Adaptation & Adaptation Application Architecture , 2022-2032
Figure 148: South Asia Pervasive Computing Technology Attractiveness by Intelligent Environment, 2022-2032
Figure 149: South Asia Pervasive Computing Technology Attractiveness by Application, 2022-2032
Figure 150: South Asia Pervasive Computing Technology Attractiveness by Country, 2022-2032
Figure 151: East Asia Pervasive Computing Technology Value (US$ Mn) by Products, 2022-2032
Figure 152: East Asia Pervasive Computing Technology Value (US$ Mn) by Mobile Computing, 2022-2032
Figure 153: East Asia Pervasive Computing Technology Value (US$ Mn) by Context Adaptation & Adaptation Application Architecture , 2022-2032
Figure 154: East Asia Pervasive Computing Technology Value (US$ Mn) by Intelligent Environment, 2022-2032
Figure 155: East Asia Pervasive Computing Technology Value (US$ Mn) by Application, 2022-2032
Figure 156: East Asia Pervasive Computing Technology Value (US$ Mn) by Country, 2022-2032
Figure 157: East Asia Pervasive Computing Technology Value (US$ Mn) Analysis by Country, 2016-2032
Figure 158: East Asia Pervasive Computing Technology Value Share (%) and BPS Analysis by Country, 2022-2032
Figure 159: East Asia Pervasive Computing Technology Y-o-Y Growth (%) Projections by Country, 2022-2032
Figure 160: East Asia Pervasive Computing Technology Value (US$ Mn) Analysis by Products, 2016-2032
Figure 161: East Asia Pervasive Computing Technology Value Share (%) and BPS Analysis by Products, 2022-2032
Figure 162: East Asia Pervasive Computing Technology Y-o-Y Growth (%) Projections by Products, 2022-2032
Figure 163: East Asia Pervasive Computing Technology Value (US$ Mn) Analysis by Mobile Computing, 2016-2032
Figure 164: East Asia Pervasive Computing Technology Value Share (%) and BPS Analysis by Mobile Computing, 2022-2032
Figure 165: East Asia Pervasive Computing Technology Y-o-Y Growth (%) Projections by Mobile Computing, 2022-2032
Figure 166: East Asia Pervasive Computing Technology Value (US$ Mn) Analysis by Context Adaptation & Adaptation Application Architecture , 2016-2032
Figure 167: East Asia Pervasive Computing Technology Value Share (%) and BPS Analysis by Context Adaptation & Adaptation Application Architecture , 2022-2032
Figure 168: East Asia Pervasive Computing Technology Y-o-Y Growth (%) Projections by Context Adaptation & Adaptation Application Architecture , 2022-2032
Figure 169: East Asia Pervasive Computing Technology Value (US$ Mn) Analysis by Intelligent Environment, 2016-2032
Figure 170: East Asia Pervasive Computing Technology Value Share (%) and BPS Analysis by Intelligent Environment, 2022-2032
Figure 171: East Asia Pervasive Computing Technology Y-o-Y Growth (%) Projections by Intelligent Environment, 2022-2032
Figure 172: East Asia Pervasive Computing Technology Value (US$ Mn) Analysis by Application, 2016-2032
Figure 173: East Asia Pervasive Computing Technology Value Share (%) and BPS Analysis by Application, 2022-2032
Figure 174: East Asia Pervasive Computing Technology Y-o-Y Growth (%) Projections by Application, 2022-2032
Figure 175: East Asia Pervasive Computing Technology Attractiveness by Products, 2022-2032
Figure 176: East Asia Pervasive Computing Technology Attractiveness by Mobile Computing, 2022-2032
Figure 177: East Asia Pervasive Computing Technology Attractiveness by Context Adaptation & Adaptation Application Architecture , 2022-2032
Figure 178: East Asia Pervasive Computing Technology Attractiveness by Intelligent Environment, 2022-2032
Figure 179: East Asia Pervasive Computing Technology Attractiveness by Application, 2022-2032
Figure 180: East Asia Pervasive Computing Technology Attractiveness by Country, 2022-2032
Figure 181: Oceania Pervasive Computing Technology Value (US$ Mn) by Products, 2022-2032
Figure 182: Oceania Pervasive Computing Technology Value (US$ Mn) by Mobile Computing, 2022-2032
Figure 183: Oceania Pervasive Computing Technology Value (US$ Mn) by Context Adaptation & Adaptation Application Architecture , 2022-2032
Figure 184: Oceania Pervasive Computing Technology Value (US$ Mn) by Intelligent Environment, 2022-2032
Figure 185: Oceania Pervasive Computing Technology Value (US$ Mn) by Application, 2022-2032
Figure 186: Oceania Pervasive Computing Technology Value (US$ Mn) by Country, 2022-2032
Figure 187: Oceania Pervasive Computing Technology Value (US$ Mn) Analysis by Country, 2016-2032
Figure 188: Oceania Pervasive Computing Technology Value Share (%) and BPS Analysis by Country, 2022-2032
Figure 189: Oceania Pervasive Computing Technology Y-o-Y Growth (%) Projections by Country, 2022-2032
Figure 190: Oceania Pervasive Computing Technology Value (US$ Mn) Analysis by Products, 2016-2032
Figure 191: Oceania Pervasive Computing Technology Value Share (%) and BPS Analysis by Products, 2022-2032
Figure 192: Oceania Pervasive Computing Technology Y-o-Y Growth (%) Projections by Products, 2022-2032
Figure 193: Oceania Pervasive Computing Technology Value (US$ Mn) Analysis by Mobile Computing, 2016-2032
Figure 194: Oceania Pervasive Computing Technology Value Share (%) and BPS Analysis by Mobile Computing, 2022-2032
Figure 195: Oceania Pervasive Computing Technology Y-o-Y Growth (%) Projections by Mobile Computing, 2022-2032
Figure 196: Oceania Pervasive Computing Technology Value (US$ Mn) Analysis by Context Adaptation & Adaptation Application Architecture , 2016-2032
Figure 197: Oceania Pervasive Computing Technology Value Share (%) and BPS Analysis by Context Adaptation & Adaptation Application Architecture , 2022-2032
Figure 198: Oceania Pervasive Computing Technology Y-o-Y Growth (%) Projections by Context Adaptation & Adaptation Application Architecture , 2022-2032
Figure 199: Oceania Pervasive Computing Technology Value (US$ Mn) Analysis by Intelligent Environment, 2016-2032
Figure 200: Oceania Pervasive Computing Technology Value Share (%) and BPS Analysis by Intelligent Environment, 2022-2032
Figure 201: Oceania Pervasive Computing Technology Y-o-Y Growth (%) Projections by Intelligent Environment, 2022-2032
Figure 202: Oceania Pervasive Computing Technology Value (US$ Mn) Analysis by Application, 2016-2032
Figure 203: Oceania Pervasive Computing Technology Value Share (%) and BPS Analysis by Application, 2022-2032
Figure 204: Oceania Pervasive Computing Technology Y-o-Y Growth (%) Projections by Application, 2022-2032
Figure 205: Oceania Pervasive Computing Technology Attractiveness by Products, 2022-2032
Figure 206: Oceania Pervasive Computing Technology Attractiveness by Mobile Computing, 2022-2032
Figure 207: Oceania Pervasive Computing Technology Attractiveness by Context Adaptation & Adaptation Application Architecture , 2022-2032
Figure 208: Oceania Pervasive Computing Technology Attractiveness by Intelligent Environment, 2022-2032
Figure 209: Oceania Pervasive Computing Technology Attractiveness by Application, 2022-2032
Figure 210: Oceania Pervasive Computing Technology Attractiveness by Country, 2022-2032
Figure 211: MEA Pervasive Computing Technology Value (US$ Mn) by Products, 2022-2032
Figure 212: MEA Pervasive Computing Technology Value (US$ Mn) by Mobile Computing, 2022-2032
Figure 213: MEA Pervasive Computing Technology Value (US$ Mn) by Context Adaptation & Adaptation Application Architecture , 2022-2032
Figure 214: MEA Pervasive Computing Technology Value (US$ Mn) by Intelligent Environment, 2022-2032
Figure 215: MEA Pervasive Computing Technology Value (US$ Mn) by Application, 2022-2032
Figure 216: MEA Pervasive Computing Technology Value (US$ Mn) by Country, 2022-2032
Figure 217: MEA Pervasive Computing Technology Value (US$ Mn) Analysis by Country, 2016-2032
Figure 218: MEA Pervasive Computing Technology Value Share (%) and BPS Analysis by Country, 2022-2032
Figure 219: MEA Pervasive Computing Technology Y-o-Y Growth (%) Projections by Country, 2022-2032
Figure 220: MEA Pervasive Computing Technology Value (US$ Mn) Analysis by Products, 2016-2032
Figure 221: MEA Pervasive Computing Technology Value Share (%) and BPS Analysis by Products, 2022-2032
Figure 222: MEA Pervasive Computing Technology Y-o-Y Growth (%) Projections by Products, 2022-2032
Figure 223: MEA Pervasive Computing Technology Value (US$ Mn) Analysis by Mobile Computing, 2016-2032
Figure 224: MEA Pervasive Computing Technology Value Share (%) and BPS Analysis by Mobile Computing, 2022-2032
Figure 225: MEA Pervasive Computing Technology Y-o-Y Growth (%) Projections by Mobile Computing, 2022-2032
Figure 226: MEA Pervasive Computing Technology Value (US$ Mn) Analysis by Context Adaptation & Adaptation Application Architecture , 2016-2032
Figure 227: MEA Pervasive Computing Technology Value Share (%) and BPS Analysis by Context Adaptation & Adaptation Application Architecture , 2022-2032
Figure 228: MEA Pervasive Computing Technology Y-o-Y Growth (%) Projections by Context Adaptation & Adaptation Application Architecture , 2022-2032
Figure 229: MEA Pervasive Computing Technology Value (US$ Mn) Analysis by Intelligent Environment, 2016-2032
Figure 230: MEA Pervasive Computing Technology Value Share (%) and BPS Analysis by Intelligent Environment, 2022-2032
Figure 231: MEA Pervasive Computing Technology Y-o-Y Growth (%) Projections by Intelligent Environment, 2022-2032
Figure 232: MEA Pervasive Computing Technology Value (US$ Mn) Analysis by Application, 2016-2032
Figure 233: MEA Pervasive Computing Technology Value Share (%) and BPS Analysis by Application, 2022-2032
Figure 234: MEA Pervasive Computing Technology Y-o-Y Growth (%) Projections by Application, 2022-2032
Figure 235: MEA Pervasive Computing Technology Attractiveness by Products, 2022-2032
Figure 236: MEA Pervasive Computing Technology Attractiveness by Mobile Computing, 2022-2032
Figure 237: MEA Pervasive Computing Technology Attractiveness by Context Adaptation & Adaptation Application Architecture , 2022-2032
Figure 238: MEA Pervasive Computing Technology Attractiveness by Intelligent Environment, 2022-2032
Figure 239: MEA Pervasive Computing Technology Attractiveness by Application, 2022-2032
Figure 240: MEA Pervasive Computing Technology Attractiveness by Country, 2022-2032
FMI projects the global pervasive computing technology market to expand at a 19.9% value CAGR by 2032
North America is expected to be the most opportunistic with a 40.1% share of the total pervasive computing technology market
Blazon Marketing Inc., E-Tron CO., Ltd., Hewlett-Packard, Neo Mtel Co., Ltd., Palo Alto Research center Incorporated (PARC), AT&T Inc., Maruhachi Warehouse Co., Ltd., IBM Corporation are some prominent pervasive computing technology, market manufacturers.
Explore Similar Insights
Thank you!
You will receive an email from our Business Development Manager. Please be sure to check your SPAM/JUNK folder too.